Corresponding Author: Francesco Ricci
Affiliation: Chemistry Department of the University of Rome
Research Background
In recent years, the field of nucleic acid nanotechnology has developed rapidly, paving the way for the development of innovative materials and biomolecular structures utilizing the programmable properties of nucleic acid interactions. DNA/RNA condensates, as synthetic analogs of natural cells or membrane-less compartments, have attracted considerable attention, providing a platform for studying and engineering biomolecular processes in a controllable and customizable environment, with potential applications across various fields. However, in nature, membrane-less organelles and cellular condensates are typically formed through complex networks of protein-protein or protein-nucleic acid interactions, leading to the dynamic and regulated assembly of complex biomolecular structures. Existing DNA/RNA condensates lack the general characteristics of natural cellular compartments, ultimately limiting the programmability and multifunctionality of these tools. To simulate the various molecular interactions occurring in natural cellular systems, the authors report here the combined use of Watson-Crick and specific antibody-antigen interactions to induce the phase separation of antibody-DNA hybrid aggregates.
Illustrative Interpretation
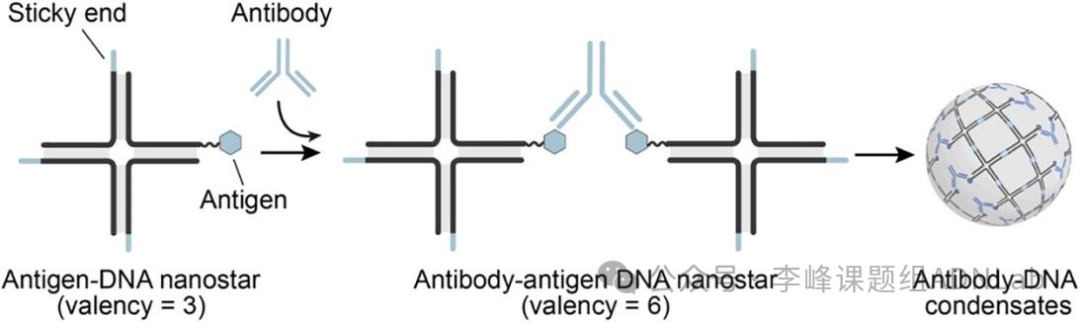
Figure 1. Schematic of antigen-binding DNA nanostars. The four-armed nanostar is designed with three arms ending in 6-nt sticky ends, while the fourth arm is chemically conjugated to the antigen at the 5′ end. The nanostar is designed to separate into antibody-DNA hybrid aggregates only through the synergistic effect of base pairing between sticky ends and bivalent antibody binding (linking two antigen-binding DNA nanostars).
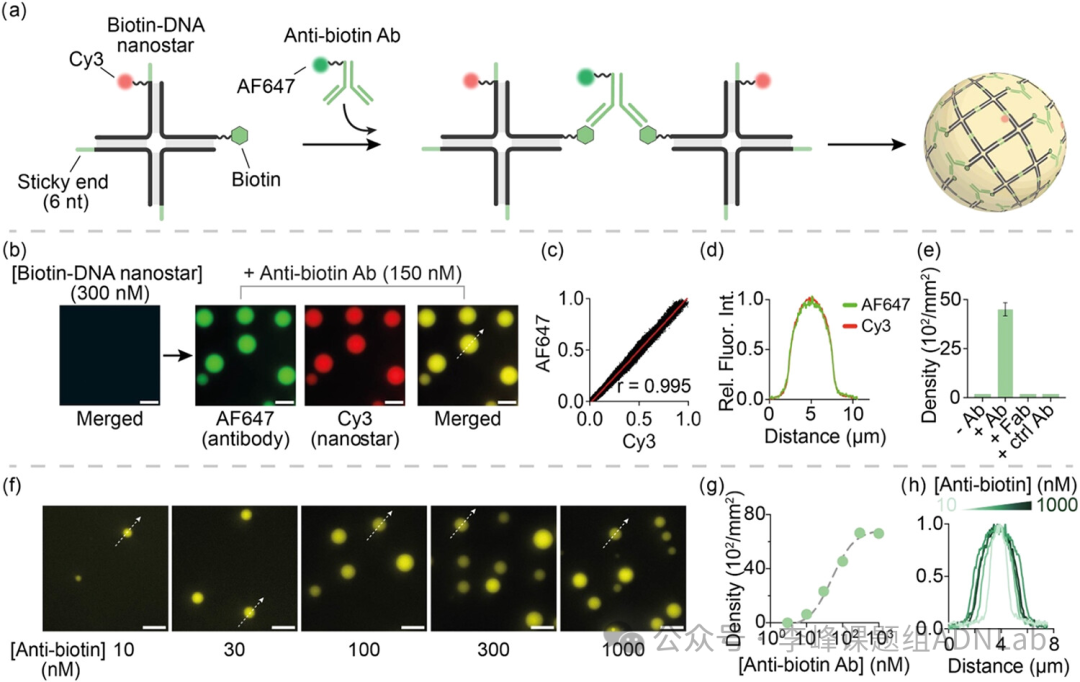
Figure 2. Phase separation of antibody-DNA hybrids through the formation of biotin and anti-biotin antibody complexes.(a) Schematic of biotin-DNA nanostars (labeled with Cy3 fluorophore), which only phase separate into aggregates in the presence of anti-biotin antibodies (labeled with AF647 fluorophore).(b) Fluorescence micrographs of biotin-DNA nanostars (300 nM) in the presence and absence of anti-biotin antibodies (150 nM).(c) Scatter plot measuring pixel intensity, showing the correlation of Cy3 (biotin-DNA nanostars) and Alexa 647 (anti-biotin antibodies) fluorophores in samples containing antibody-DNA hybrid aggregates (Pearson correlation coefficient, r).(d) Fluorescence intensity line plots of labeled biotin-DNA nanostars and anti-biotin antibodies along the dashed lines in adjacent micrographs (merged).(e) Density values (count/mm2) of aggregates obtained with and without anti-biotin antibodies, with anti-biotin monovalent Fab fragments, and control non-specific antibodies (anti-Dig, anti-DNP, or anti-MUC1).(f) Fluorescence micrographs of antibody-DNA hybrid aggregates at different concentrations of anti-biotin antibodies (merged channels).(g) Graph of aggregate density versus anti-biotin antibody concentration. The gray dashed line indicates the fit to theoretical data.(h) Fluorescence intensity line plots of labeled anti-biotin antibodies along the dashed lines in adjacent micrographs (merged). For each case, representative aggregates were considered, with areas corresponding to the average area of the samples. Experiments were conducted in a buffer of 10 mM Tris HCl and 0.5 M NaCl, pH 7.5, at a temperature of 25°C. Microscopy images were obtained 1 hour after adding antibodies, with scale bars of 5 μm.
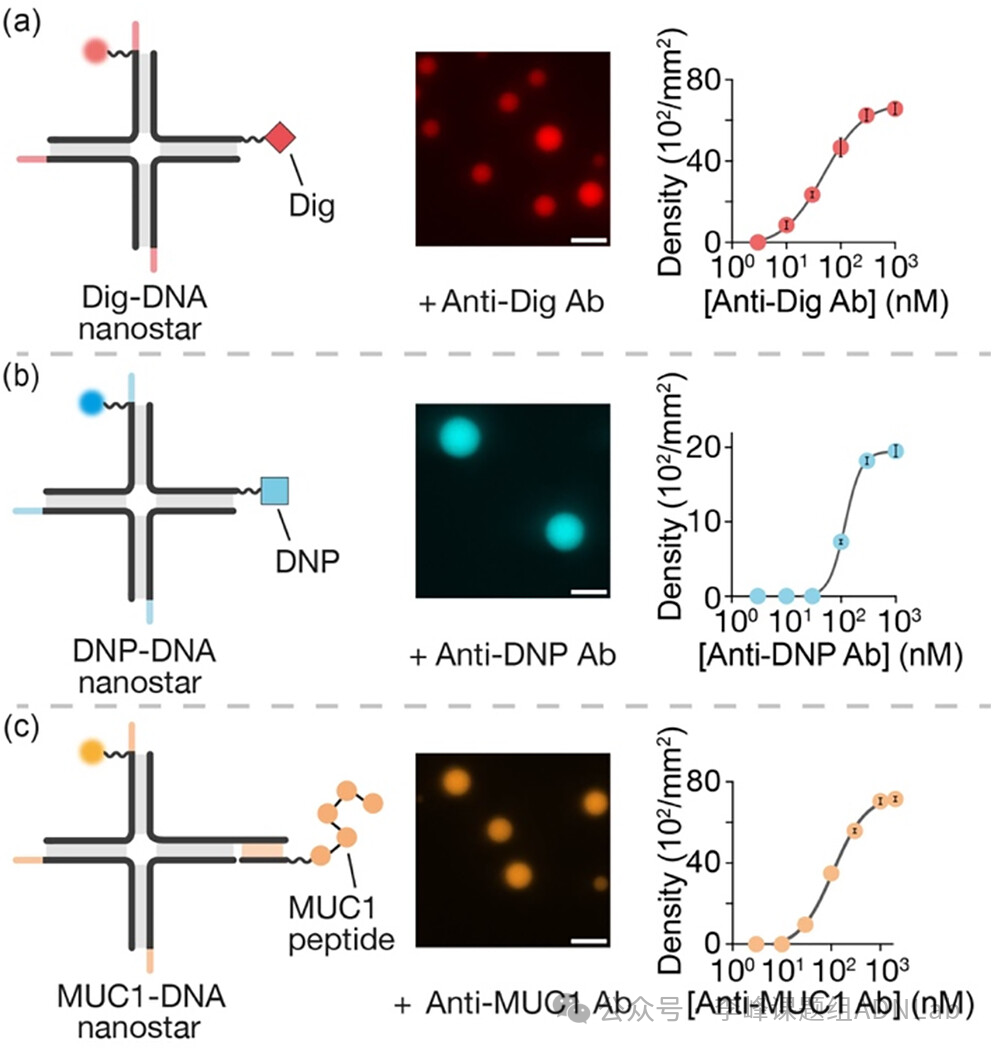
Figure 3. Phase separation of antibody-DNA hybrid aggregates with different antibody-antigen pairs. Each row depicts (left) a schematic of the four-armed DNA nanostars, each binding to different antigens; (middle) fluorescence micrographs of antigen-conjugated DNA nanostars (300 nM) in the presence of specific antibodies (150 nM); (right) graphs of aggregate density versus specific antibody concentration. The antibody-antigen pairs used here are(a) Dig and anti-Dig antibodies,(b) DNP and anti-DNP antibodies, (c) MUC1 peptide and anti-MUC1 antibodies; experiments were conducted in a buffer of 10 mM Tris HCl and 0.5 M NaCl, pH 7.5, at a temperature of 25°C. Microscopy images were taken 1 hour after adding specific antibodies, with scale bars of 5 μm.
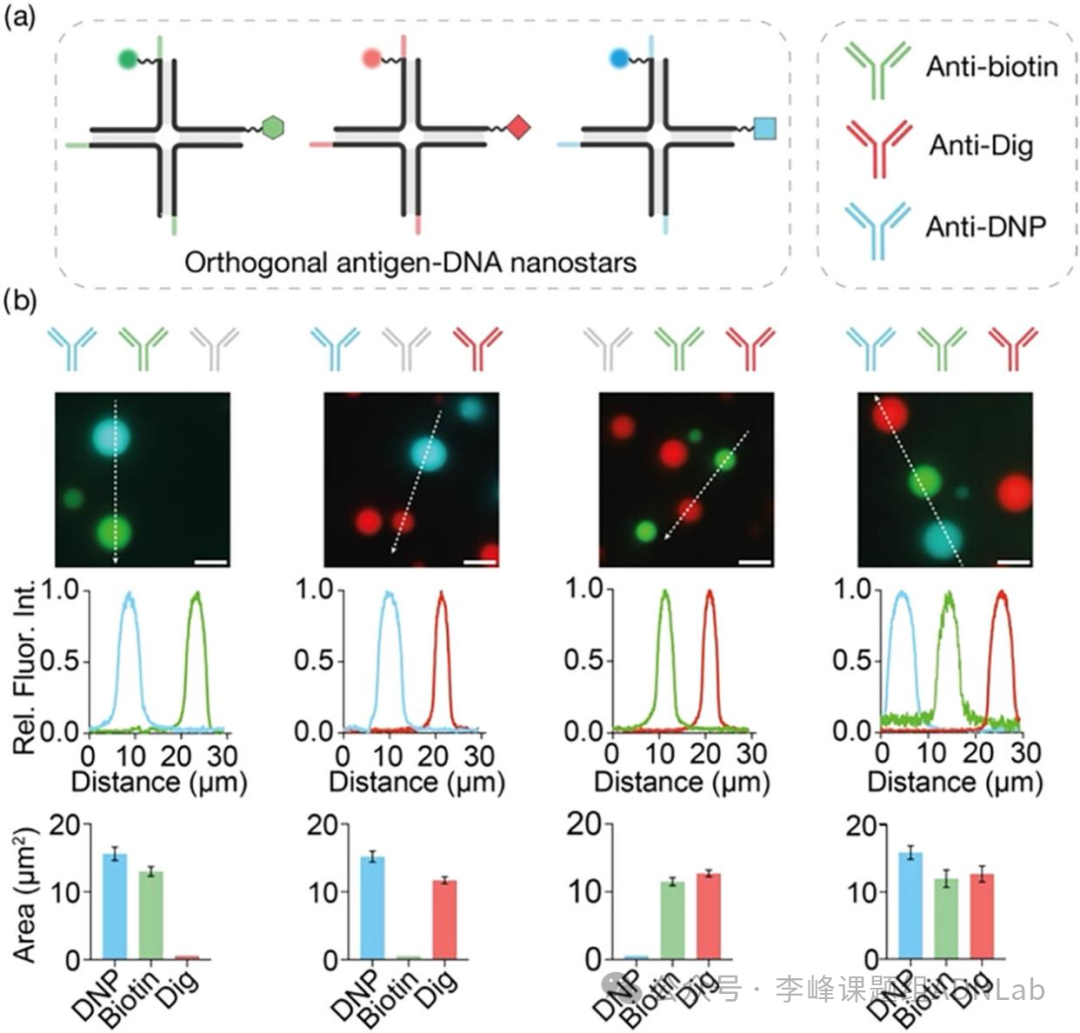
Figure 4. Orthogonal antibody-DNA hybrid aggregates.(a) Shows a scheme of three orthogonal antigen-binding DNA nanostars, each with different sticky end sequences, responding to different antibodies and labeled with different fluorophores.(b) (Top) Merged fluorescence micrographs obtained by adding each antibody in different combinations (the colored antibodies at the top of each micrograph represent the antibodies added). (Middle) Fluorescence intensity line plots of labeled antigen-binding DNA nanostars along the dashed lines in the merged micrographs. (Bottom) Bar graphs showing the average aggregate area measured for each fluorophore. Experiments were conducted in a buffer of 10 mM Tris HCl and 0.5 M NaCl, pH 7.5, at a temperature of 25°C. Microscopy images were taken 1 hour after adding the relevant antibodies, with all scale bars of 5 μm.
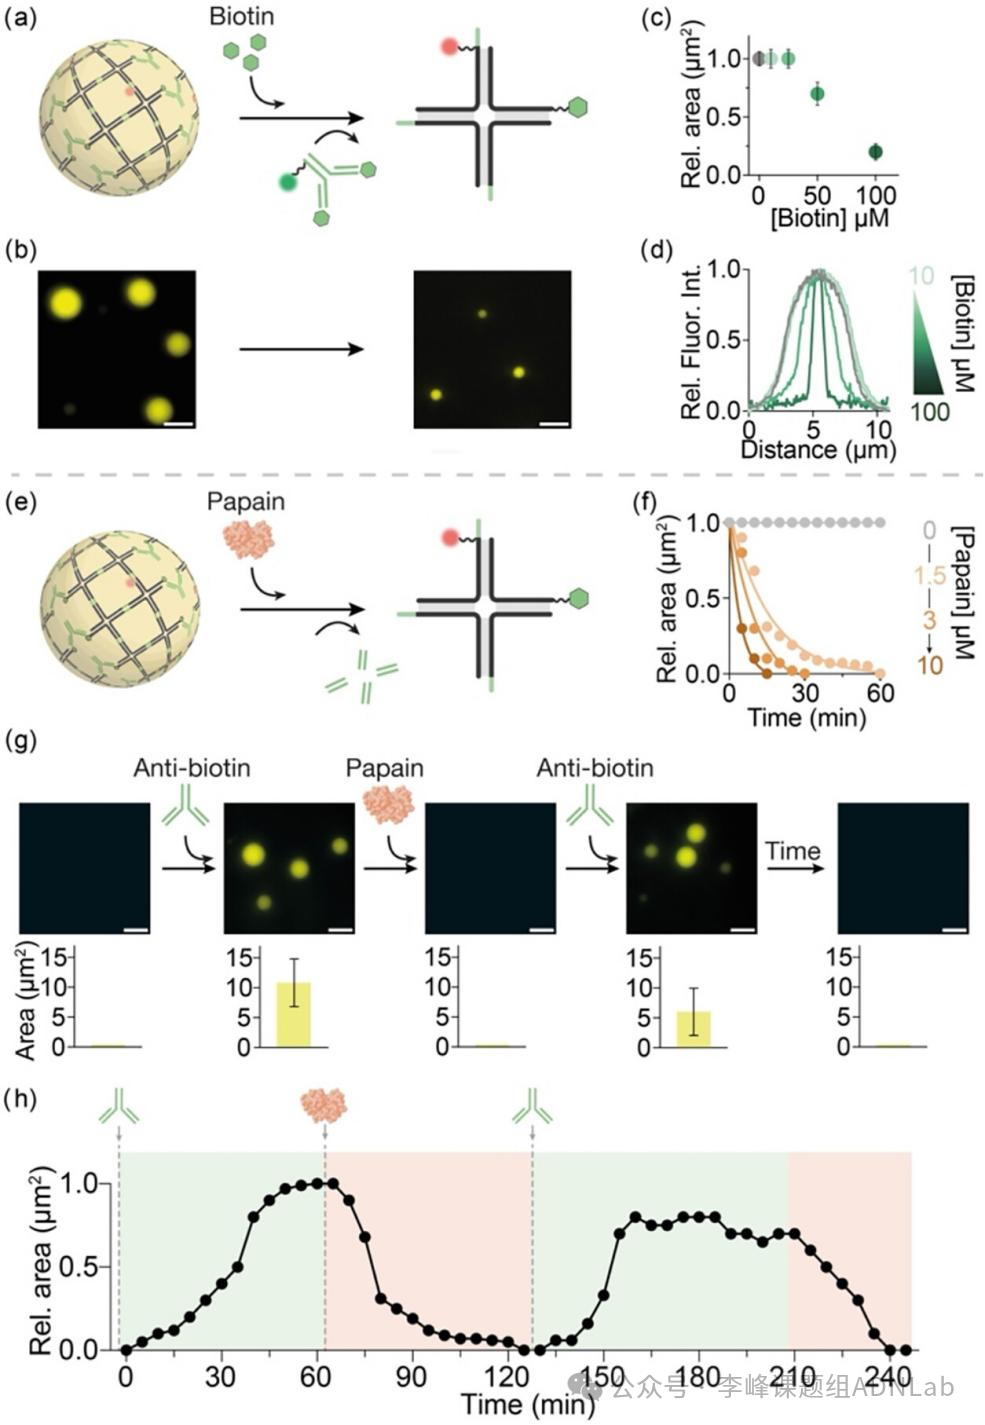
Figure 5. Programmable dissolution of antibody-DNA hybrid aggregates.(a) Schematic of antibody-DNA hybrid aggregates competing for dissolution with free antigens.(b) Fluorescence micrographs showing the dissolution of biotin antibody-DNA aggregates after the addition of free biotin (100 μM).(c) Graph of normalized average area versus free biotin concentration.(d) Fluorescence intensity line plots of labeled anti-biotin antibodies in hybrid aggregates after adding different concentrations of free biotin.(e) Schematic of papain-driven dissolution of biotin antibody-DNA hybrid aggregates.(f) Graph showing the change in normalized average area of antibody-DNA hybrid aggregates over time at different degradation times with varying papain concentrations.(g) (Top) Fluorescence micrographs of biotin antibody-DNA aggregates after cyclic addition of anti-biotin antibodies and papain. (Bottom) Average area of aggregates measured after each addition.(h) Graph showing the change in normalized average area of antibody-DNA hybrid aggregates over time after cyclic addition of anti-biotin antibodies and papain. Experiments were conducted in a buffer of 10 mM Tris HCl, 0.5 M NaCl, 15 mM cysteine, pH 7.5, at a temperature of 25°C. [biotin-DNA nanostars] = 300 nM, [anti-biotin antibodies] = 150 nM. Unless otherwise specified, papain was added at a concentration of 1.5 μM, with all microscopy images having scale bars of 5 μm.
Conclusion
The authors designed antigen-conjugated four-armed DNA nanostars that only phase separate into micron-sized droplets in the presence of specific bivalent antibodies recognizing the antigens. Due to the specificity of the interactions during phase separation, different antigen-conjugated nanostars can be rationally designed to achieve orthogonal phase separation in the presence of different antibodies. This immuno-induced phase separation also occurs as a function of antibody concentration, demonstrating its potential for sensing applications. This multicomponent approach expands the scope of DNA nanotechnology and synthetic biology, providing new opportunities for developing advanced biomaterials utilizing the synergistic interactions between DNA, proteins, RNA, and small molecules.
Original Link
https://doi.org/10.1021/jacs.5c13855
Click the lower left corner “Read the original” to access the original text directly

Scan to Follow
ADNLab
Research Group Website |http://adnlab.mysxl.cn/