Wageningen University Chem Soc Rev Paper | Integrating Genomics and Metabolomics to Map Specialized Metabolic Diversity
- Wageningen University Chem Soc Rev Paper | Integrating Genomics and Metabolomics to Map Specialized Metabolic Diversity
- 1. Paper Introduction
- 2. Paper Abstract
- 3. Introduction
- 4. Genome Mining
- 5. Metabolomics Mining
- 6. Integration of Metagenomics
- 7. Opportunities
1. Paper Introduction
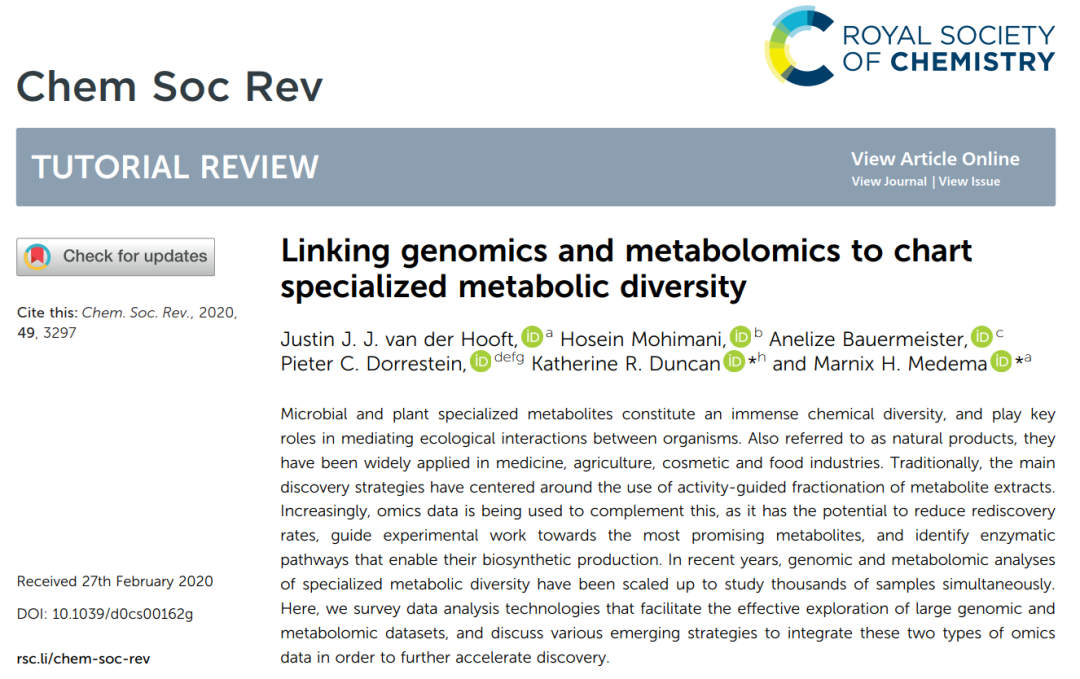
van Der Hooft J J J, Mohimani H, Bauermeister A, et al. Linking genomics and metabolomics to chart specialized metabolic diversity[J]. Chemical Society Reviews, 2020, 49(11): 3297-3314.
1.1 Author Introduction
- Corresponding author: Marnix H. Medema is a professor at Wageningen University in the Netherlands, a computational biologist studying the complexity of microbial metabolism. He is fascinated by the complexity of even the “simplest” organisms and how they have evolved (and are evolving) to this day. The computational study of this complexity through genomic and post-genomic data deeply attracts him, leading him to the captivating field of informatics. By constructing computer programs and developing new methods to explore large datasets, he aims to understand microbial metabolites from quantitative and evolutionary perspectives. His research has broad applications in microbiome studies, bioengineering, and drug development.
2. Paper Abstract
2.1 Abstract
Microbial and plant-specific metabolites constitute an extremely rich chemical diversity and play a key role in ecological interactions between organisms. These metabolites, also known as natural products, have been widely applied in industries such as medicine, agriculture, cosmetics, and food. Traditionally, the main discovery strategy has been to utilize activity-guided fractionation of metabolite extracts. Today, omics data is increasingly being used to complement this strategy, as it can reduce the rate of rediscovery, guide experimental work to focus on the most promising metabolites, and identify the enzymatic pathways required for their biosynthesis. In recent years, genomic and metabolomic analyses targeting specialized metabolic diversity have expanded to study thousands of samples simultaneously. This paper reviews data analysis techniques that aid in effectively exploring large genomic and metabolomic datasets and discusses various emerging strategies for integrating these two omics data to further accelerate discovery.
2.2 Key Learning Points
-
The discovery of natural products is shifting from single strains to environmental strain libraries and microbiomes, thanks to the emergence of large-scale multi-omics data.
-
Network analysis of genomics and metabolomics can provide an overview of biosynthetic diversity and help prioritize key novel metabolites by combining relevant metadata (samples, activity, phenotypes).
-
The chemical substructures and modifications of natural products can be predicted using genomic and metabolomic data, but predictions are more reliable when integrating these two omics data.
-
Matching metabolites with gene clusters can identify strains that produce these metabolites and facilitate studies on their biosynthesis and ecological functions.
-
The increasing availability of publicly accessible paired omics data and further development of algorithms will enable high-throughput structural characterization of natural products.
3. Introduction
Almost all forms of life possess the ability to produce specific molecules that distinguish them from other organisms and help them cope with unique challenges in their native environments. These specialized metabolites (also known as natural products) facilitate various mechanisms such as chemical warfare, communication, nutrient acquisition, or stress protection. Chemically, these metabolites belong to various categories, including peptides, polyketides, flavonoids, terpenes, and carbohydrates. The vast chemical space and the astonishing diversity and dynamics of ecological interactions and selective pressures drive organisms on the tree of life to produce hundreds of thousands of structurally diverse metabolites that we know today.
Naturally, this rich resource has been widely used in drug development. Many antibiotics, chemotherapeutic agents, and other drugs are themselves natural products or inspired by natural products. In recent years, a range of antibiotics has been discovered, providing a new arsenal against multidrug-resistant superbugs. Furthermore, natural products have been used as crop protectants and as raw materials for food, cosmetics, dyes, and many other products.
In recent years, there has been a growing interest in specialized metabolites: they are key mediators of molecular interactions in microbial communities and serve as a “chemical language” that underpins many phenotypes associated with microbial communities. For example, the suppression of fungal diseases by plant microbiomes is related to the biosynthesis of lipopeptides (such as tonabamine) produced by specific Pseudomonas strains in the rhizosphere, while endophytic microbiomes contain other biosynthetic pathways crucial for disease suppression. In the human microbiome, Staphylococcus producing the non-ribosomal peptide lugdunin has been shown to inhibit the colonization of its pathogenic relative Staphylococcus aureus, while N-acyl amides produced by various gut bacteria have been demonstrated to regulate host metabolism.
Traditionally, most natural product discoveries have been achieved through bioactivity-guided fractionation of chemical extracts from individual microbes and plants. This has allowed cataloging thousands of metabolites and elucidating their structures, providing much of the knowledge in today’s natural product diversity. However, the lag in obtaining and integrating key analytical information and the resulting high rate of rediscovery have made this approach inefficient.
With the advent of DNA sequencing technologies, it has become increasingly recognized that the genomes of natural product-producing organisms encode biosynthetic gene clusters (BGCs) that are responsible for many metabolites that have never been observed in the laboratory. In bacteria and fungi, most biosynthetic pathways are encoded by BGCs; in plants, a significant number of pathways (though not all) also show signs of genomic clustering. These findings have led to the emergence of genome mining techniques used to identify biosynthetic pathways for known and unknown metabolites.5
Moreover, advances in untargeted metabolomics and tandem mass spectrometry (MS/MS) data analysis methods have made comprehensive analysis of molecular components in metabolite extracts possible.6 This has enabled the identification of natural products in complex extracts that may have been “hidden” in difficult-to-detect substances. In microbiomes, these advances have greatly facilitated the identification of metabolites, for which traditional methods often struggle to isolate sufficient quantities for structural elucidation.
Subsequently, the technologies for collecting genomic and metabolomic data and the computational tools for analyzing these data have rapidly developed. Thus, driven by these advancements, the starting point and scale of natural product discovery are shifting from single organisms to collections of multiple organisms, as well as natural communities such as microbiomes. The acquisition of large-scale metabolomic data from numerous bacterial strains7 or plants8 is becoming increasingly feasible. Similarly, genome sequencing and assembly technologies have undergone several revolutionary changes, making it possible to sequence thousands of genomes9 and reconstruct hundreds of thousands of genomic drafts from metagenomes (see references10 and the references therein).
In recent years, our laboratory and others have developed various tools capable of analyzing such large-scale genomic and metabolomic data from a macro perspective. These tools facilitate the visualization and analysis of data from hundreds to thousands of organisms11,12 and predict chemical (sub)structures from omics data through algorithms. These advancements are opening up a range of potential new methods that can not only mine genomes and metabolomes at scale separately but also do so in an integrated manner. In this tutorial review, we will outline the key technologies developed for genome and metabolome mining and present our vision for how these technologies can be combined to discover metabolites and their biosynthetic gene clusters based on integrated omics, elucidate the structures of natural products, and identify their bioactivities and ecological functions.
4. Genome Mining
The genome mining process (Figure 1) consists of several steps, including genome assembly and annotation, identification of biosynthetic genes and gene clusters, prediction of natural product structures based on sequences, and comparative genomic analysis to identify similarities and differences between organisms.
The assembled and annotated genome sequences typically constitute the raw material for genome mining. It must be recognized that the quality of assembly and annotation can significantly impact any genome-based analysis results. For example, in a “fragmented” genome assembly containing many small contigs, biosynthetic gene clusters (BGCs) are likely to be split into many fragments distributed across different contigs. In fact, due to their repetitive organizational structure, genes encoding modular polyketide synthase (PKS) and non-ribosomal peptide synthetase (NRPS) assembly lines are often located at the breakpoints of contigs. Typically, some BGC fragments are located on very small contigs that are too small for BGC identification algorithms to recognize.
Obtaining fully contiguous biosynthetic gene cluster (BGC) sequences from metagenomic data is highly challenging. Microbial communities are clearly a valuable resource for natural product discovery, but assembling unordered second-generation sequencing reads from hundreds or thousands of (sometimes highly similar) organisms into contigs corresponding to the same source genomic regions is very difficult. BiosyntheticSPAdes13 is a metagenomic assembler specifically designed to assemble biosynthetic gene clusters (BGCs) from metagenomes, utilizing the structure of assembly graphs to provide clues on how to combine multiple contigs into fragments encoding long biosynthetic gene clusters (BGCs). On the MiBIG dataset of biosynthetic gene clusters (BGCs), BiosyntheticSPAdes correctly assembles approximately twice the number of biosynthetic gene clusters (BGCs) into single contigs compared to previous assembly algorithms.
In addition to the continuity of assembly results, accuracy is also critically important. Errors in assembly frequently occur, especially when assembling genomes using low-coverage short-read data. When this happens within a biosynthetic gene cluster (BGC), for example, it may lead to skipping or duplication of non-ribosomal peptide synthetase (NRPS) or polyketide synthase (PKS) modules, particularly when their sequences are highly similar. Alternatively, it may lead to swaps that obscure the true order of genes or protein domains. Sometimes, BGCs may be split into seemingly independent fragments located in different genomic regions. Long-read sequencing technologies provided by Pacific Biosciences and Oxford Nanopore Technologies also have their own issues, as higher error rates can sometimes introduce false frameshift mutations, splitting genes into multiple fragments or leading to misannotations of premature stop codons.
Once assembly is complete, annotation of gene start and stop coordinates within the genome is a critical step. For bacterial genomes, this has largely been a solved problem, with modern gene prediction tools able to identify approximately 99% of genes and provide correct start sites for over 90% of genes. However, there are still cases where genome annotation may miss key genes. For example, the biosynthetic pathways of ribosomally synthesized and post-translationally modified peptides (RiPPs) often involve small genes encoding peptide precursors, which can be as short as 20-30 base pairs; even the best gene prediction algorithms often miss these genes. Therefore, RiPP genome mining algorithms like RODEO14 scan six-frame translation sequences annotated as “intergenic regions” within prioritized genomic loci to search for such short genes. In fungi, plants, and most other eukaryotes, the presence of introns makes gene prediction more challenging. For these organisms, it is often necessary to map transcriptomic data to the genome to accurately identify coding sequences. However, many genes involved in specialized metabolism are not expressed under typical conditions, leading to frequent misannotations. Using mixed transcriptomic samples from various biotic and abiotic stress conditions can partially address this issue.
Various tools have been developed to identify biosynthetic gene clusters (BGCs) in genomic sequences. For example, antiSMASH identifies BGCs in bacterial and fungal genomes through a rule-based system that looks for specific enzyme domain combinations encoded within the same genomic neighborhood (using profile hidden Markov models [pHMMs] for detection). Currently, this database contains detection rules for 52 different types of biosynthetic gene clusters (BGCs), all of which have been carefully reviewed by experts.15 This concept has also been extended to plant genome mining, although the types of rules differ slightly, aiming to distinguish true gene clusters from common tandem repeat sequences in plant genomes.16 For publicly available bacterial genomes and metagenomes, pre-computed antiSMASH results can be accessed through the antiSMASH-DB and IMG-ABC databases;17,18 this not only avoids the need to wait for the antiSMASH web server to analyze these genomes but also facilitates searching for BGCs with specific features across all genomes.
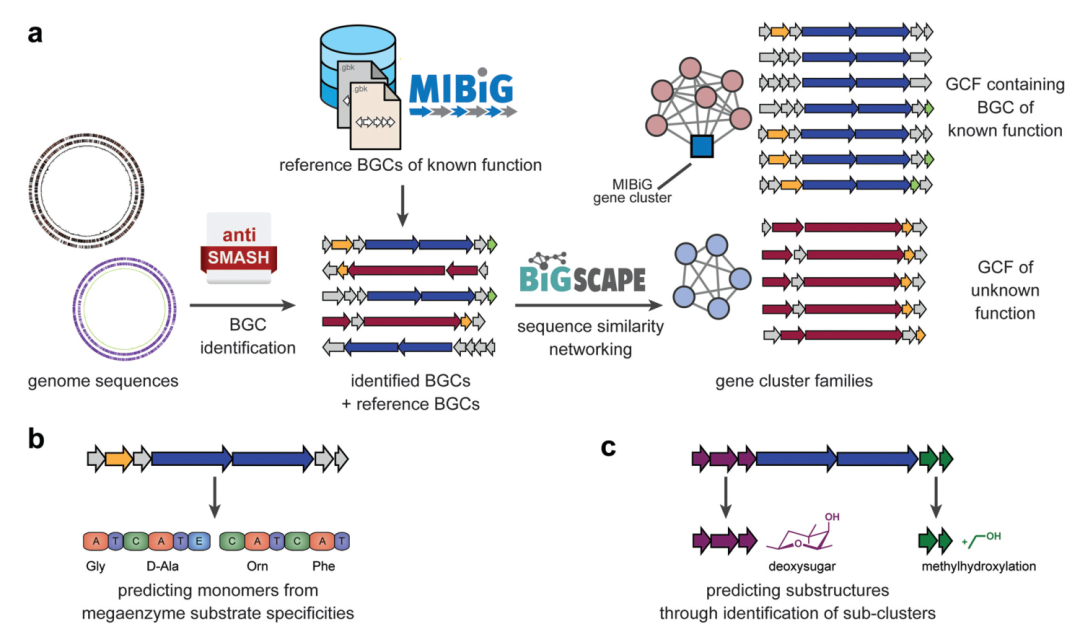
Fig. 1 Computational approaches to mine genomes for metabolic diversity.
Over the past few decades, many biosynthetic gene clusters (BGCs) have been experimentally linked to specific natural products with defined chemical structures. To efficiently acquire this knowledge, a community standard has been introduced: the Minimum Information about a Biosynthetic Gene cluster (MIBiG)19. This standard covers a range of metadata, including the genomic coordinates of the biosynthetic gene cluster (BGC), the chemical structure of its products, and the functions of enzymes encoded by the gene cluster. Additionally, it has established cross-links with the Natural Products Atlas (NPAtlas)20 (a microbial natural product structure database) and the Global Natural Products Social (GNPS) knowledge base that stores metabolomics data11 (more discussion in the next section). Since all MIBiG data is stored in a standardized ontology, it can be easily searched, and this dataset can serve as a reference for annotation; in antiSMASH, this allows us to identify which biosynthetic gene clusters (BGCs) are highly similar to known functional biosynthetic gene clusters (BGCs) (and may be functionally equivalent) (Figure 1a). All MIBiG data is stored in an online repository, which currently contains approximately 2000 validated gene cluster-molecule pairs.21
However, given the immense diversity of biosynthesis in nature, the vast majority of biosynthetic gene clusters (BGCs) in publicly available genomes have no close association with any MIBiG reference gene clusters. Various computational methods have emerged to predict the (core) chemical structures of their products from scratch. These methods are guided by a deep understanding of the enzymatic mechanisms involved in the generation of these metabolites. For example, modular polyketide synthases (PKS) and non-ribosomal peptide synthetases (NRPS) form an “assembly line” composed of multiple enzyme modules, each of which integrates a monomer (e.g., an amino acid) into a continuously growing chain that is ultimately released and then cyclized and/or modified by other modifying enzymes. These PKS and NRPS modules contain specific domains that are involved in selecting which monomers are integrated: the acyltransferase (AT) domain of PKS and the adenylation (A) domain of NRPS. The residues surrounding their active sites largely determine substrate specificity. Therefore, various algorithms have been developed, ranging from simple motif matching to complex machine learning models, to predict substrate specificity based on sequence information (Figure 1b). For example, SANDPUMA predicts the specificity of A domains using phylogenetic, heuristic motif matching, support vector machines, and pHMM algorithms, and then combines these predictions into a consensus prediction using integrated supervised machine learning.22 By combining the predictions from individual modules, tools like antiSMASH15 and PRISM23 can predict the sequences of monomers integrated into the core polyketide or peptide backbone. PRISM also attempts to predict cyclization and modification reactions after assembly, providing all chemically feasible reaction combinations given an initial prediction of the core backbone. However, this often leads to an explosive growth of combinatorial possibilities, and currently, there is no effective method to distinguish the most likely actual structures from less likely ones based solely on sequence data. For biosynthetic gene clusters (BGCs) that are not closely related to known product gene clusters, predicting the complete structure of their products is highly challenging, and predicting core backbones and/or lists of predicted chemical features and modifications is often more realistic. For most categories of biosynthetic gene clusters (BGCs) outside of non-modular polyketide synthases (PKS) and non-ribosomal peptide synthetases (NRPS), there are few tools available even for assessing the structure of core backbones. However, predictions of chemical features can also be made without attempting to predict complete structures, for example, by identifying subclusters within biosynthetic gene clusters (BGCs): these subclusters are groups of genes that exist in multiple different BGCs, and in each BGC, they encode the biosynthesis of specific substructures that are part of each BGC’s final product (Figure 1c). AntiSMASH identifies such subclusters by comparing them to annotated subclusters with known functions in reference BGCs, but recently, a preliminary method for de novo identification of subclusters based on statistical associations of gene families within BGCs has also been established.24 Even functionally unannotated subclusters may be responsible for the production of specific chemical substructures, which presents an interesting opportunity for matching with metabolomics data.
The scaling up of (meta)genomic sequencing has enabled the sequencing and/or reconstruction of hundreds of thousands of genomes. Given the vast diversity of biosynthetic gene clusters (BGCs) in these genomes, this presents unprecedented potential for genome mining efforts. However, performing “traditional” analyses of individual genomes using tools like antiSMASH is not suitable for such analyses, as manually reviewing thousands of output results and corresponding predictions of biosynthetic gene clusters (BGCs) would take years. Therefore, sequence similarity network approaches have been developed that can systematically map relationships between thousands of biosynthetic gene clusters (BGCs) and group them into gene cluster families (GCFs): collections of biosynthetic gene clusters (BGCs) with similar gene compositions that encode the same or highly similar molecules. This approach was initially developed in parallel by several research groups (see the review in reference 5), and has recently been formalized, accelerated, and simplified in the BiG-SCAPE software12. BiG-SCAPE takes biosynthetic gene clusters (BGCs) from antiSMASH and MIBiG as input and groups biosynthetic gene clusters (BGCs) at multiple levels using an optimized combination of various metrics. Specifically, it includes metrics that measure the degree of protein domain sharing, collinearity conservation, and amino acid sequence identity between pairs of biosynthetic gene clusters (BGCs). The resulting interactive network visualizations can immediately identify gene cluster families (GCFs) with known members in MIBiG, which may help identify new homologous BGCs; or identify GCFs without MIBiG reference biosynthetic gene clusters (BGCs), which may represent new or previously unnoticed biosynthetic pathways in the field. Cimermancic et al. previously demonstrated the potential of this principle by identifying a BGC for aryl polyene compounds that is widely present in thousands of bacteria, which had previously been largely overlooked.25 In addition to sequence similarity network analysis, phylogenetic analysis also provides an additional technique for mapping biosynthetic diversity; the CORASON algorithm has been integrated with BiG-SCAPE, enabling the easy construction of multi-locus phylogenetic trees of biosynthetic gene clusters (BGCs) within and across GCFs; this allows us to systematically map evolutionary biosynthetic variation, for example, by identifying unique modifications or core biosynthetic enzymes that are branch-specific variations in BGC content. Navarro-Muñoz et al. demonstrated the potential of the combined application of BiG-SCAPE and CORASON by identifying novel detoxification BGC branches that encode specific modifications of the natural product scaffold.12
It is important to note that sequence similarity network techniques have some limitations. For example, networks can be constructed at different thresholds. Many thresholds can generate “reasonable” networks, but the information presented by each threshold varies. When the goal is to identify a set of biosynthetic gene clusters (BGCs) associated with a specific molecule, the required threshold is stricter than when associating a set of BGCs with a class of molecules, a type of bioactivity, or an associated phenotype of interest. Therefore, in many cases, repeating analyses and using multiple thresholds, carefully comparing the resulting networks and gene cluster family (GCF) groupings, is a good practice. This approach can provide more comprehensive information, as selecting a single threshold always carries a significant degree of arbitrariness.
Another issue to consider is how to define gene cluster families (GCFs) from the graph. Treating fully connected components as GCFs risks merging unrelated biosynthetic gene clusters (BGCs) into the same family: for example, if gene cluster A is related to the first half of gene cluster B, and the second half of gene cluster B is related to gene cluster C, then gene cluster A may have no similarity to gene cluster C. However, clustering the network as done in BiG-SCAPE also risks forcing many closely related gene clusters into multiple independent families. BiG-SCAPE partially addresses this issue by grouping GCFs into higher-level organizations—gene cluster clans—where each family contains multiple related GCFs. When attempting to match gene cluster families with metabolites or phenotypes, using these clan annotations or GCF annotations with different thresholds can help resolve issues caused by excessive “splitting” behavior.
Additionally, it is worth noting that most biosynthetic gene cluster (BGC) identification algorithms are not designed to predict the exact boundaries of biosynthetic gene clusters (BGCs). For example, antiSMASH employs a greedy strategy that extends the regions of biosynthetic gene clusters (BGCs) upstream and downstream of core biosynthetic genes to ensure that no important functional enzyme-coding genes are missed. However, when the extended regions are significantly larger than the actual biosynthetic gene clusters (BGCs), it may lead to biosynthetic gene clusters (BGCs) being assigned to different GCFs (at certain thresholds) when they are in different genomic environments in different organisms.
Fragmented (meta)genomic assemblies containing partial biosynthetic gene clusters (BGCs) can also pose problems. BiG-SCAPE provides a global alignment pattern that can often still match partial gene clusters to corresponding regions in complete biosynthetic gene clusters (BGCs); thus, it can often still connect partial biosynthetic gene clusters (BGCs) in the network to their corresponding complete biosynthetic gene clusters (BGCs). However, for very small contigs, even this pattern may not be able to do so.
Applying gene cluster network methods to large genomic datasets indicates that there are many functionally unknown gene cluster families (GCFs), making it difficult to estimate the structure or function of their products. As mentioned above, while genome mining tools can predict the molecular structures of some biosynthetic gene cluster (BGC) products, these predictions remain prone to errors, especially for uncommon monomers and rare modifications in less-studied organisms. This is because training data for many enzyme families is limited, and enzyme functions can be highly diverse and may evolve rapidly. Integrating with metabolomics data has significant potential to improve current predictive capabilities, as metabolomics data can be used to correct errors in genomic-based chemical (sub)structure predictions, thereby learning from the data. Furthermore, metabolomics data can be used to associate BGCs and GCFs with specific molecules, allowing for deduplication and prioritization of gene clusters for experimental characterization based not only on genomic features but also on chemical novelty predicted from MS/MS data, which also helps clarify issues regarding “silent” or “cryptic” gene clusters: are the products of many biosynthetic gene clusters (BGCs) unknown because they are not expressed under the studied conditions, or simply because they lack bioactivity that is being screened?
5. Metabolomics Mining
Specialized metabolites exhibit high structural diversity, resulting from the evolutionary adaptations of organisms to various abiotic and biotic challenges. Additionally, due to the complex processes influencing the production of specialized metabolites, individual metabolic pathways can also exhibit considerable metabolic variation. These processes may include dynamic transcriptional regulation of biosynthetic enzyme-coding genes, as well as the promiscuity of enzymes in substrate acceptance or regional selectivity, and the availability of substrates in cells and the environment.Genome sequencing has shown that the biosynthetic potential of microbes is often greater than the number of metabolites observed in the laboratory. This indicates a significant potential for discovering novel chemical entities. To identify new metabolites, advancements in metabolomics measurement techniques and data methods (analysis, organization, storage, and standardization) are necessary to effectively investigate and compare more species, samples, and conditions.
Method development and advancements in high-sensitivity analytical instruments (especially mass spectrometry (MS)) have made it possible to study increasingly complex metabolite extracts. Therefore, mass spectrometry-based metabolomics techniques have been widely applied in the field of natural products. The development of novel computational tools for highlighting and identifying target metabolites has further deepened our understanding of these complex systems. The scale of data generated by mass spectrometry-based metabolomics has driven the development of automated analysis methods for comparing and identifying metabolites.However, the chemical complexity and diversity of natural product extracts often make it a highly challenging process to assign structural information to metabolomics signals (metabolite annotation) and to elucidate the structures of metabolites (metabolite identification). In mass spectrometry-based metabolomics studies, there are various data acquisition modes, each with its own advantages and disadvantages. Typically, the goal is to capture the entire metabolome (using full scan or “MS1” mode), which is beneficial for accurately quantifying metabolites.
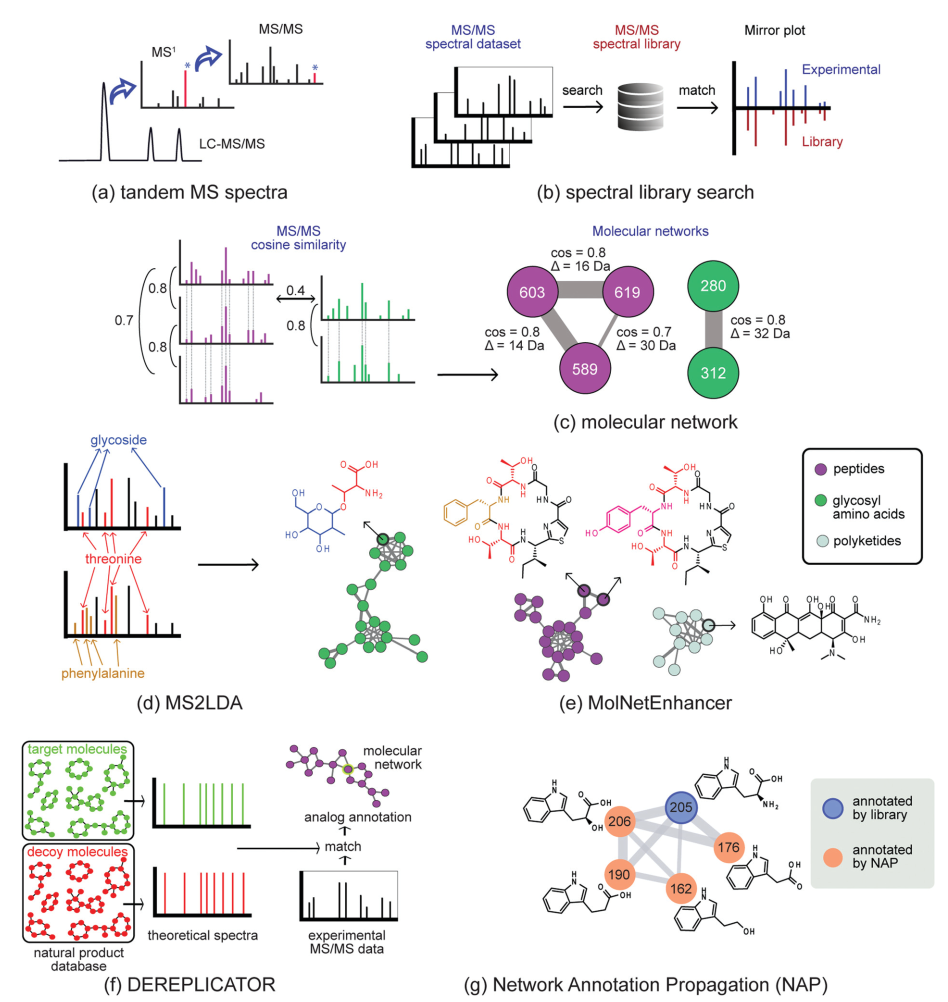
Fig. 2 Molecular networking technologies to chart metabolic diversity.
However, for various reasons, such as multiple different metabolites often having the same molecular formula and mass, it is challenging to reliably annotate metabolites from MS1 data.Obtaining the fragmentation spectra of metabolites (MS/MS or tandem mass spectrometry mode, Figure 2a) has significant advantages in metabolite annotation and identification. These MS/MS spectra can be viewed as barcodes or fingerprints of metabolites, and various software tools have been developed to leverage this structural information. Typically, the first step is to compare experimental MS/MS spectra with library spectra (Figure 2b) to detect known metabolites or their analogs, a process also known as dereplication. The reliability of this matching process depends on various factors, including the quality of experimental data and the content of the spectral library, and there are differences in the content of different spectral libraries. Therefore, it is crucial to validate results across multiple databases. Furthermore, although spectral libraries are continuously expanding, their content is far from fully covering the natural product metabolome. For example, the GNPS library currently contains only about 2.5% of known natural products’ MS/MS reference spectra. Therefore, when performing such annotation work, it is essential to keep in mind that if an unidentified metabolite has spectral features that closely resemble multiple metabolites or stereoisomers present in the database, it is necessary to report a possible candidate structural space rather than a single candidate structure. A single extract may contain thousands of metabolites, and it is not surprising that most metabolites lack available reference data, leading to many metabolomics signals being unmatched. In fact, less than 5% of chemical entities in a sample can be reliably annotated to the structural level.27
To facilitate exploratory data analysis, researchers have developed new tools aimed at grouping metabolites based on the similarity of fragmentation spectra of structurally related metabolites (grouping, Figure 2). Among these, the Global Natural Products Social (GNPS) molecular network significantly enhances the spectral comparison capabilities within and between samples11. Typically, metabolites with similar chemical structures produce similar fragmentation spectra. Molecular networks group parent ions (represented as nodes) based on the similarity of fragmentation patterns (represented as edges), forming molecular families (MFs) of related metabolites (Figure 2c). This aids in analyzing large datasets, including datasets across multiple organisms, as molecular networks can be used to search for metabolites associated with known target molecules or to associate the presence of molecular families with bioactivity, etc. It should be noted that methods relying on network structures (e.g., forming molecular families from fragmentation spectra, similar to grouping biosynthetic gene clusters (BGCs) into gene cluster families (GCFs)) have some limitations—these limitations are similar to those discussed in the genome mining section. In short, selecting the appropriate network threshold is not easy, as the quality of the network reflects the quality of the input data, and the parameters used to define families can also affect the results. To connect two metabolites based on spectral fragmentation, it is necessary to consider which distance metrics are used (e.g., spectral similarity scoring systems), as is the case with any clustering analysis. For example, scoring methods may or may not consider the differences between two parent ions in the spectra.
In the past five years, GNPS11 has developed into a mass spectrometry ecosystem: a free public web platform where users can upload and store raw or processed datasets (e.g., in open data formats such as mzML, mzXML, or MGF) and analyze them using various statistical and annotation tools. GNPS provides an online repository called “Mass Spectrometry Interactive Virtual Environment (MassIVE)” for publicly storing, retrieving, and archiving data. Researchers can search for relevant public datasets here and download or integrate them into their current workspace for re-analysis using different parameters or newly released tools, integrating them into molecular networks containing their own data, or conducting comparative analyses. If the spectral data is public, re-analyzing the data is straightforward, and notifications can be set up: researchers will be notified whenever new data with similar chemical features is submitted, new annotations are submitted, or new spectral matches are found in the crowdsourced GNPS curated spectral library.This interactivity fosters the construction of a global data-sharing community (i.e., the concept of “dynamic data”), significantly enhancing the availability and quantity of annotated features, ultimately aiding in metabolomics identification and continuous learning from public datasets.
Once researchers find a target compound of interest or relevance (MS/MS spectrum), they can query its presence across all GNPS public datasets through MASST, similar to using genomic sequences for NCBI BLAST searches28. In GNPS, researchers can also compare public datasets with their own data using the development of ReDU. ReDU standardizes the metadata of datasets29. ReDU allows the selection of specific subsets of public data based on fixed ontology terms, overcoming the challenges of metadata matching between different datasets. For example, the same bacterial species may be stored in the database under different names, such as Salinispora arenicola, S. arenicola, Salinispora, marine bacteria, etc. ReDU has over 2900 well-documented microbial source datasets, which will undoubtedly contribute to the discovery of natural products by allowing researchers to find the same or related metabolites across all microbial data, thereby understanding the chemical novelty of metabolites and their distribution in known and measured organisms.
In addition to GNPS, there are several other metabolomics tools and platforms available for data processing, analysis, and sharing (see related literature in reference 30 and the references therein). MS-DIAL (including MS-Finder) and MzMine have developed into platforms with active user communities, covering all aspects from initial processing to library matching and unknown signal annotation. Another platform with similar capabilities is XCMS Online, and MetLin is also accessible through this platform: MetLin is currently the largest searchable spectral library. Finally, besides GNPS-MassIVE, MetabolomicsWorkbench and MetaboLights also constitute a continuously evolving metabolomics database aimed at facilitating community sharing of mass spectrometry and NMR-based metabolomics data. MetaboLights has been following ontologies since its launch and now provides an increasingly rich set of analytical tools to fully utilize public metabolomics data.31
Spectral matching and molecular networking have proven helpful for annotating and organizing metabolomics datasets; however, for many mass spectrometry features in molecular network libraries, matching does not provide any structural information. Over the past decade, various computer-assisted annotation methods have been developed to gain insights into the chemical properties of metabolites that cannot be annotated through library matching. These computer-assisted tools typically generate a ranked list of candidate structures based on predicted MS/MS spectra or public compound databases. Additionally, they provide substructure annotations or chemical category annotations. Therefore, they greatly assist in assessing the chemical novelty of natural extracts, as known scaffolds or categories can be assigned to mass spectrometry features, guiding prioritization.
One class of methods leverages the fact that specialized metabolites are often composed of multiple structural units assembled by biosynthetic machinery. Directly identifying these structural units from metabolomics data is an extremely attractive strategy for elucidating natural products. In recent years, various methods have been developed in this field32,33. For example, the MS2LDA tool utilizes algorithms inspired by text mining to identify metabolite parts (substructures) in untargeted datasets through unsupervised detection of co-occurring molecular fragments (Figure 2d)32. The resulting mass spectrometry fragment patterns are referred to as Mass2Motifs, which require annotation by researchers. MS2LDA has been applied to extracts from plants, fungi, and bacteria. In each dataset, dozens of Mass2Motifs have been annotated with substructure information, ultimately yielding hundreds of annotated substructure patterns. Recently, to compile this expert knowledge, a MotifDB (http://ms2lda.org/motifdb/) has been constructed for ease of reuse. Some Mass2Motifs consist of specific mass fragments or neutral losses that uniquely match the MS/MS spectra in experimental data; while others may contain more common mass fragments; in such cases, they should be manually verified for their presence in the experimental data. Additionally, in different sample types, Mass2Motifs may represent different isomeric substructures, so caution should be exercised when transferring Mass2Motif annotations to distinctly different sample types. Different chemical properties can lead to different sets of mass fragments and neutral losses, and users need to provide structural annotations to offer (bio)chemical explanations. To analyze substructures in the context of metabolite diversity, annotations from MS2LDA can be used to annotate molecular networks; the MolNetEnhancer software can simplify this process (Figure 2e)34, thereby streamlining the manual verification of the presence and annotation of Mass2Motifs.
Many other tools, including MetFrag and MAGMa, utilize candidate structures from structural databases and then rank these candidates based on simulated fragmentation results, matching them with experimental mass spectrometry fragments to generate scores for each candidate structure—this is also known as a combinatorial approach35. This approach has some limitations, as fragment ions generated by rearrangement reactions (common in natural product classes, such as McLafferty rearrangement) cannot be associated with structural features. Other methods use machine learning. For example, CSI:FingerID can generate fragmentation trees and use support vector machines to match MS/MS spectra with candidate structures. For spectral prediction methods (e.g., CFM:ID), fragmentation patterns of known metabolites are used to calculate the fragmentation patterns of a large number of structures. Subsequently, these computationally generated spectra are matched with experimental MS/MS data. Although this method has been successfully applied to some small (human) metabolites, obtaining high-quality annotations through spectral matching for larger natural products remains highly challenging. One reason is that the number of natural products with reference MS/MS data is relatively low, making it difficult to train suitable spectral prediction models. Another strategy is to consider metadata, such as molecular positioning, or apply taxonomic information scoring to improve annotations.In summary, computer-assisted annotation tools can often reduce the analysis time required to assign structural information to metabolomics signals while minimizing the number of verification options.
For specific classes of natural products, specialized methods have been developed that utilize innovative strategies to match MS/MS-based fragments with predicted fragmentation patterns from chemical structure databases, thereby dereplicating metabolites. For example, DEREPLICATOR (Figure 2f) systematically associates structures in large peptide natural product databases with mass spectrometry fragment spectra by comparing them with theoretical spectra generated based on specific computer-assisted fragmentation rules.36 Additionally, results are statistically evaluated by matching them with bait databases that contain peptides with similar amino acid compositions that do not exist. Recently, the launch of DEREPLICATOR+ has extended this annotation strategy to polyketides, flavonoids, terpenes, and other classes of natural products.37 Since even large peptide databases are incomplete, the VarQuest tool has been adopted to facilitate searches for peptide structures with modification tolerance and predict the positions of these modifications on the peptide backbone.38 This has enabled the annotation of nearly 20,000 peptide variants in public data.
Combining library matching, dereplication results, and substructure predictions can effectively annotate molecular networks (molecular networks). Recently developed methods include Network Annotation Propagation (NAP)39 (Figure 2g), which utilizes network topology to increase the number of relevant candidate structures for metabolomics signals; and MolNetEnhancer (Figure 2e), which provides finer molecular details by showcasing the presence of substructure patterns (Figure 2d) and offers a higher-level chemical overview by chemically categorizing candidate structures in the context of molecular functions (MF) (Figure 2e).34 These enhanced molecular networks facilitate rapid exploration of metabolite space across large datasets by providing a global overview of chemical diversity.
Many annotation tools rely on the presence of candidate structures in spectral databases. However, for a significant number of mass spectrometry signals, no relevant candidate structures can be found, or even none at all. The aforementioned CFM-ID can extend the search space of candidate structures by predicting spectra based on structural predictions. Recently, MetWork has been developed, which combines the network structure of molecular networks with the spectral predictions of CFM-ID to provide rich structural information. MetWork “imagines” which chemical variants can be represented by nodes based on a certain number of annotated molecules (using a set of appropriate sample-specific reaction rules). It then verifies this imagination by matching these variants with their theoretical spectra.40
All of the above tools rely on measured LC-MS/MS spectral metabolomics data. These data files consist of interleaved full scan LC-MS spectra (capturing the metabolite composition of the sample) and mass spectrometry fragmentation spectra (which typically contain a portion of metabolite fragments). Metabolomics aims to capture all metabolites in an organism, but in reality, this is nearly impossible due to numerous steps in typical (untargeted) metabolomics workflows, particularly extraction and mass spectrometry analysis settings. For example, more polar solvents will extract more polar metabolites from the sample, including sugars and charged molecules, but will exclude most non-polar metabolites, such as lipids (and vice versa). Additionally, mass spectrometers cannot acquire high-quality spectra across the entire m/z range with the same sensitivity, necessitating the setting of mass windows that can only focus on smaller or larger m/z values. Furthermore, the quality of MS/MS spectra (i.e., the visible number of mass fragments and their abundances) depends on the extent of fragmentation of metabolites under experimental conditions. In fact, due to the nature of the bonds connecting monomers, certain classes of compounds (e.g., polyketides) are more difficult to cleave than others (e.g., peptides and carbohydrates). Therefore, different data acquisition settings and varying degrees of background noise (e.g., due to interfering mass features co-eluting in the fragmentation pool) may hinder the correct matching of experimental spectra with library spectra. Moreover, to detect metabolites in a mass spectrometer, metabolites need to be ionized. However, not all metabolites ionize easily, and for certain classes of metabolites, alternative analytical detection techniques are required. Alternative methods to mass spectrometry include UV absorption spectroscopy (for better detection of chromophores in natural products) and nuclear magnetic resonance (NMR) spectroscopy (which can provide more detailed structural information but has lower sensitivity than mass spectrometry).
Data quality also plays a crucial role in the construction of GNPS molecular networks, especially since mass spectrometry fragment data is often generated by selecting a range of masses rather than a single metabolite mass. Therefore, “chimeric” MS/MS spectra containing fragments from two or more metabolites are often obtained. Such chimeric spectra may lead to erroneous connections in molecular networks. Almost all mass spectra contain noise, and when noise is high, it can affect spectral similarity scoring—usually negatively, as noise is random and not shared by the same spectrum pair, leading to lower scores and ultimately failing to establish connections. In recent years, various denoising strategies have been proposed, some of which have been integrated into the GNPS platform.
From a metabolomics perspective, attempting to further integrate genomic (and transcriptomic) data can bring numerous benefits. For example, associating biosynthetic gene clusters (BGCs) with metabolites to understand biosynthetic pathways and integrating chemical category/structural information based on genomic and metabolomic data. Specifically, utilizing genomic-based predictions to guide chemical structure elucidation has tremendous potential to link genes with metabolites. Furthermore, associating biosynthetic gene clusters (BGCs) with transcriptomics data can deepen our understanding of the conditions under which different subsets of chemical entities are produced. Applying these integrated omics datasets to biology-driven questions, such as phylogenetics, ecological functions, and understanding microbial (and host-microbe) interactions, presents an exciting opportunity. In the next section, we will explore how to utilize these methods and others for metabologenomics integration.
6. Integration of Metagenomics
Linking information across datasets is highly useful as it enables structural and functional annotations. The emergence of the term “metabologenomics” is precisely to encompass methods that integrate these complex datasets.41 Although functional annotations in genomics and metabolomics are increasingly appearing in databases that can be matched with new experimental data, it is estimated that only about 50% of proteins have reliable functional annotations, while the total amount of reference metabolomics data is very limited, with only 2-5% of observed molecules being reliably matched with known molecules.27 Additionally, complex samples such as fecal or soil extracts contain multiple microbial species and metabolites, which may also originate from other sources such as food and drugs; thus, identifying the microbes producing metabolites is highly challenging.To find product-producer pairs, especially in the context of metagenomic/metabolomic links, several approaches have been proposed. These approaches can be broadly defined as pattern-based, correlation-based, and feature-based methods.42,43
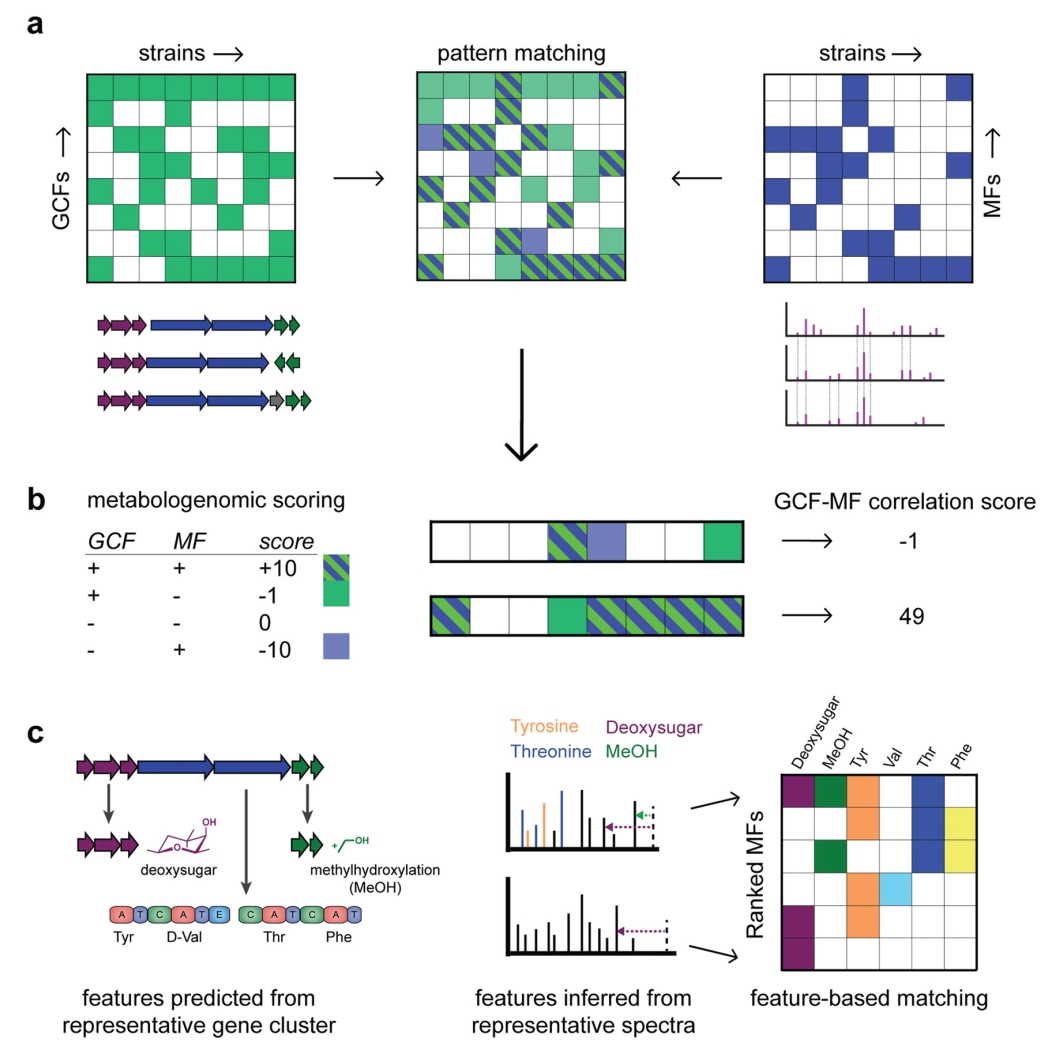
Fig. 3 Various types of matching gene cluster families (GCFs) to molecular families (MFs) have been proposed.
Pattern-based genome mining is one of the earliest integration strategies that combines the analysis of biosynthetic gene clusters (BGCs) across strains with molecular network analysis, which has proven successful in large datasets (Figure 3a).43 In this approach, genome mining information (presence/absence of BGCs) from 35 strains of Salinispora was collected to form a pattern. Since molecular networks have been constructed for these strains, the correlation between BGCs and metabolites can be facilitated by manually exploring the overlap of the two patterns, ultimately accelerating the association of unknown BGCs with known metabolites and prioritizing new biosynthetic and chemical spaces. For example, the discovery of Avermectin A, a quinomycin-type cyclic peptide connected to the biosynthetic gene cluster NRPS40.43 Based on a recent study by Tobias et al.44 that analyzed 22 known biosynthetic gene clusters across 30 strains of Photorhabdus and Xenorabdus (a total of 660 possible combinations), the following statistics were obtained: in 119 cases (18%), both the biosynthetic gene cluster and its product were found; in 479 cases (73%), neither the biosynthetic gene cluster nor its product was found. Additionally, in 61 cases (9%), a biosynthetic gene cluster was found in a strain, but its product was not found; while in 1 case (0.00151%), a product was found in a strain predicted not to have the corresponding biosynthetic gene cluster. Although these numbers may fluctuate43 and are highly dependent on the quality of genomic and metabolomic data, we can infer two important conclusions:(i) If a specific product’s biosynthetic gene cluster (BGC) is not found in the genome, the likelihood of that organism producing that metabolite is very low; (ii) In cases where biosynthetic gene clusters (BGCs) are found in 66% of strains, their specific molecules have also been measured through mass spectrometry. This suggests that we may obtain results from larger datasets.
Historically, these correlation-based methods have mostly been manually operated and often guided by biosynthetic gene cluster (BGC) information to prioritize chemical reactions. However, in recent years, automated methods have emerged that consider correlation metrics and statistical frameworks to rank promising associations between gene clusters and molecular families or between genes and mass spectrometry. Metabologenomics scoring has been introduced to associate gene clusters with molecules based on the presence/absence patterns of gene clusters across different strains45 (Figure 3b). This scoring considers hypotheses similar to those in the aforementioned Photorhabdus and Xenorabdus studies: if a molecule is present but the gene cluster that may produce it is absent, it receives a severe penalty; while hidden BGCs receive a smaller penalty. Thus, this scoring formally measures the quality of matches and can rank matching results to meet current demands. Additionally, correlation scores can also be calculated between gene cluster families and individual mass spectrometry. Future scoring metrics can explore different enhancement and penalty values, considering the sizes of gene cluster features (GCFs) and molecular families (MFs), as well as whether fragmented or incomplete biosynthetic gene clusters (BGCs) are included.
Feature-based integration strategies have also made progress, especially in “modular” natural product classes, as they have relatively clear structural units (Figure 3c). From genomes, monomers such as amino acid portions and glycosyl portions can be predicted from gene cluster sequences, as well as enzymatic modifications such as methylation and hydroxylation. Similarly, substructures can be predicted from mass spectrometry. Therefore, GCFs and MFs can be ranked based on the number of corresponding structural features (Figure 3c). For example, subclusters (representing gene sets that co-evolve and cooperate to synthesize specific chemical parts)24 may be automatically matched to chemical substructures (represented by co-occurring mass fragments and neutral losses) and/or mass differences discovered through metabolomics mining (e.g., Mass2Motifs in MS2LDA)24,32. Feature-based matching methods have been successfully applied to glycosylated and peptide metabolites, targeting sugars and amino acids, respectively, known as glycomics and peptidomics46,47. We anticipate that correlation matching and feature-based matching methods can be used in conjunction to optimize the links between genomics and metabolomics; for example, first using correlation methods and then re-ranking based on the presence/absence of structural features. Once reliable links are established, metabolites can be associated with their producers. Additionally, some complementary structural information (e.g., stereochemistry of amino acids in non-ribosomal peptides) that is difficult to observe or infer through metabolomics can be used to elucidate the structures of specific metabolites.
Currently, there are some fully automated methods that associate mass spectrometry data with molecular structures by matching predicted structural features from genomics with inferred structural features from metabolomics. Specifically, for non-ribosomal peptides (NRPs), there is NRPquest26; for ribosomally synthesized and post-translationally modified peptides (RiPPs), there are MetaMiner48 and DeepRiPP50. Although these pattern feature-based methods differ in details and target natural product types, they follow similar principles (Figure 4). These methods start from metabolomics data and biosynthetic gene clusters (BGCs) and include the following (partial) steps: (a) predicting hypothetical small molecule products from biosynthetic gene clusters (BGCs); (b) predicting the fragmentation patterns and theoretical spectra of these hypothetical molecules; (c) matching mass spectrometry with theoretical spectra, allowing for a specific number of modifications; (d) calculating the statistical significance of matches; (e) calculating the false discovery rate of matches; and (f) constructing significant identified molecular networks.
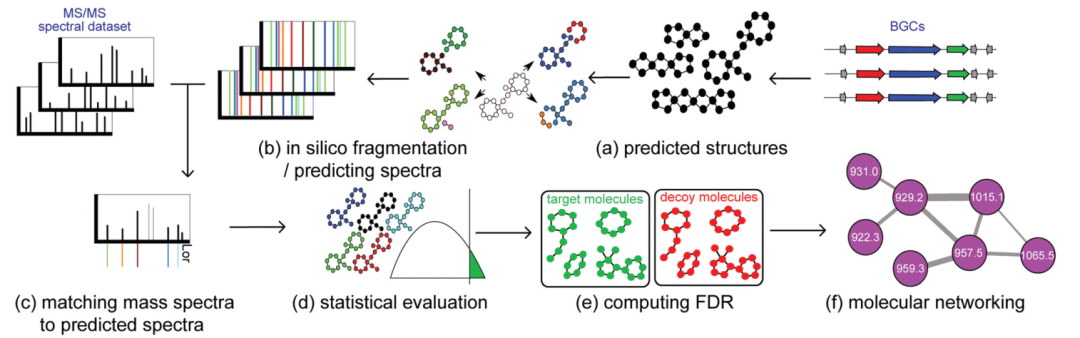
(a) Predicting hypothetical small molecule products from biosynthetic gene clusters (BGCs). For non-ribosomal peptides (NRPs), various algorithms predict the amino acid specificity of A domains22. For ribosomal peptides (RiPPs), predictions of BGCs are based on modifying enzymes found in different RiPP classes: extracting open reading frames (ORFs) from biosynthetic gene clusters (BGCs) as precursor RiPPs and introducing modifications into precursor RiPPs based on the enzymes present in the biosynthetic gene clusters (BGCs) to form mature RiPP structures.
(b) Predicting the fragmentation patterns and theoretical spectra of these hypothetical molecules during mass spectrometry analysis. For peptides, fragmentation patterns are formed by breaking amide bonds between nitrogen and carbon. For more general small molecules, fragmentation patterns are formed by breaking nitrogen-carbon, oxygen-carbon, and carbon-carbon bonds.
(c) Matching mass spectrometry with theoretical spectra, allowing for a specific number of modifications. Typically, hypothetical small molecules predicted based on genome mining will have errors due to the many difficulties in predicting post-translational and assembly modifications. These modifications can be discovered through mass spectrometry-based searches for modified hypothetical small molecules38.
(d) Calculating the statistical significance of matches. The raw score of the hypothetical small molecule against the mass spectrometry spectrum is defined as the number of peaks shared by both. These scores typically favor larger molecules. Therefore, the raw score needs to be converted into a p-value, which is defined as the ratio of molecules with scores higher than the target small molecule generated randomly to the mass spectrometry spectrum.
(e) Calculating the false discovery rate of matches. To calculate the false discovery rate, the hypothetical small molecules are randomly shuffled to form a bait database. The false discovery rate is then calculated as the ratio of the number of molecules identified in the bait database to the number of molecules identified in the target database.36,49
(f) Constructing significant identified molecular networks. Utilizing molecular networks to further expand and associate the chemical identities of metabolites.
Despite these common integrative data analysis methods, challenges remain that prompt the development of solutions to improve integration within and between datasets.The main challenges include issues of data comparability, such as those caused by different experimental protocols, data processing schemes, data formats, and the lack of structured references or knowledge bases. Additionally, there is a lack of tools for checking and managing the quality of data and metadata, as well as tools that can use or reuse these paired data and their metadata.
The first challenge discussed in this paper is the lack of consistent, well-managed, and standardized data. In recent years, the availability of whole-genome sequencing and metabolomics data from the same strain has increased, allowing us to obtain or infer complementary structural information from genomic and metabolomic predictions. Different complementary omics datasets from the same source are referred to as “paired datasets”. In recent years, several papers have been published on paired datasets, demonstrating how pattern-based mining can help link genomic information with molecular spectra. As the number of paired datasets increases, we can increasingly leverage complementary structural information from genomics and metabolomics to link gene clusters with their products, thereby linking molecules with their producers. This is particularly useful in metagenomic and metaproteomic experiments, as a single molecule may be produced by many different bacterial strains. Efforts are underway to create a platform called the “Paired Omics Data Platform” (https://pairedomicsdata.bioinformatics.nl) that will document existing and new paired datasets, providing an overview of existing paired datasets and facilitating the reuse of data in the natural product discovery process. Additionally, other omics data such as transcriptomics and peptidogenomics can be added to genomic and metabolomic data along with metadata. For example, transcriptomic data can guide researchers to find biosynthetic gene clusters (BGCs) that are actively expressed under the same conditions as the target metabolites.50 Comprehensive associations of chemical and genomic features in paired datasets will benefit the entire field of natural product research and beyond. Experimentalists can quickly assess whether predicted BGCs have known specific metabolites using validated associations. Additionally, computational biologists can use validated associations as anchors to train machine learning models to computationally link genomic and metabolomic data.
The second challenge lies in the importance of data and metadata quality, including quality filters and the quality and quantity of paired data. Poor quality data is likely to produce inaccurate annotations, leading to erroneous assumptions about the biological systems under study. The quality of public data is often questioned, making it crucial to develop standardized workflows for generating quality control reports. As mentioned earlier, there are many factors that can affect data quality, including sample handling and preprocessing methods, extraction procedures, analytical methods employed, data processing, and so on. Some authors argue that standardizing protocols helps better integrate omics data; however, such standard operating procedures do not always provide the best quality data for specific use cases. Additionally, there may be non-informative features in metabolomics and genomics data, which may arise from baseline or low-quality spectra or gene reads, complicating integration analysis workflows. Therefore, filtering steps are crucial for statistical analysis; however, the same filters may also remove relevant features from the dataset. Employing some quality control measures can help overcome this issue and significantly improve the quality of the final data. In summary, when selecting which datasets to include in paired data analysis, there is a trade-off between choosing higher quality sample data and datasets versus the total number of samples. Since more paired datasets typically increase the probability of discovering relevant patterns, data quality must be weighed against the number of datasets.
Comprehensive, well-organized, and standardized sample information is crucial, including the effectiveness of linking metadata across omics datasets. To achieve this, using domain-specific ontologies and linking these ontologies across domains not only helps standardize sample information but also aids in linking information: for example, cleverly using ontologies can ensure that not only direct (exact) term matches occur but also indirect (related) term matches. In the fields of genomics and metabolomics, several projects have led the way in creating unified metadata that contains rich sample information.
Recently published literature showcases exciting new opportunities to reveal novel microbe-metabolite relationships using paired genomic and metabolomic datasets. Morton and colleagues proposed the mmvec method, which takes metabolomic data and taxonomic spectra as input and applies a single-layer neural network to learn the co-occurrence probabilities between measured metabolites and microbes.51 mmvec does not use correlation analysis to associate microbes and metabolites but instead uses probabilistic metrics to identify the most likely microbe-metabolite co-occurrence relationships. This method holds great promise as it overcomes some limitations of correlation-based methods when applied to non-absolutely quantitative data (e.g., microbial taxonomy and metabolite information) while also providing a ranked list of interactions.Another recent tool that links taxonomic information with metabolite abundance is MelonnPan, which can predict community metabolomes based on microbial community characteristics.52 Mallick and colleagues demonstrated how their computational framework successfully recovers over 50% of the metabolic trends of microbially associated molecules—thus providing insights into metabolic capabilities for communities with only metagenomic data. Similarly, Cao et al. developed a method to detect microbially associated small molecules based on co-occurrence patterns in multiple microbiomes, further mapping each molecule to the phylogenetic branches responsible for its production/transformation.53 These methods help link bacterial taxa or gene clusters with metabolites using correlation-based or neural network (machine learning) approaches. Ultimately, the success of integrating genomic and metabolomic mining workflows for natural product discovery will depend on the development of platforms and infrastructure. This is always a chicken-and-egg problem. We need to develop tools for analyzing data, but developing these tools also requires corresponding data. Successful architectures require the acquisition of relevant training data. This data is well-organized and often compiled through community knowledge, similar to how MIBiG and GNPS capture community knowledge in a computer-readable format to enable integrated analyses across data types.
7. Opportunities
In the past fifteen years, the cost of sequencing has decreased by nine orders of magnitude, while the cost of generating mass spectrometry data has decreased by two orders of magnitude. This has led to an increasing number of laboratories capable of simultaneously collecting both types of data. For example, the Qiita platform54 has publicly available genomic data from hundreds of thousands of microbiome samples, while GNPS has publicly available mass spectrometry data from thousands of microbial samples, including cultures and microbiome samples (tens of thousands), as well as metabolomics data from the American Gut Project (http://humanfoodproject.com/americangut/), the Global Foodomics Project (https://globalfoodomics.org), the Tiny Earth Project (https://tinyearth.wisc.edu/), and the (integrated) Human Microbiome Project (https://hmpdacc.org/ihmp/). Therefore, Qiita and GNPS currently contain thousands of samples that have both metabolomics and sequencing data (primarily 16S rRNA sequences, but whole-genome sequences are also increasingly available). These datasets include isolated strains (approximately 1700, primarily from Streptomyces, Salinispora, cyanobacteria, and bacteria associated with the human microbiome) as well as human gut metagenomes (over 500) and 16S rRNA amplicon sequences (over 2000).However, the utility of these data has not been fully realized due to the complexities of linking data in practice.
We are starting with the paired datasets from these datasets to learn how to seize this opportunity. To facilitate the integration of multiple omics approaches, standardization is crucial. While this undoubtedly helps pose broader research questions, there will never be a one-size-fits-all approach for all data types and questions. However, we see opportunities to use more standardized data formats, including metadata, controlled vocabularies wherever possible, and reporting data in reusable formats. In this regard, journals can play a role by clearly stating what data need to be made public and how to link data in an accessible format. For example, due to journal requirements, most sequence data is stored in public files. However, there are currently dozens of different formats for mass spectrometry data, and the scientific community has not mandated the use of accession numbers to store data. We believe that data should be made publicly available as soon as possible, preferably before publication. In addition to community mandates for sharing, incentives can also be implemented to encourage sharing, such as providing incentives for users who gain more knowledge or data after publicly sharing their data. In this regard, the work of GNPS, MetaboLights, and Metabolomics Workbench are all important initiatives.29,31 In summary, we anticipate that the number of public data will increase, driven by numerous publicly funded open data initiatives.
The connectivity between genomic and metabolomic datasets is increasingly enhanced, especially in the modular biosynthetic pathways of polyketides and non-ribosomal peptides, and this connectivity is often achieved through manual methods. However, there is an urgent need to use more complex statistical methods to integrate these data. For example, metabolomics scoring can be improved by considering the prior probabilities of observing certain associations or correcting for structure in the data (e.g., phylogenetic relationships between species). Future improvements will also expand the range of associations between gene clusters and molecules, making them applicable to any compound class beyond modular metabolites. Additionally, more complex tools need to be developed to establish connections between these two specialized fields. This is no easy task, as it requires interdisciplinary knowledge across chemistry, biology, and informatics. Making these combined omics tools publicly available is crucial for our understanding of chemical biology. In this regard, the recent efforts of Qiime2, initially designed and focused on genomic data, in metabolomics analysis are noteworthy.55
Computationally driven correlation and feature matching (Figures 3b and 3c) rely on cross-dataset gene cluster and spectral similarity scoring, as well as precise presence/absence patterns across strains. We foresee that with the development of machine learning and the increasing availability of reference library MS/MS spectral data, similarity scoring is expected to improve, enhancing the accuracy of genomic-metabolomic matching. The emergence of several exciting new tools has made the annotation of compound classes and substructures more reliable. We believe that additional structural features, such as compound class predictions (e.g., from antiSmash, MolNetEnhancer, or CSI:FingerID), will help re-rank and optimize linking results when matched with compound class predictions inferred from genomics. For example, terpenoid biosynthetic clusters are more likely to match predicted terpenoid molecular families than NRPS families. Furthermore, in genomics, projects like MiBIG are driving the continuous increase in the number of verified biosynthetic gene clusters (BGCs) linked to molecular structures;21 these datasets help develop algorithms to predict structural features from genomic sequences. Additionally, new strategies for improving structural predictions, such as computational predictions of core substrate specificity and regional selectivity, as well as modifications of biosynthetic enzymes, will also aid in improving links through feature-based matching. Synthetic biology can also contribute in this regard by synthesizing and analyzing specific enzymes or enzyme domains to fill critical gaps in current training sets.
In summary, we foresee that significant computational advancements will be necessary to fully realize the potential of existing paired omics datasets. As high-throughput genomics and metabolomics workflows continue to emerge, we expect more paired datasets to become available. Ultimately, these two developments will mutually reinforce each other, as advancements in computational techniques for linking data will stimulate the generation of paired datasets. As demonstrated by the numerous community projects and tools that have emerged over the past five years, the era of integrative omics analysis has truly begun. The question is how these integrative capabilities will manifest—perhaps forming a network infrastructure similar to Facebook, which connects not data and people, but different types of molecular information. We look forward to all the exciting new developments in the coming years.