Click the blue text to follow us
In September 2025, scholars Shen Zhengxin, Liao Chunzai, and others from Fujian University of Technology, Donghua University of Science and Technology, and other institutions jointly published an academic article in Sustainable Cities and Society. This research takes Fuzhou, China as an example, addressing the limitations of traditional analyses that isolate urban heat islands from cool islands by innovatively introducing complex network theory to construct a systematic analytical framework that integrates heat sources and cool sources. By comprehensively applying morphological spatial pattern analysis, machine learning, and circuit theory, the study reveals the differentiated roles of heat source nodes dominating network connections, while cool source nodes contribute core cooling capabilities, confirming that topography and vegetation are key factors affecting the thermal environment. Importantly, the research identifies four functional clusters through community detection, providing a scientific basis for achieving differentiated precision governance and ecological planning. This work successfully unifies the dispersed heat-cool elements into a “heat-cool interaction network”, providing an important theoretical foundation and practical path for systematically mitigating urban heat island effects and promoting climate-adaptive urban planning.
Part 01AbstractThe urban heat island effect poses significant environmental challenges in the context of climate change and rapid urbanization. Traditional research often isolates the analysis of heat islands or cool islands, lacking a holistic perspective.This study constructs an innovative analytical framework based on complex network theory, using Fuzhou, China as a case study to systematically analyze the spatial connectivity patterns of urban heat sources and cool sources. By identifying heat and cool sources through morphological spatial pattern analysis and landscape connectivity metrics, and employing the XGBoost/SHAP model framework to construct a comprehensive cooling network resistance surface, combined with circuit theory to identify spatial connection paths and cooling corridors, the complex network analysis indicates that: heat source nodes dominate network connectivity, while cool source nodes exhibit superior cooling capabilities; topography and vegetation cover are confirmed as key factors influencing the urban thermal environment. Through community detection, four types of functional clusters are identified: a complex networked cool source system, tightly connected medium cool source groups, small isolated cooling units, and complexly shaped heat source-dominated areas. This study advances urban thermal environment research by integrating heterogeneous thermal elements into a unified connectivity analysis framework, providing theoretical basis and practical strategies for systematically mitigating heat island effects and formulating climate-adaptive urban planning.Part 02Research Methods
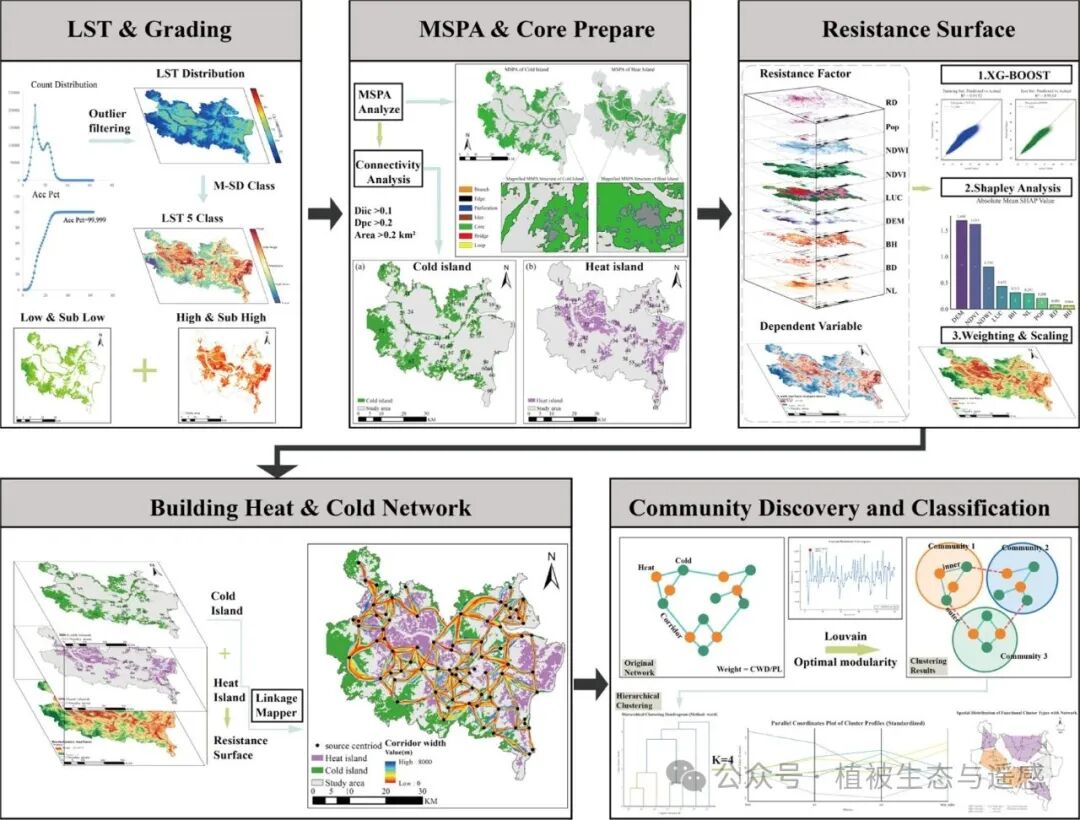
We constructed a connectivity analysis framework for urban thermal environment systems, which includes three core modules: heat-cool source identification, corridor construction, and network analysis. First, based on Landsat 8 surface temperature inversion data and morphological spatial pattern analysis, key heat and cool sources are accurately identified. Subsequently, a multi-dimensional resistance surface is constructed, and circuit theory is applied to systematically analyze the spatial connectivity patterns of heat and cool sources in urban and rural landscapes, extracting thermal environment connectivity corridors. Finally, a bipartite network model is established to deeply analyze the network topology structure and functional cluster characteristics, providing empirical evidence for systematically mitigating urban heat island effects. The overall process of this methodological framework is shown in Figure 2. (For detailed content, please read the original text)
Part 03Research Results
3. Research Results3.1. Surface Temperature Inversion and Heat Island/Cool Island Classification Results
Based on the surface temperature inversion results from Landsat 8 imagery (Figure 3a), the surface temperature range in Fuzhou on September 22, 2019, was 20.12°C–53.39°C, with a mean of 29.74°C and a standard deviation of 3.86°C, showing a significant temperature gradient distribution. The thermal environment zoning identified five levels, with significant spatial heterogeneity (Figure 3b).
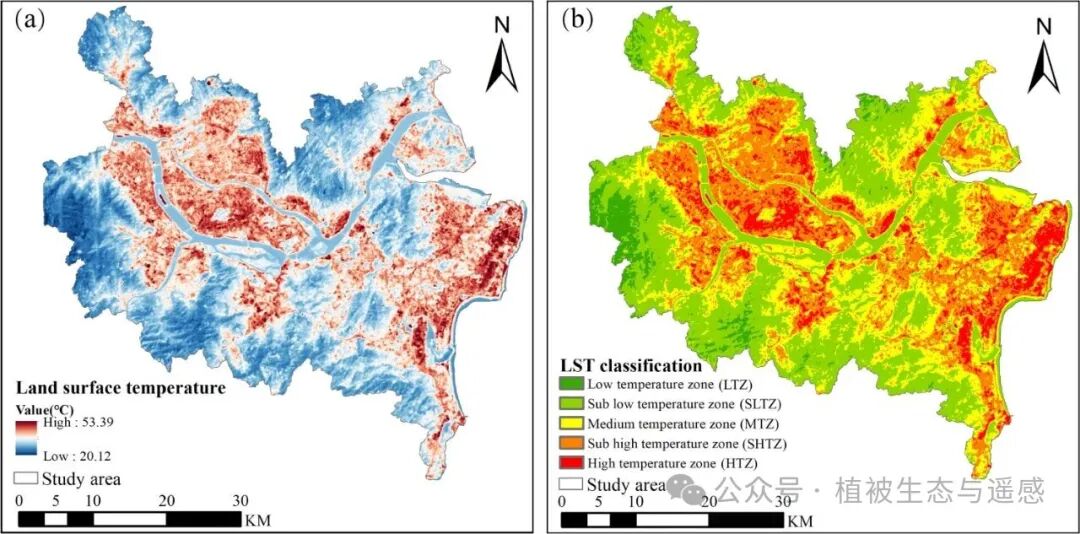
Figure 3: Surface temperature characteristics of the study area (a) LST distribution map (b) LST classification.
The heat island system mainly includes high-temperature areas (>35.53°C) and sub-high-temperature areas (31.67°C–35.53°C), concentrated in the central and eastern parts of the city, covering a total area of 743.98 km², accounting for 33.71%. These areas have high levels of urbanization, dense buildings, and concentrated populations, resulting in significant heat island effects.
The cool island system consists of low-temperature areas (<23.95°C) and sub-low-temperature areas (23.95°C–27.81°C), distributed in peripheral and scattered areas in the southwest, primarily consisting of forests and water bodies, covering a total area of 868.45 km², accounting for 39.35%. The medium-temperature area (27.81°C–31.67°C) serves as a transitional zone between heat islands and cool islands, maintaining the overall gradient connection of the urban thermal pattern.
3.2 Surface Temperature Inversion and Heat Island/Cool Island Classification Results
3.2.1 Spatial Distribution Characteristics of Heat and Cool SourcesBased on morphological spatial pattern analysis, the core pixels of the cool island area number 883,812, accounting for 88.22% of the foreground pixels; the core pixels of the heat island number 724,455, accounting for 84.41% (Table 4), indicating that the core areas are the main body of the two types of thermal environments, bearing stable cool/heat source functions.
Table 4: Composition of landscape elements in heat and cool islands and their thermal significance
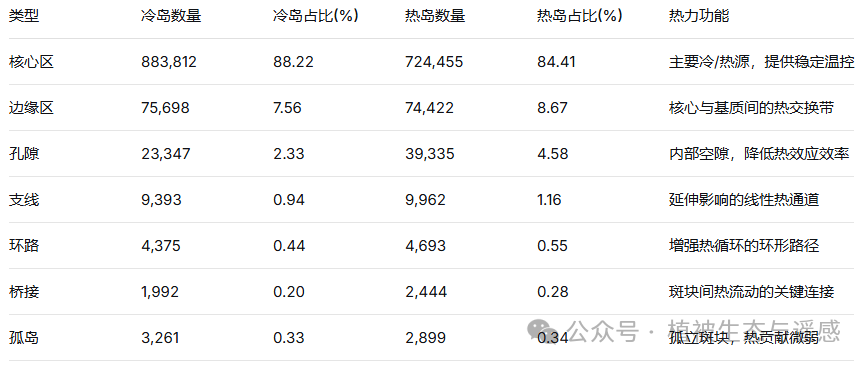
The edge area (8.67%) and pores (4.58%) of the heat island region account for a higher proportion than the cool island (7.56%, 2.33%), reflecting a more complex boundary structure and more internal perforations. The connectivity elements of the heat island (bridges, loops, and branches) account for a total of 1.99%, higher than the 1.58% of the cool island, indicating that the connectivity paths between heat island patches are richer. The proportion of isolated islands is low in both types of areas (about 0.33%–0.34%), indicating that the thermal impact of isolated small patches is weak (Figures 4, 5).
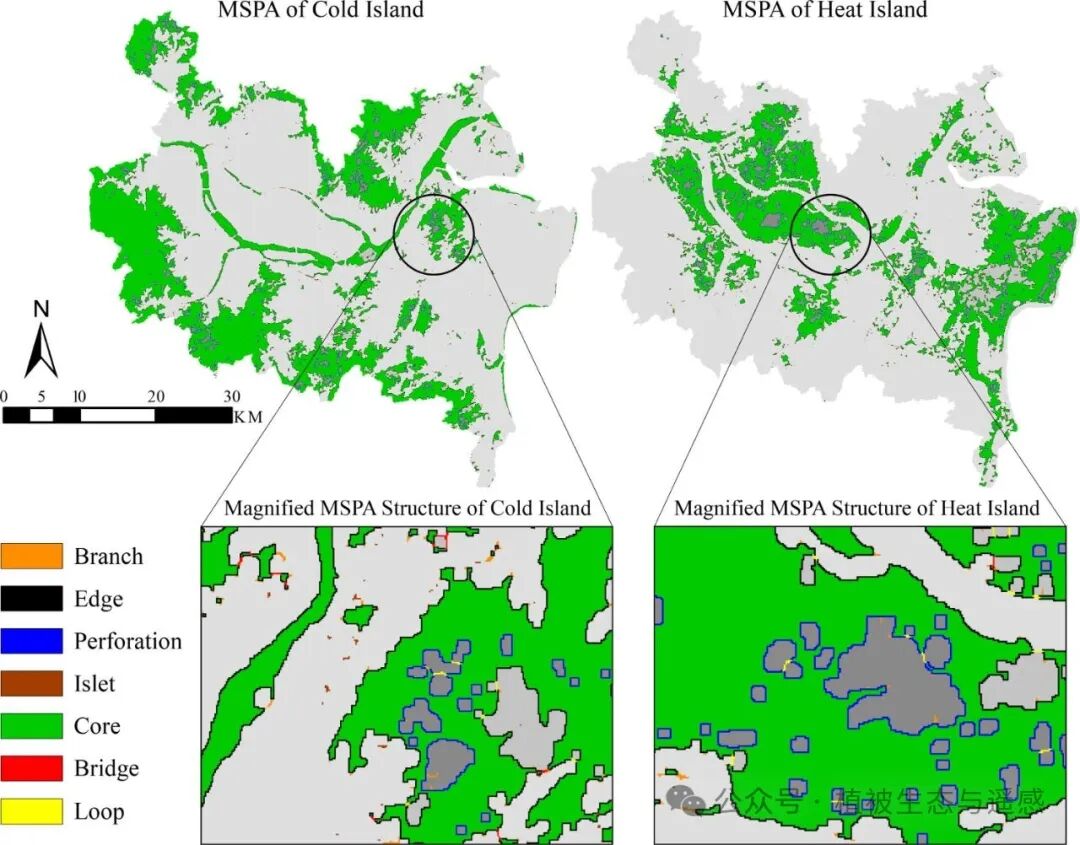
Figure 4: MSPA of UCI and UHI.
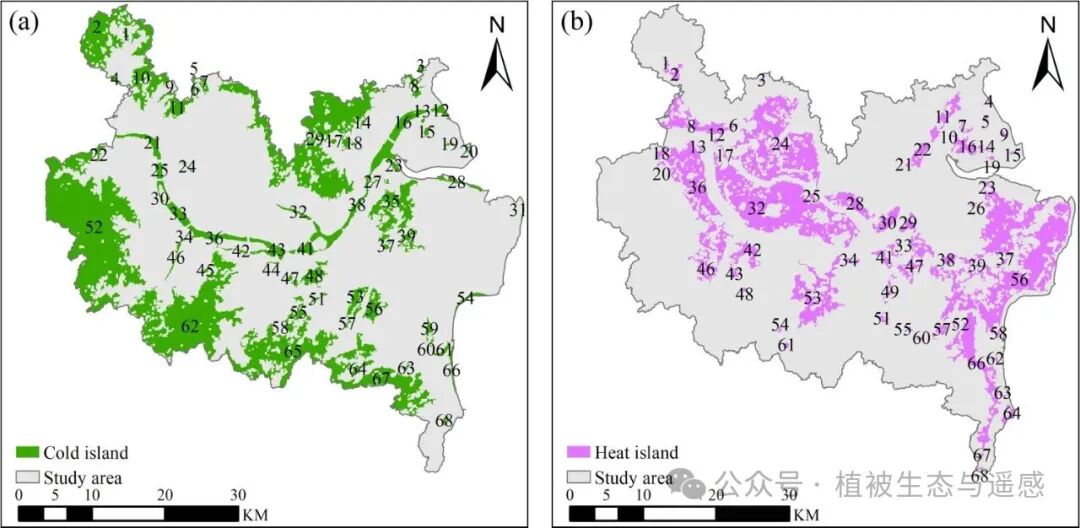
Figure 5: Distribution maps of UCI and UI. (a) UCI distribution map; (b) Geodetic index distribution map.
Through MSPA, 42 cool source points (Figure 5a) and 38 heat source points (Figure 5b) were identified. Cool sources are mainly distributed in the periphery, primarily consisting of large forests, grasslands, and water bodies, presenting a surrounding pattern except for the water bodies in the central area; heat sources are concentrated in the central and eastern built-up areas, with relatively continuous distribution. The connectivity of cool source patches in the eastern part of the study area is poor, mainly affected by the fragmentation of urban green spaces.
3.2.2 Comprehensive Resistance Surface ConstructionThe R² of the XGBoost model reached 0.9152 and 0.9134 for the training and testing sets, respectively, significantly outperforming multiple linear regression (R²=0.8173), capturing the complex nonlinear relationships of the urban thermal environment more effectively. SHAP feature importance indicates that natural factors have the most significant impact: DEM (1.690) and NDVI (1.615) are dominant, followed by NDWI (0.799); built environment factors have a weaker influence, with SHAP values for building height and land use type being 0.313 and 0.432, respectively, while other factors are below 0.30. Overall, DEM, NDVI, and NDWI exhibit negative impacts (reducing thermal resistance), while built environment factors tend to have positive impacts (Figure 6).
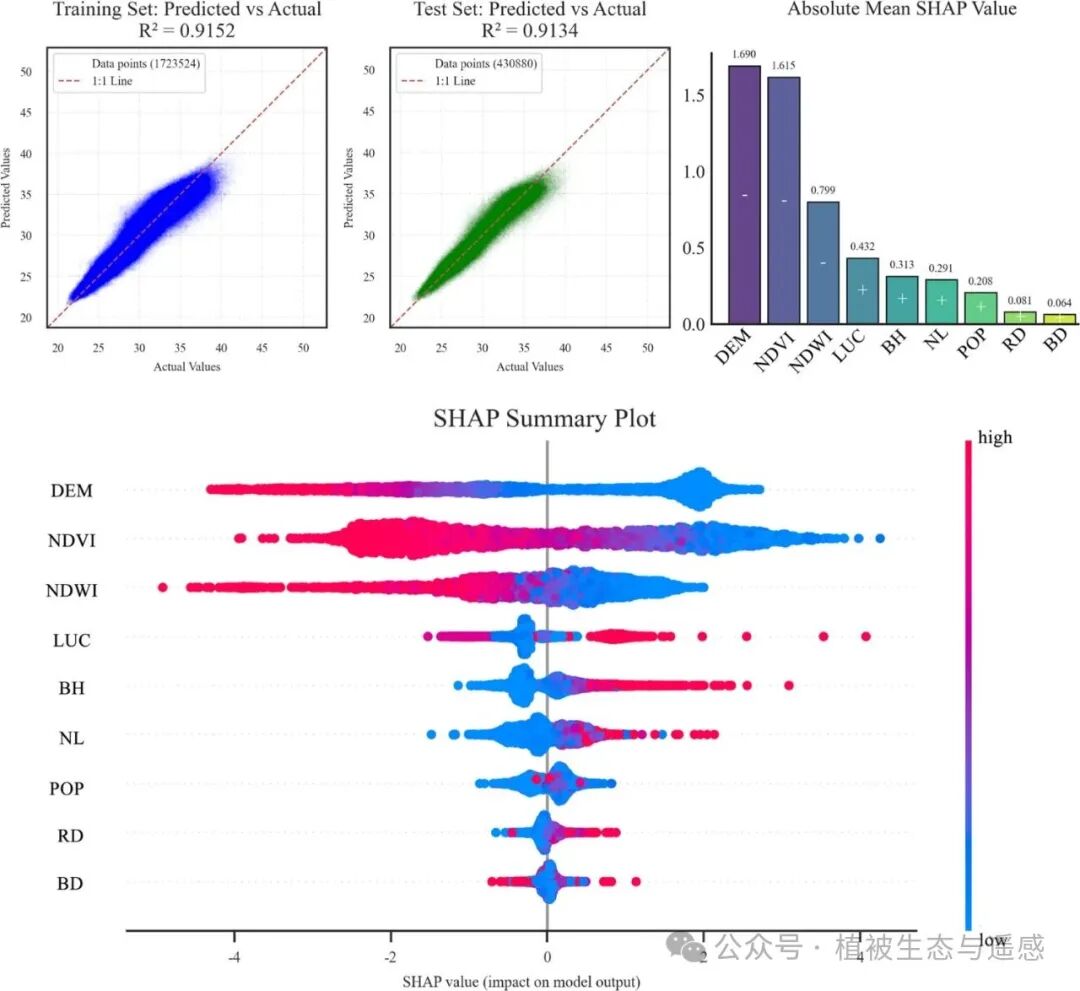
Figure 6:Performance of the XGBoost model and SHAP analysis.
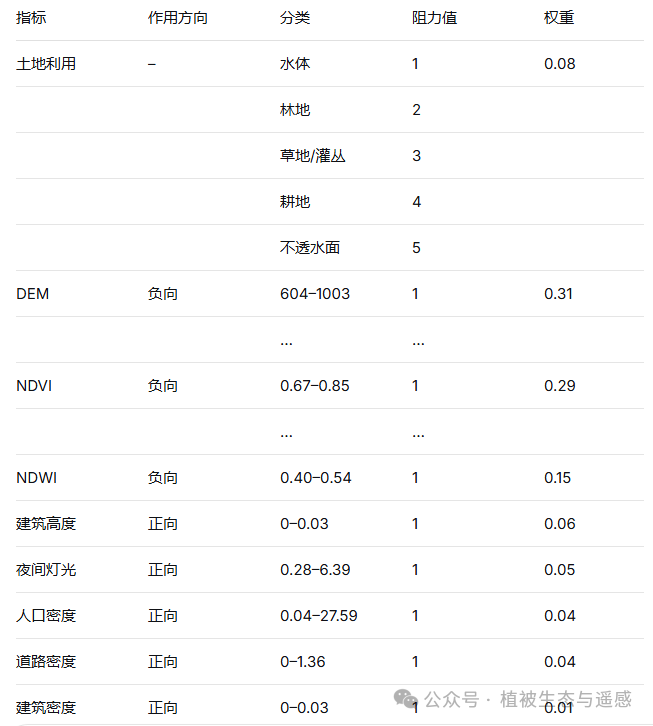
Based on SHAP analysis, a comprehensive resistance surface evaluation system containing nine factors was constructed, with weights assigned according to SHAP values: DEM (0.31) and NDVI (0.29) are the highest, followed by NDWI (0.15), while building density has the lowest weight (0.01). Each factor is categorized into “negative” (reducing resistance) and “positive” (increasing resistance) based on ecological significance, and five levels of resistance values are set according to different principles (Table 5).
Table 5: Resistance factor grading and weights
The spatial heterogeneity of the comprehensive resistance surface is significant: high-resistance areas are concentrated in regions with dense buildings, high population, and road density, hindering spatial connectivity and cooling functions; low-resistance areas correspond to green infrastructure and water systems with high NDVI/NDWI, facilitating cool source connectivity (Figure 7).
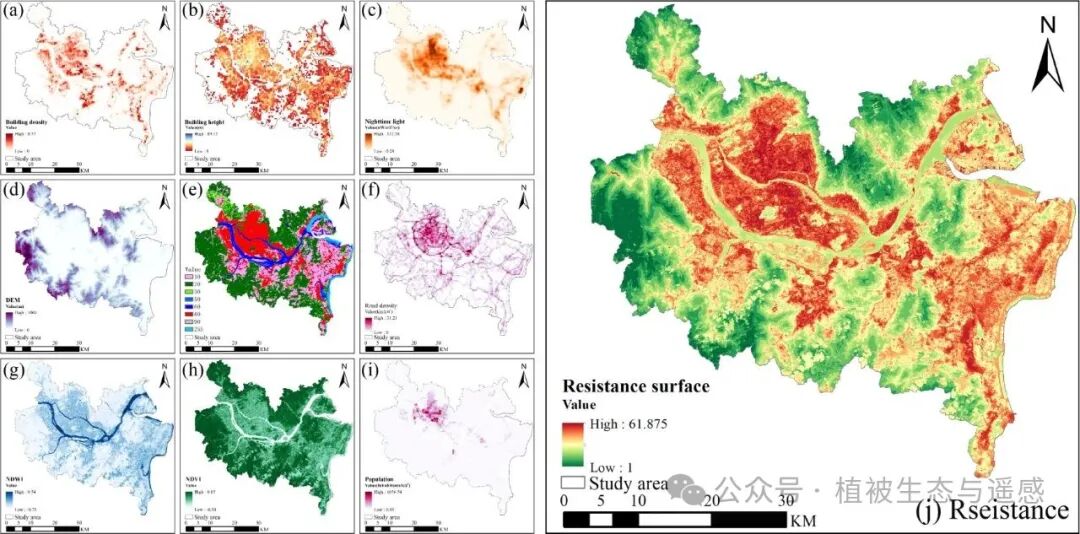
Figure 7: Construction of the resistance surface. (a-i) Factor resistance surface distribution maps. (j) Composite resistance surface.
3.2.3 Thermal Connectivity Corridors and Thermal Network DistributionBased on the resistance surface, a total of 129 heat-cool corridors were identified, with a total length of 851.64 km and an average length of 6.60 km, forming a complete network connecting dispersed heat and cool sources (Figure 8). The corridors in the western part of the study area are sparse and have long connection distances, mainly linking large cool sources; the corridors in the central and eastern parts are dense and highly interconnected, playing a key cooling connectivity role in the overlapping areas of heat and cool sources. The width of the corridors shows significant spatial variation: the northern and central-western corridors are wider, connecting large cool sources with high thermal regulation efficiency; the southeastern corridors are narrow, limiting heat-cool exchange, with lower potential for local thermal environment improvement.
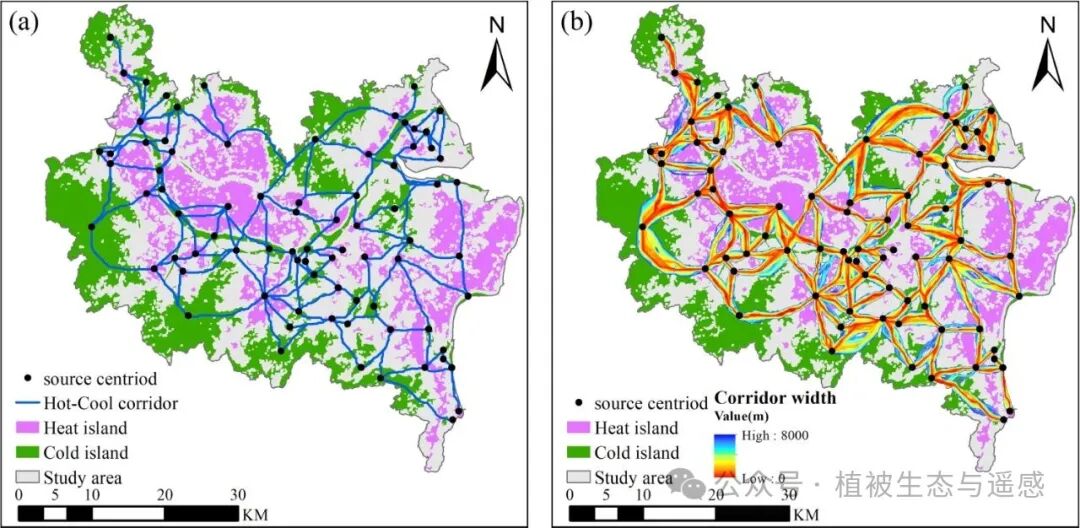
Figure 8: Thermal connection corridors. (a) Location of the corridors; (b) Variation in corridor width.
The heat-cool corridors form a networked structure, connecting heat source and cool source centers through corridors. The concentration of heat sources in the central and eastern parts is particularly important for improving the urban thermal environment through the corridors constructed with surrounding cool sources; although there are large cool sources in the western part, the distance from heat sources makes it difficult to form efficient connectivity paths.
3.3 Results of Heat-Cool Interaction Network Based on Complex Network Analysis
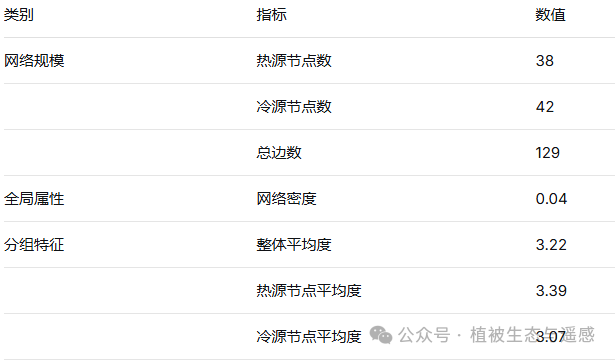
3.3.1 Overall Topological Characteristics of the Heat-Cool NetworkThe Fuzhou heat-cool interaction bipartite network contains 80 nodes (38 heat sources, 42 cool sources) and 129 edges. The network density is 0.04, exhibiting a moderately sparse connection pattern. The overall average degree is 3.22, with the average degree of heat source nodes (3.39) slightly higher than that of cool source nodes (3.07), indicating that heat sources have stronger network connectivity within the study area (Table 6).
Table 6: Structural characteristics of the heat-cool network
Centrality analysis shows that there are differences between the two types of nodes across four indicators: heat source nodes have a higher median degree centrality and a wider distribution range, indicating that some heat source nodes play a key role in network connectivity; in terms of betweenness centrality, although the maximum values of both types of nodes are similar, heat source nodes exhibit greater heterogeneity in distribution, with a few heat sources occupying key bridge positions; closeness centrality indicates that cool source nodes overall outperform heat source nodes, reflecting their superior overall thermal regulation capabilities; eigenvector centrality further confirms the presence of important heat-cool interaction cores within the network. High centrality nodes are mainly concentrated in the central part of the study area, significantly overlapping with areas of high heat island/cool island density (Figure 9).
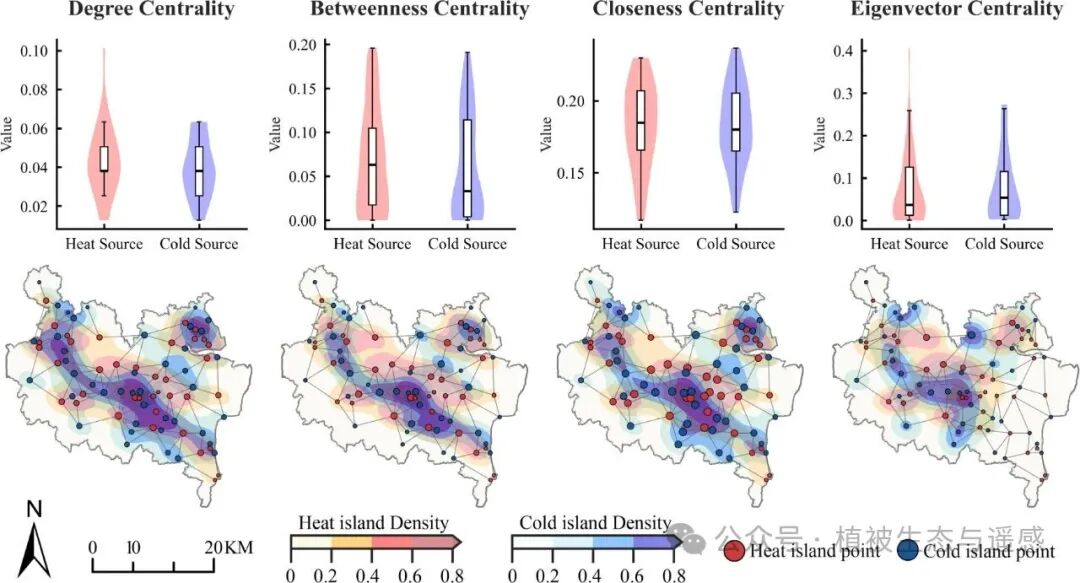
Figure 9: Centrality analysis of the heat-cool network.
3.3.2 Heat-Cool Community Identification ResultsUsing the Louvain algorithm, seven communities were identified, with a modularity of 0.68, indicating a high quality of division. There are significant differences in community size and structure: community 7 has the most nodes and edges, with the most complex structure; community 6 is the smallest. Most communities maintain a relatively balanced distribution of heat and cool nodes (Table 7).
Table 7: Characteristics of heat-cool communities
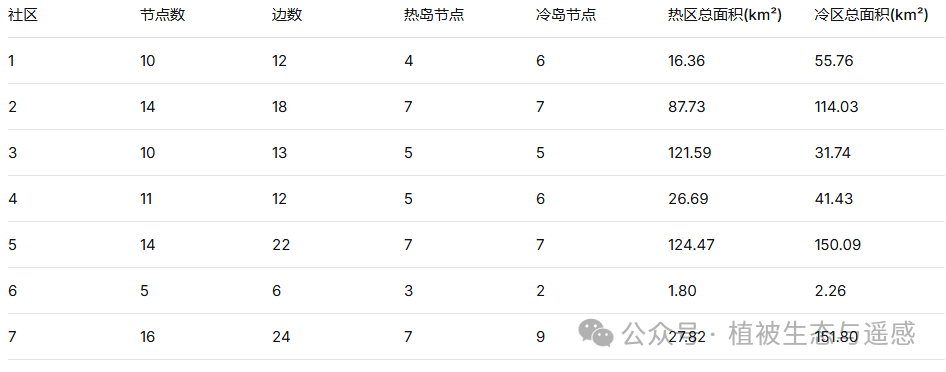
The area distribution differences are even more pronounced: communities 5 and 3 have the largest heat area, while communities 7 and 5 lead in cool area size, and community 6 is the smallest in both aspects. Communities 3, 1, and 7 exhibit significant heat imbalance characteristics: community 3 has a heat area far exceeding the cool area, highlighting its heat characteristics; communities 1 and 7, on the other hand, have significantly larger cool areas, indicating a dominance of cool environments.
3.3.3 Characteristics of Heat-Cool Functional ClustersBased on functional, morphological, and topological three-dimensional indicators, the seven communities were classified into four typical clusters through hierarchical clustering. After Z-score normalization and Ward’s method clustering, each cluster shows significant differences in heat-cool scale ratio, shape complexity, connection strength, and β index, revealing the complex spatial organizational characteristics of heat-cool interaction units in the urban thermal environment (Figure 10).
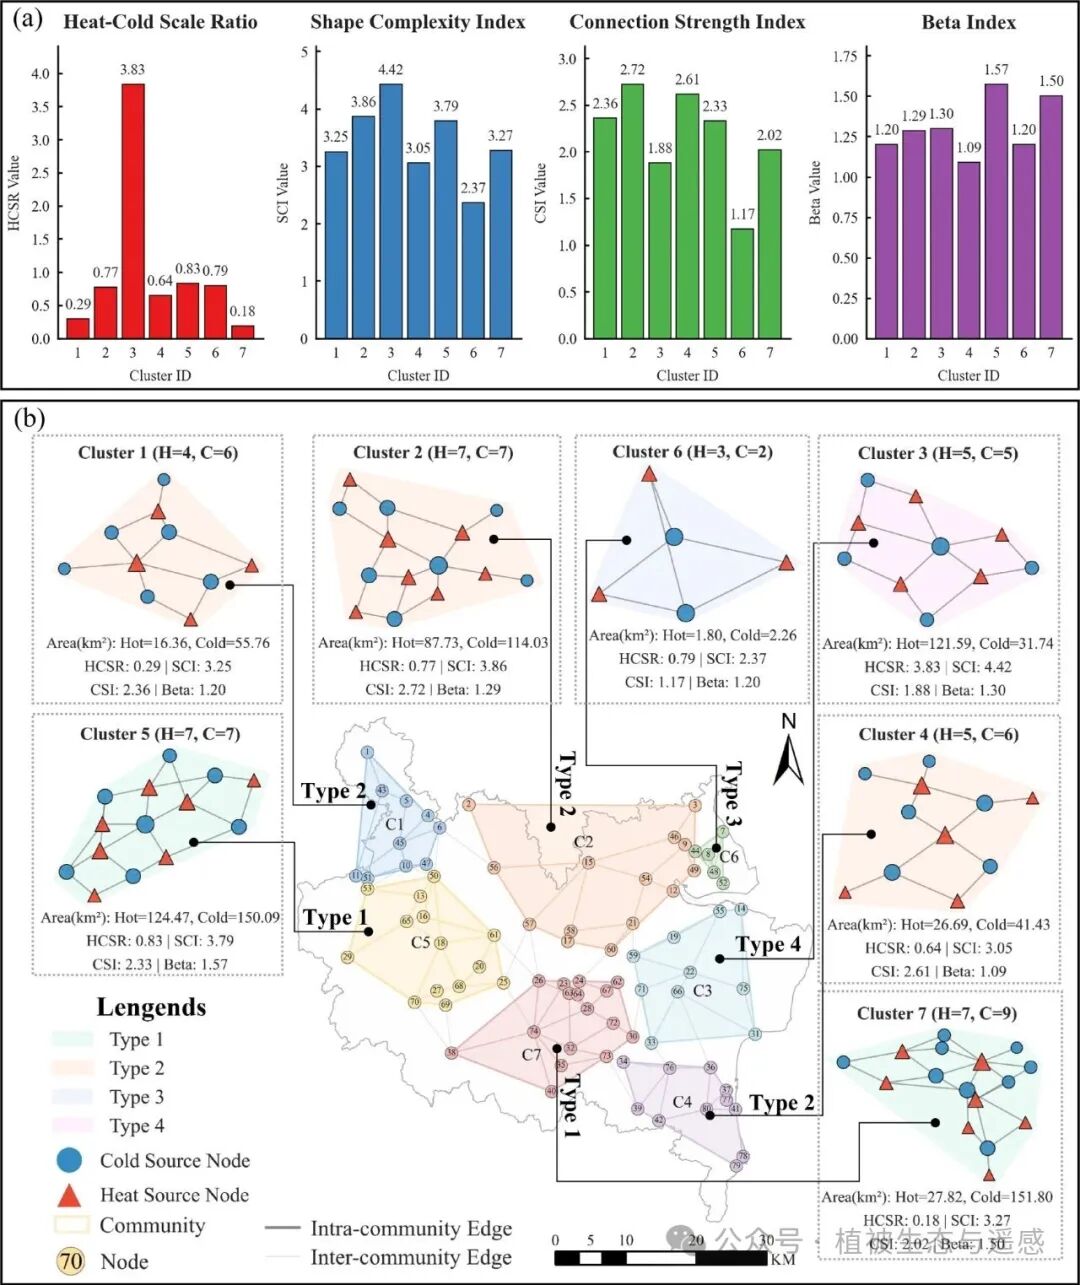
Figure 10: Typology and characteristics of heat-cool functional groups. (a) Quantitative indicators of the seven communities; (b) Spatial distribution and network topology.
Comprehensive analysis indicates that in terms of functional characteristics, the heat-cool scale ratio effectively quantifies the proportion of heat and cool source areas within clusters, directly reflecting the thermal regulation capacity and thermal stress intensity of each unit. Cluster 3 shows significant heat source dominance (3.83), while clusters 7 and 1 exhibit clear cool source dominance (0.18, 0.29), and clusters 2, 4, 5, and 6 form a relatively balanced configuration (0.64–0.83). In terms of morphological characteristics, shape complexity reflects differences in boundary configuration energy exchange potential, with cluster 3 being the highest (4.42) and cluster 6 the lowest (2.37). Topological analysis shows that connection strength and β index jointly determine the efficiency of heat-cool interaction paths and system stability: clusters 2 and 4 have the highest connection strength (2.72, 2.61), with robust internal connectivity networks; cluster 6 has the lowest connection strength (1.17), indicating a clear tendency for external system interaction. The β index further reveals the impact mechanism of network connectivity on the stability of heat-cool interactions: clusters 5 and 7 have the highest β values (1.57, 1.50), featuring complex network structures with multiple path connections; clusters 1, 4, and 6 have lower β values (1.09–1.20), indicating relatively simple network structures. There are significant differences in spatial scales, ranging from 4.06 km² in cluster 6 to 274.56 km² in cluster 5, reflecting the multi-scale characteristic spectrum of heat-cool interaction units (Figure 10a).
Based on the above indicators, the comprehensive analysis reveals four types of heat-cool interactions with significant ecological implications:
-
Type 1 (clusters 5, 7): Complex networked cool source systems, featuring complex network structures and regional-scale cooling capabilities, associated with favorable topography and lower development pressure;
-
Type 2 (clusters 1, 2, 4): Cool source-dominated, connectivity-intensive systems, densely connected internally and distributed in suburban transition zones, optimizing cooling efficiency by enhancing internal connectivity networks;
-
Type 3 (cluster 6): Small isolated cooling units, distributed in fragmented green space systems in the central urban area, primarily serving local thermal regulation;
-
Type 4 (cluster 3): Heat source-dominated complex morphological systems, concentrated in highly urbanized areas in the central and eastern parts, achieving adaptive thermal management through complex boundary configurations (Figure 10b).
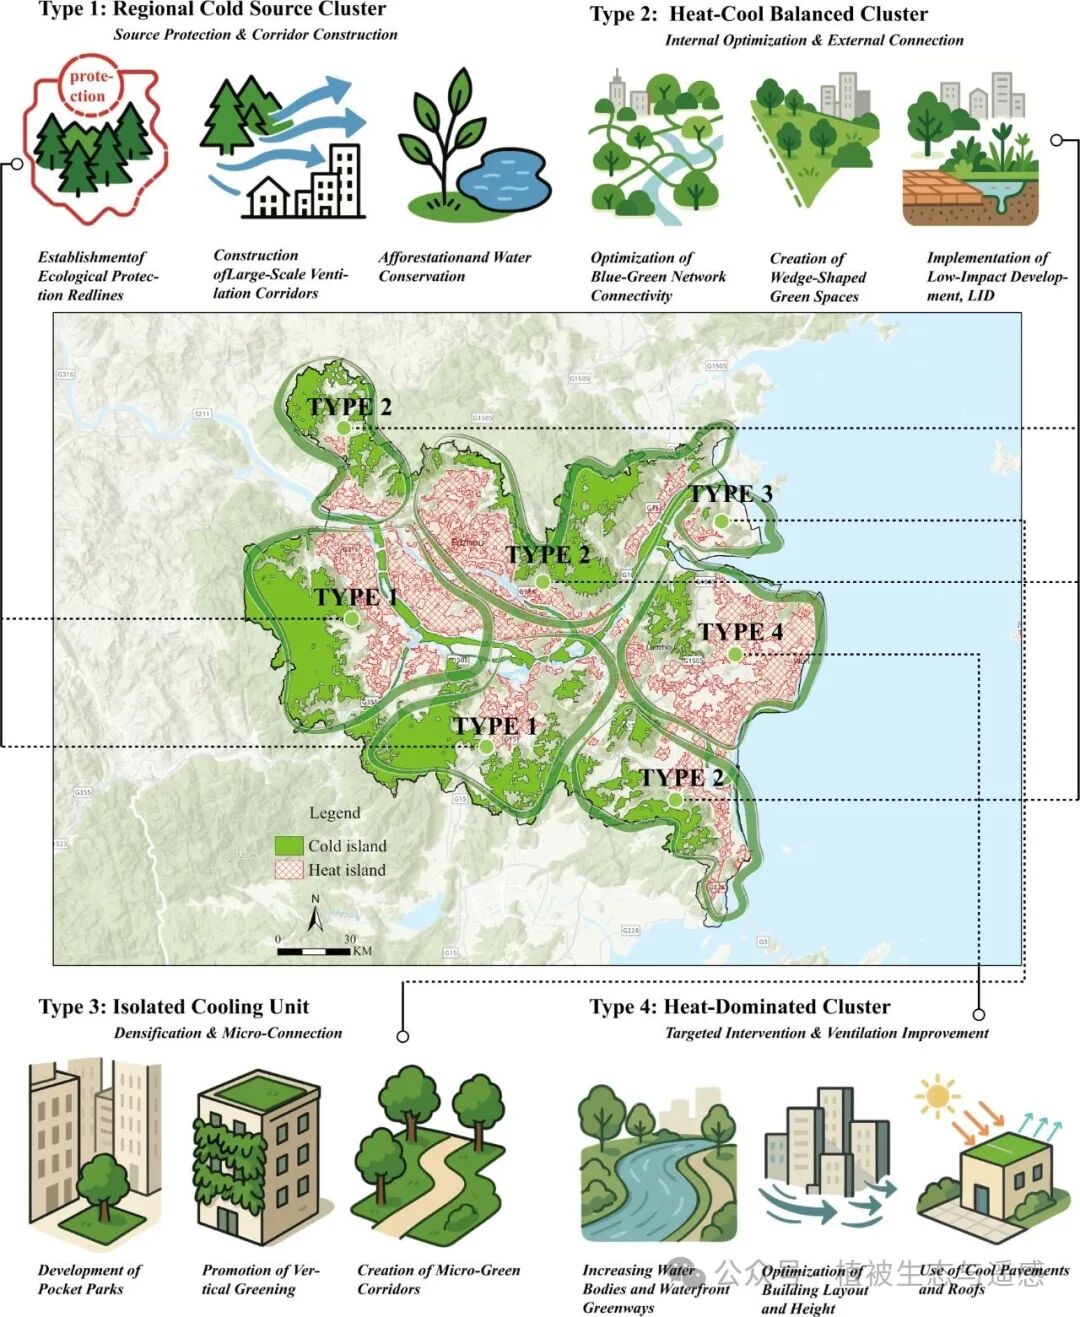
Figure 11: Differentiated governance strategies for heat-cool clusters.
END