In Vitro Pharmacodynamic Evaluation – Comparison of Biological Activity Determination Using Four-Parameter Regression Method Across Different Quality Standards
In Vitro Pharmacodynamic Evaluation – Cellular Biological Activity (Ten) USP<1032> Biometric Outlier and Development Strategies
In Vitro Pharmacodynamic Evaluation – Cellular Biological Activity (Nine) USP<1032> Biometric Models and Applicability Tests
In Vitro Pharmacodynamic Evaluation – Cellular Biological Activity (Eight) USP<1032> Variance Heterogeneity and Normality
In Vitro Pharmacodynamic Evaluation: Cellular Biological Activity (Seven)
In Vitro Pharmacodynamic Evaluation – Cellular Biological Activity (Six)
In Vitro Pharmacodynamic Evaluation – Cellular Biological Activity (Five)
In Vitro Pharmacodynamics (Four)
In Vitro Pharmacodynamics (Three)
In Vitro Pharmacodynamic Evaluation (Two)
What is Pharmacodynamics?
SDE-100 is a target-specific antibody-drug conjugate (ADC) directed against CD25. The malignant leukocytes in leukemia patients express high levels of CD25. The biological activity was selected using the human non-Hodgkin’s large cell lymphoma cell line Karpass 299, which has high expression of CD25 on its cell membrane.
Before conducting cell experiments, the cells were cultured for 4 weeks to monitor their growth rate and determine the cell doubling time. This step is crucial because the small molecule toxin used for conjugating antibodies, MMAE, interacts with tubulin only during cell division or attempts to divide, leading to cell death.
Studies have shown that the doubling time of Karpass 299 cells is approximately 30 hours, and about three doublings are required to create a significant difference between live and dead cells, facilitating detection. Therefore, the culture time for these cells can provide a reference for the initial incubation time of the drug with the cells during the early stages of method development.
In the early stages of cell culture, the team established a two-tier cell bank, consisting of a master cell bank and two working cell banks. By using the working cell banks, it ensures that all experiments utilize the same generation of cells, thereby reducing inter-cell variability.
Cellular Biological Activity Assay
1. Seed Karpass 299 cells into a 96 well plate to ensure even distribution. The drug is added to the 96 well plate in a concentration gradient, with high concentrations at the top and low concentrations at the bottom, and the cells are co-incubated with the drug for 5 days;
2. After 5 days of incubation, remove the 96 well plate and add the MTS detection reagent. MTS is a tetrazole compound whose detection principle is that the yellow MTS is reduced to a blue-purple formazan in the presence of nicotinamide adenine dinucleotide phosphate (NA), with NADPH used to detect live cells, while dead cells appear yellow and live cell wells appear blue. After adding MTS and incubating for 3 hours, the color in the wells is observed to change from yellow to blue (from top to bottom), with the color change positively correlated with drug concentration;
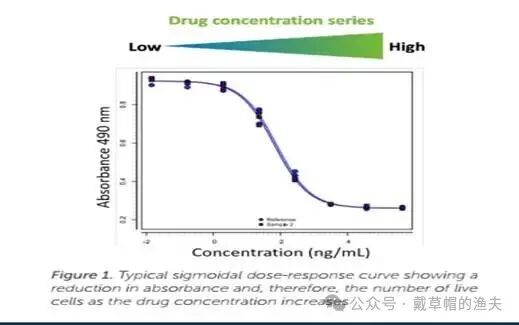
3. Read the OD490 nm absorbance using a microplate reader, where a high OD value indicates a higher number of live cells, and a low OD value indicates a higher number of dead cells. The results are shown in Figure 1:
Method Development for ADC SDE-100 When developing detection methods, it is essential to study the various mechanisms of action of the antibodies and their antibody-drug conjugates (ADC).
1) The binding of the antibody to the target may produce cytotoxic effects, such as by inhibiting the dimerization and activation of growth factor receptors.
2) The crystallizable fragment (FC) tail of the antibody may also recruit cytotoxic components of the immune system through antibody-dependent cellular cytotoxicity (ADCC), antibody-dependent phagocytosis (ADP), or complement-dependent cytotoxicity (CDC).
In antibody-drug conjugates (ADC), in addition to drug-mediated cytotoxicity, these cytotoxic effects may also be induced. Therefore, it may be necessary to develop a series of cell-based detection methods, such as antibody-dependent cellular cytotoxicity (ADCC) or cytotoxicity (CDC) assays, to test the various mechanisms of action of the ADC, especially in cases where monoclonal antibodies have been confirmed to have therapeutic effects, it is crucial to ensure that conjugating the antibody with the cytotoxin does not alter or eliminate its therapeutic mechanism of action.
Evaluation of Cellular Activation Leading to Apoptosis by MMAE
Reviewing the literature related to specific antibody conjugated drugs (ADC) and their target cell types is not only a necessary approach to clarify their multiple mechanisms of action but also provides important basis for setting initial conditions during the early stages of assay development.
One significant challenge to overcome when developing cell detection methods is biological variability. Sources of variability between cell lines include cell doubling time, cell surface antigen density, toxin sensitivity, and seeding density. Therefore, optimizing incubation time, the duration of cell exposure to the drug, cell density, and the range of drug concentrations is crucial when developing new detection methods. Clearly defining the characteristics of the final potency curve is also essential. Table 1 lists the characteristics required for the potency curve during method development, primarily characterized by three features:
1) The data points themselves must define a curve with four parameters, including upper asymptote, lower asymptote, linear portion, and at least three points for easy definition of EC50;
2) The multiplicative response difference between the upper and lower asymptotes should be able to fit the data using a four-parameter logistic model, with an R² value greater than 0.95, indicating a good fit of the original data to the model;
3) To ensure that the interaction between the samples and the reference with the cells is the same, the linear portions of their respective potency curves must be parallel, which can be verified through visual inspection and statistical analysis of the curves. The detection parameters that affect these characteristics mainly include the drug concentration series, drug incubation time, and cell seeding density.
Table 1 Characteristics Required for Potency Curve 
Figure 2 shows the experimental results of adding different drug concentration series to the cells under fixed initial cell density and incubation time. This experiment demonstrates the feasibility of the detection method to be developed. Additionally, this experiment also determines the appropriate drug concentration series for subsequent development steps. The curves in the figure exhibit a good S-shape, with a clear upper asymptote, linear region, and lower asymptote.
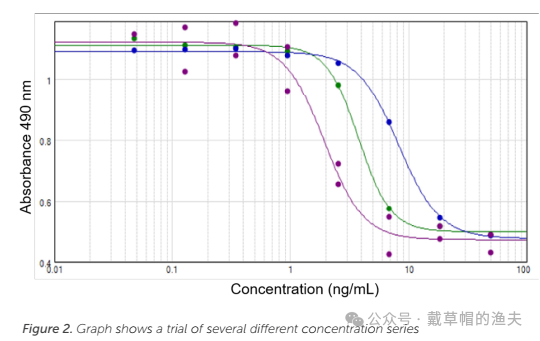
Figure 3 shows the effects of different incubation times and cell densities. The left and right images represent the results of incubating for 5 days and 6 days, respectively, with different cell densities and the same drug concentration; compared to the 5-day incubation, the quality of the potency curve decreased after 6 days of incubation.
The reason may be that after 6 days of incubation, a large number of cells died, making it difficult to distinguish between live and dead cells in the assay. Therefore, determining a 5-day incubation is considered the optimal time for obtaining high-quality potency curves.
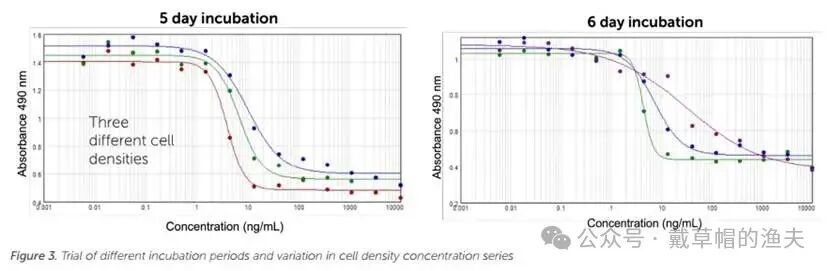
Statistical analysis of the curves for the 5-day incubation was performed to determine which curve had the best quality. The focus was then on the R² values of each curve to determine which curve best fit the corresponding data.
Analysis of the 5-day culture curves showed that the red curve exhibited the best R² value, closest to 1, and the highest AD ratio. Based on this, the concentration series and cell density were further optimized, ultimately generating the final detection method for pre-validation.
When reporting results, absolute potency values were not reported for each sample; instead, a reference sample was included in each assay to report relative potency.
Figure 4 shows the reference sample in blue and the control sample in purple, with the control sample curve completely overlapping with the reference sample curve. Based on the curve’s deviation, it can be seen that the low DAR value sample in the left image has a higher activity value compared to the high DAR value sample in the right image. 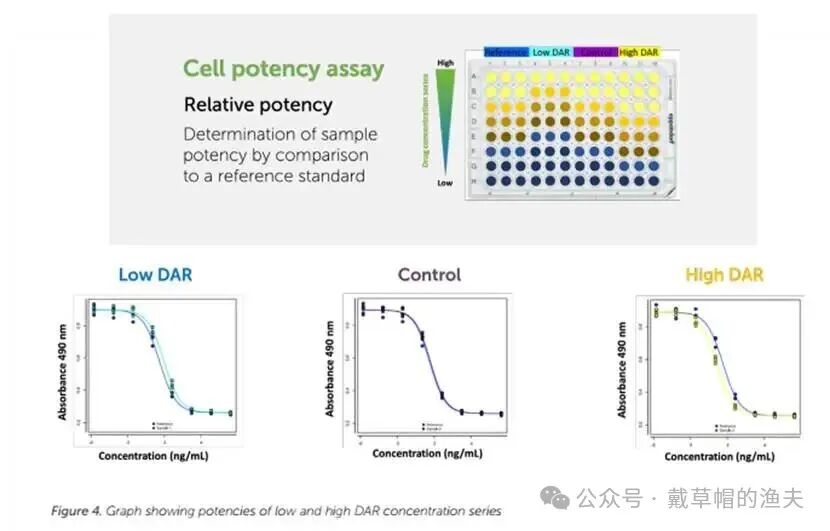
Distinguishing between high DAR and low DAR samples is another important indicator in ADC potency determination, as the mechanism of action of ADCs involves internalization and subsequent toxin release. If the detection method is not sensitive to DAR, the mechanism by which the ADC fails to kill cells and whether this detection method is suitable as a model for in vivo drug activity will be questioned.
Validation of Cellular Activity Analysis Method
The method validation was conducted according to ICH guidelines, and Figure 5 shows the linearity and range results of the detection method, with a statistically significant correlation between linearity and nominal values, and relative potencies all within 50%~200% (relative values).
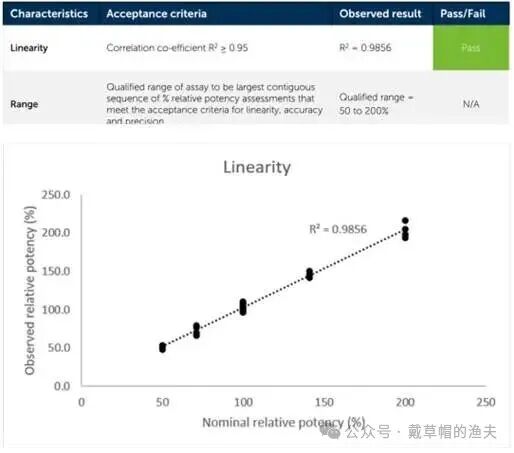
Table 2 shows the acceptance criteria for method validation, with results indicating that the accuracy and precision of all data points were within 50%~200%, meeting the acceptance criteria, determining the effective range of the detection method to be 50%~200%.
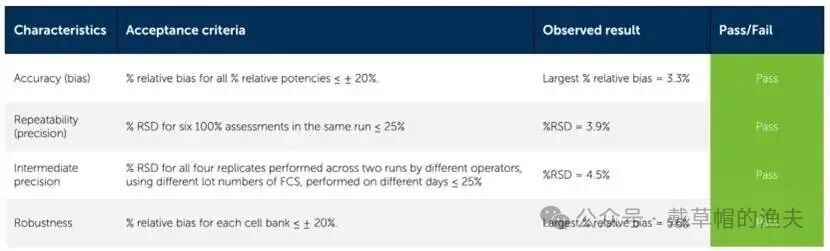
The accuracy of the assessment is determined by calculating the relative deviation, which compares the nominal potency of a specific assessment with the observed potency.
The maximum relative deviation percentage observed in the assessment was 3.3%. The observed assessment result was 141%, which was higher than expected by 3.3%.
Repeatability is determined by measuring the relative standard deviation (RSD) of six 100% assessments conducted in the same run, resulting in 3.9%;
Intermediate precision was determined through four assessments, each conducted in duplicate by different analysts using different batches of fetal bovine serum as the culture medium, and on different dates. The relative standard deviation (RSD) was 4.5%;
Robustness was determined by comparing the relative deviation assessed using two different cell banks, with the maximum relative deviation percentage being 5.6%;
The results indicate that the assessment of accuracy, variability within a single run, variability between runs, and variability between different cell banks all passed the acceptance criteria for method validation.
The system suitability criteria include the R² value of the potency curve, the precision of three replicate measurements at each drug concentration, the AD ratio, and the parallelism of the sample curve and reference curve used to determine relative potency. These system suitability criteria met the acceptance criteria set during the validation phase and were subsequently incorporated into the data analysis of sample testing. Data generated using the validated detection method must meet these system suitability criteria to be accepted.
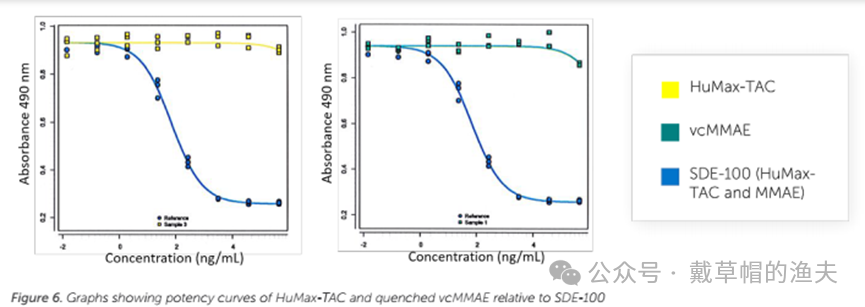
Figure 6 compares the relative potency of ADC SDE-100 with the monoclonal antibodies HuMax-TAC and the NAC quenched toxin conjugate vcMMAE, demonstrating the specificity of the method.
Content Reference:
sterling-cell-based-assays-whitepaper