BindCraft is a new computational tool designed for the one-shot method of creating functional protein binders.
https://www.nature.com/articles/s41586-025-09429-6
Here are some key points from the paper:
[Apologies for the long delay in updates]
What is BindCraft?
BindCraft is an open-source, automated one-stop protein binder design process aimed at simplifying the de novo design of protein binders. Its core innovation lies in directly utilizing the weights of the AlphaFold network to efficiently “hallucinate” new binders and interfaces through backpropagation, thus bypassing the labor-intensive screening and optimization steps of traditional methods.
How BindCraft Works
The design process of BindCraft consists of the following main steps:
Co-design of binder scaffolds and sequences:
- The process begins with a target protein structure, then uses the AlphaFold2 multimer model to generate the scaffold and sequence of the binder.
- Non-interface region sequence optimization: Next, the core and surface sequences of the binder are optimized using ProteinMPNN, while keeping the binding interface with the target protein unchanged.
- Validation and screening: Finally, the designed binder is validated and screened through a series of computational filters, including predictions using the AlphaFold2 monomer model and physical scoring metrics from Rosetta.
This technology differs from existing methods (such as RFdiffusion) in that BindCraft re-predicts the binder-target complex in each design iteration, allowing for flexible adjustments of both the side chains and backbones of the binder and target protein, thus generating structures and interfaces that better fit the target binding site.
Design Achievements and Applications of BindCraft
BindCraft has achieved significant success on several challenging targets, with an experimental success rate of 10% to 100%, and an average success rate of 46.3%. This represents a substantial improvement over previous methods (such as Rosetta), which had a success rate of less than 0.1%.
The paper demonstrates the potential applications of BindCraft in the following areas:Therapeutics: Designing binders that can bind to cell surface receptors (such as PD-1, PD-L1), and even bind to complex receptors (such as CD45) without clear binding sites.
- Diagnostics and Biotechnology: Designing competitive binders to inhibit the cytotoxicity of foodborne bacterial toxins, thereby mitigating their effects. Regulating the gene editing activity of multi-domain nucleases (such as CRISPR-Cas9). Designing binders to neutralize allergens (such as birch pollen allergen Bet v1), thereby reducing IgE binding in patient serum. Redirecting adeno-associated virus (AAV) capsids for targeted gene delivery.
Overall, this paper indicates that BindCraft represents a significant step towards the ‘one design-one binder’ approach in computational design, and is expected to make protein binder design accessible to a broader research community, beyond teams with specialized computational design knowledge or high-throughput screening facilities. The BindCraft introduced in this paper indeed shows significant innovation and differentiation advantages in the field of protein design.
Technical Route
The core technical route of this paper revolves around the BindCraft automated process, aiming to achieve de novo design of functional protein binders through deep learning models like AlphaFold2 (AF2) and significantly improve success rates. The entire process can be summarized in the following key steps:
Input Preparation: Setting design goals, including target protein structure, minimum/maximum length of the binder, and the expected final design quantity. Users can optionally specify a binding hotspot region or leave it entirely unspecified, allowing the process to automatically select binding sites.
Binder Hallucination: This is the core step of BindCraft. It uses the AF2 multimer model to optimize the binder’s sequence through backpropagation while generating structures and binding interfaces.
Sequence Optimization: To enhance the stability and solubility of the design, the core and surface regions of the binder’s non-interface will undergo further optimization using another neural network, ProteinMPNN.
Validation and Filtering: The optimized design will be re-predicted using the AF2 monomer model and undergo strict screening combined with physical scoring metrics from Rosetta.
Experimental Validation: Finally, the designs selected through computational screening will undergo in vitro and in vivo experiments to validate their binding affinity, functionality, and structural accuracy.
1. Computational Design Process
The design process of BindCraft utilizes ColabDesign for the implementation of AF2. The specific execution steps are as follows:
Initialization: The process begins with a random sequence binder, which is input into the AF2 network along with the target protein structure template.
Loss Function Optimization: The process calculates design errors through a loss function composed of multiple parameters, such as:
Predicted Local Distance Difference (pLDDT) of the binder.
Interface Prediction Alignment Errors (i_pTM and i_pAE).
Residue contact loss between the binder and target protein.
Radius of gyration of the binder.
Sequence Iterative Optimization: The process iteratively optimizes the binder sequence through a gradient descent algorithm to minimize the loss function. To avoid overfitting, it randomly switches between five different model weights of AF2 multimer in each iteration. Sequence optimization occurs in four stages, gradually converging from a more exploratory continuous sequence space to a more realistic discrete sequence representation.
Final Screening: Successful binder design trajectories will be sent to ProteinMPNN for sequence optimization. Subsequently, re-predictions using the AF2 monomer model will be conducted, combined with Rosetta’s interface shape complementarity, hydrogen bond counts, and other physical metrics for final screening to ensure design quality.
2. Experimental Validation Process
The paper validates the effectiveness of the designs through various experimental methods:
Protein Expression and Purification: The designed proteins are expressed using E. coli or mammalian cell systems (such as Expi293) and purified through methods like affinity chromatography and gel filtration.
Binding Activity Assays:
Surface Plasmon Resonance (SPR) and Bio-Layer Interferometry (BLI): These two methods are widely used to measure the binding affinity and kinetics of the binder with the target protein.
Competitive Assays: By introducing known antibodies or natural ligands, the ability of the designed binder to competitively occupy the same binding site is validated.
Functional Validation:
Cytotoxicity Assays: The binder against the toxin protein (CpE) is validated through cellular experiments for its ability to inhibit cell death.
Gene Editing Efficiency Assays: The binder against CRISPR-Cas9 is validated by co-transfection in HEK293T cells, measuring its inhibitory effect on gene editing activity.
AAV Targeted Delivery: The binder sequence is inserted into the AAV viral capsid to verify whether it can successfully redirect the viral vector to specific cell receptors.
Structural Analysis:
X-ray Crystallography and Cryo-Electron Microscopy (cryo-EM): These high-resolution methods are used to resolve the true structure of the binder-target protein complex and compare the experimental structure with the computational design model to validate design accuracy.
Visual Explanation
Fig. 1: De Novo Binder Design with BindCraft
This figure is the core of the entire paper, outlining the workflow of BindCraft and demonstrating its success rates on different targets.
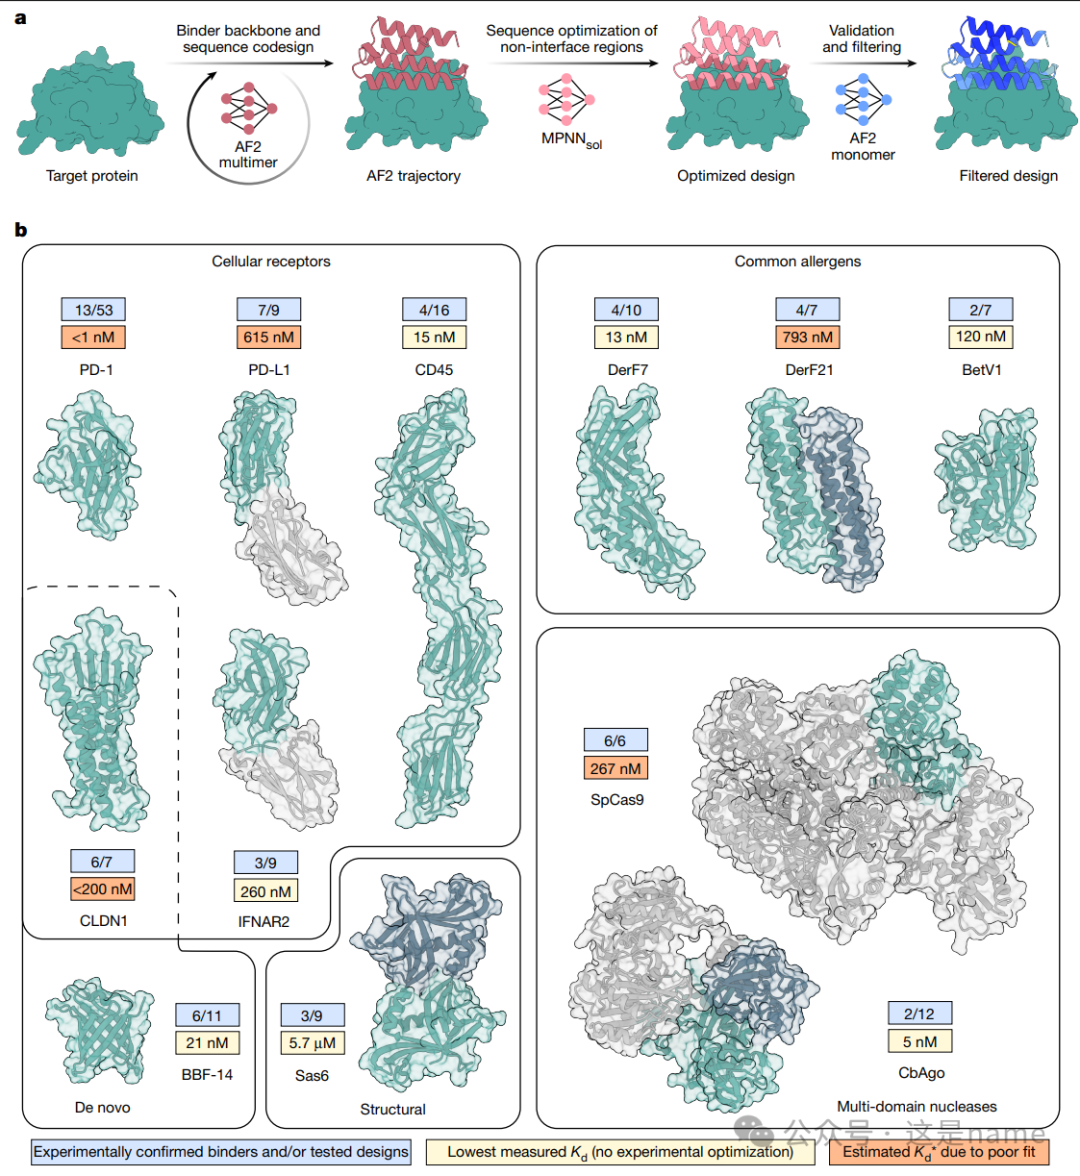
Fig. 1a: Schematic of the BindCraft Design Process. This subfigure clearly illustrates the three main steps of BindCraft in a flowchart format. First, a target protein (Target protein) is input, and the AF2 multimer model simultaneously performs co-design of the binder scaffold and sequence, generating an “AF2 trajectory.” Then, the sequence of the non-interface region is optimized using MPNNsol, resulting in an “Optimized design.” Finally, validation and filtering are conducted through predictions from the AF2 monomer model, generating the final “Filtered design.” This process reflects the complete path from initial design to refined optimization and rigorous screening.

Fig. 1b: Overview of Protein Design Targets. This subfigure presents a series of structural models and data frames, showcasing the diverse targets for which BindCraft successfully designed binders.Different Target Types: Target proteins are categorized into four types: Cellular receptors, Common allergens, De novo designed proteins, and Multi-domain nucleases.
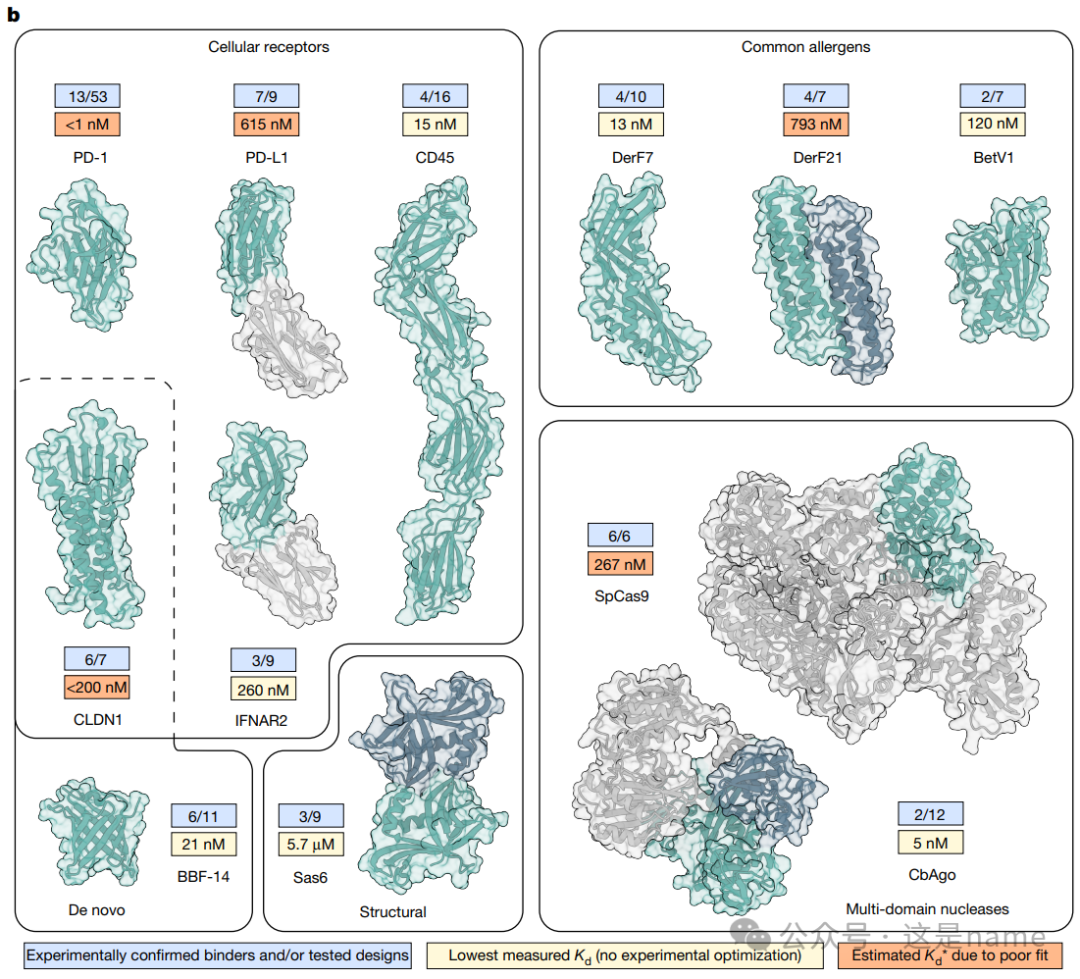
Data Trends: Each target is accompanied by a data frame, where the score in the blue box (e.g., 13/53) indicates the ratio of successfully validated binders to the total number tested. This directly reflects the high success rate of BindCraft. The values in the yellow box (e.g., <1 nM) represent the dissociation constant (Kd) of the highest affinity binder, typically in the nanomolar (nM) range, indicating that the designed binders exhibit extremely high binding affinity. Overall, this data trend shows that BindCraft can consistently generate high-affinity binders across different types and complexities of targets.
Fig. 2: Binder Design Targeting Cell Surface Receptors
This figure details the functionality and affinity of binders designed by BindCraft on cell surface receptors.
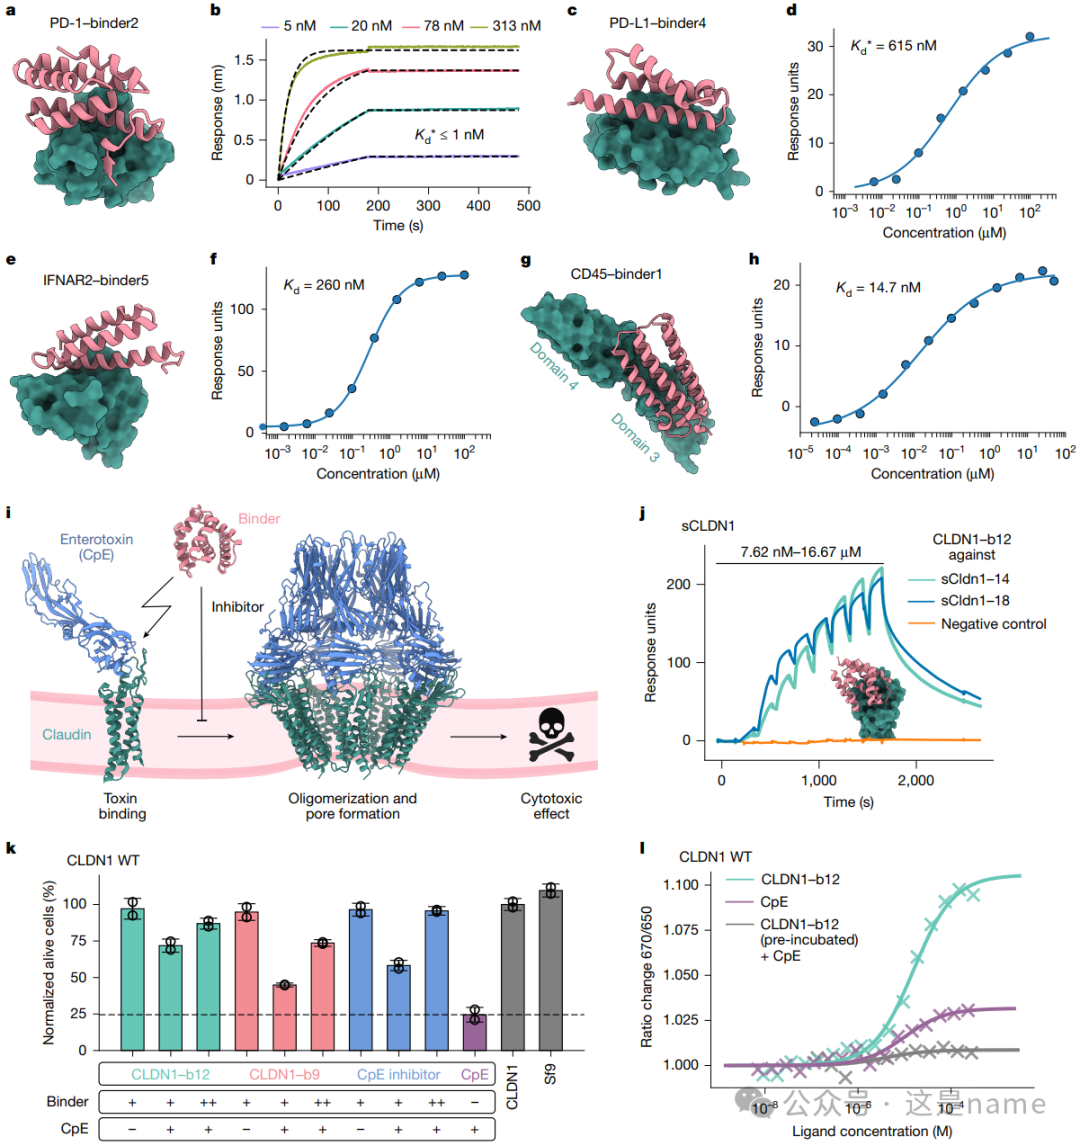
Fig. 2a, c, e, g: These subfigures showcase the designed binders (e.g., binders targeting PD-1, PD-L1, IFNAR2, and CD45) along with their computational models with the target proteins.
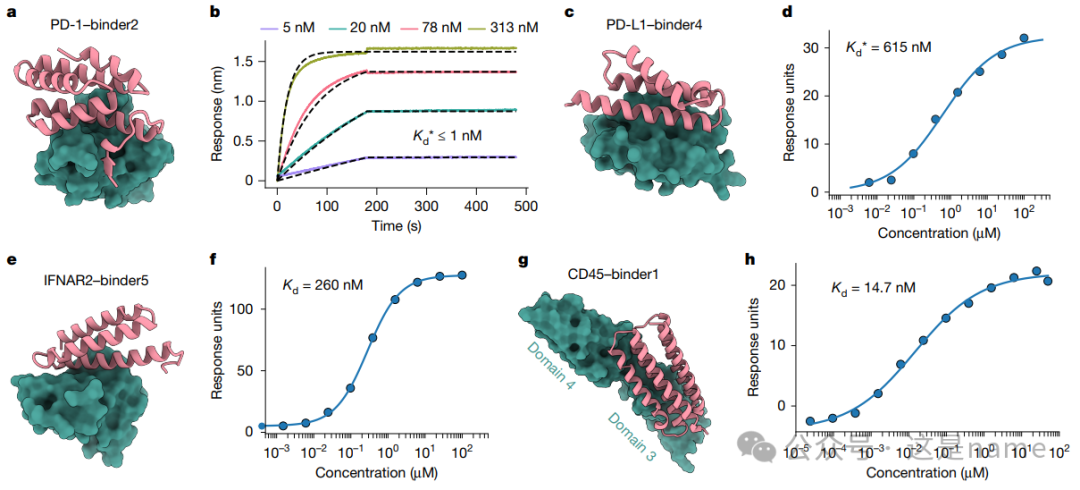
Fig. 2b, d, f, h: These subfigures present experimental data quantifying the binding affinity of the binders.
BLI and SPR Curves: They illustrate the relationship between binder concentration and response units (Response units), allowing for the determination of binding affinity Kd values through curve fitting.
Trend Changes: The steepness and saturation trends of the curves indicate high-affinity binding. For instance, the Kd value of the PD-1 binder in Fig. 2b is less than 1 nM, while the Kd values for the IFNAR2 and CD45 binders in Fig. 2f and 2h are 260 nM and 14.7 nM, respectively, confirming that the designed binders achieve nanomolar-level affinity.
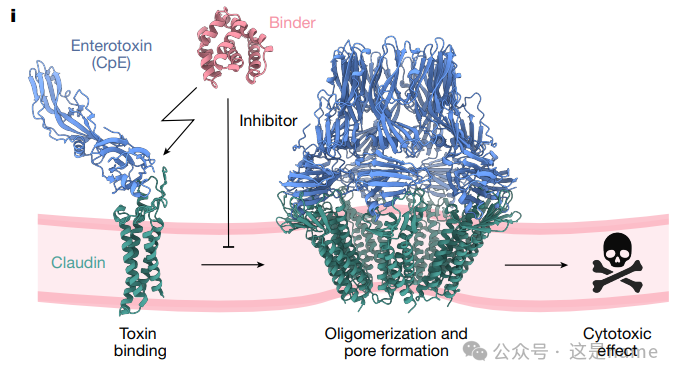
Fig. 2i: Schematic of Binder Inhibition of CpE Cytotoxicity. This figure graphically explains how the binder competes with the toxin (CpE) to bind to Claudin proteins, thereby preventing the formation of pores and cell death, achieving cell protection.
Fig. 2j, k, l: These subfigures provide functional experimental evidence.
Fig. 2k is a bar graph showing the inhibitory effects of different binders on CpE toxin at various concentrations. The percentage of alive cells (%) increases with the concentration of the binder (++ vs +), indicating that the binder can effectively protect cells in a concentration-dependent manner.
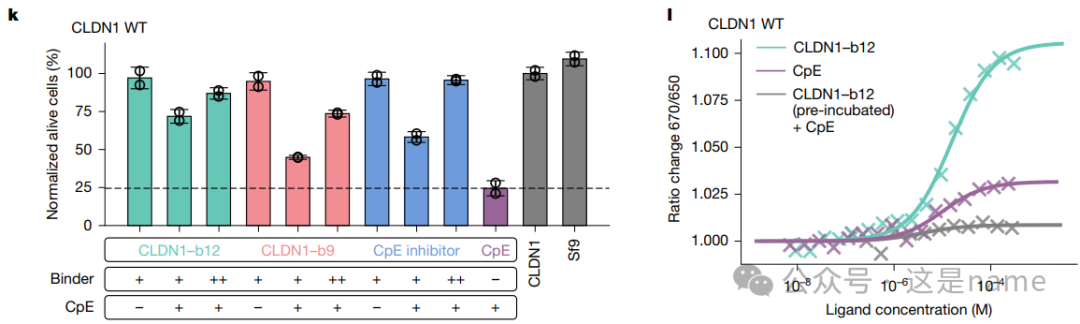
Fig. 2j and 2l The curves further confirm through SPR and MST experiments that the binder (binder12) binds to Claudin proteins and successfully blocks the binding of CpE, validating its mechanism of toxicity inhibition.
Fig. 3: Binders Targeting Common Allergens
This figure highlights BindCraft’s ability to design binders that can block allergen epitopes, providing structural and functional validation.
Fig. 3a, c, e: These subfigures showcase the design models targeting allergens (Der f7, Der f21, Bet v1) and their binding affinity curves measured by SPR.
Trend Changes: The curve fitting results indicate that the designed binders exhibit high affinity for these allergens, with Kd values reaching 12.8 nM, 793 nM, and 120 nM, respectively.
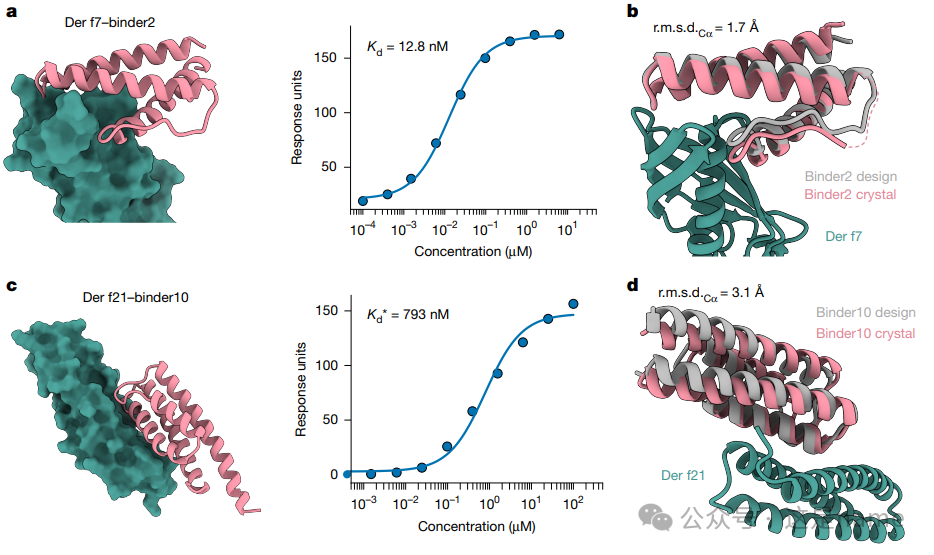
Fig. 3b, d: These two figures validate the accuracy of the design model through crystal structures.
Structural Comparison: The colored crystal structure (Crystal) is overlaid with the gray design model (Design), showing very low root mean square deviation (r.m.s.d.) values (1.7 Å and 3.1 Å), proving the high fidelity of computational design in predicting protein folding and binding modes.
Fig. 3f: SEC-MALS (Size Exclusion Chromatography-Multi-Angle Light Scattering) analysis graph.
Trend Changes: This figure shows the molecular weight of the Bet v1 allergen when present alone (blue peak, 18.0 kDa) and when mixed with the designed binder (binder2) (orange peak, 27.8 kDa). The increase in molecular weight upon mixing aligns with the expected molecular weight of a 1:1 complex, validating the formation of a stable complex between the binder and the target protein.
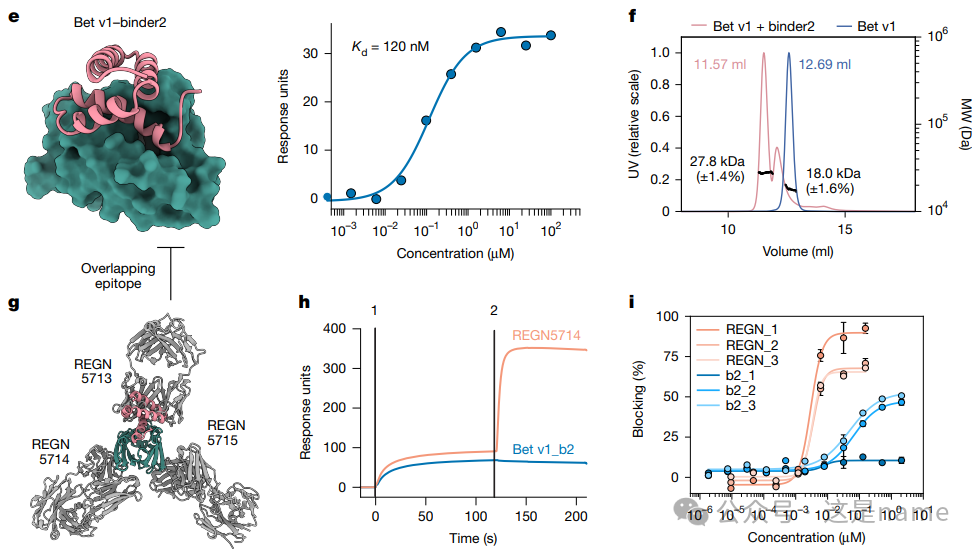
Fig. 3h: Competitive Assay. This subfigure demonstrates through SPR curves the different behaviors of the Bet v1 binder (binder2) and known antibody (REGN5714) when competing for binding to Bet v1. The binder (red curve) shows no binding signal, while the antibody (blue curve) does, confirming that the designed binder successfully targets the same overlapping epitope as the antibody.
Fig. 3i: Blocking ELISA Experiment.Trend Changes: The curves show that as the concentration of the binder (blue line) or antibody mixture (orange line) increases, the binding of Bet v1 to IgE in patient serum is effectively blocked, with the percentage (Blocking %) gradually increasing. This indicates that the designed binder has the potential to neutralize allergic reactions.
Fig. 4: Targeting Nucleic Acid Interactions with De Novo Designed Binders
This figure showcases BindCraft’s ability to design binders targeting complex multi-domain nucleases (such as CRISPR-Cas9 and Argonaute). These targets are often considered difficult to design small molecule drugs due to their large and charged surfaces.
Fig. 4a: Structure Model of SpCas9 REC1 Domain. This subfigure zooms in on the SpCas9 REC1 domain, showing its pocket for binding to guide RNA (gRNA). A de novo designed binder is overlaid onto this binding pocket, visually indicating the design intent—to interfere with its natural function by occupying this pocket.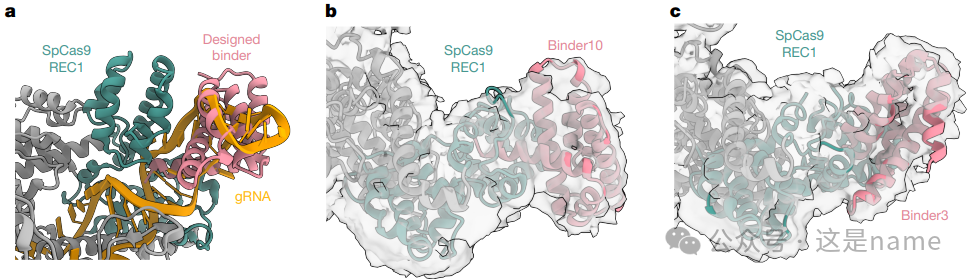
Fig. 4b, c: Cryo-EM Structures of Binders with SpCas9. These two subfigures display the cryo-EM density maps after the binding of binder3 and binder10 to the apo form of SpCas9 (without nucleic acid). Despite limited resolution, the binding density of the binder to the REC1 domain is clearly visible, strongly validating the accuracy of the designed binding mode.
Fig. 4d: Gene Editing Efficiency of SpCas9. This bar graph compares the effects of different designed binders (green bars) and natural anti-CRISPR proteins (Acrs) (blue bars) on the gene editing activity of SpCas9 in HEK293T cells.
Trend Changes: The heights of the green and blue bars are significantly lower than the positive control (gray dashed line) and negative control (Negative control) for SpCas9. This indicates that the designed binders can significantly reduce gene editing efficiency. Notably, these designed binders outperform AcrIIC2, suggesting they inhibit function through a new and unique mechanism.
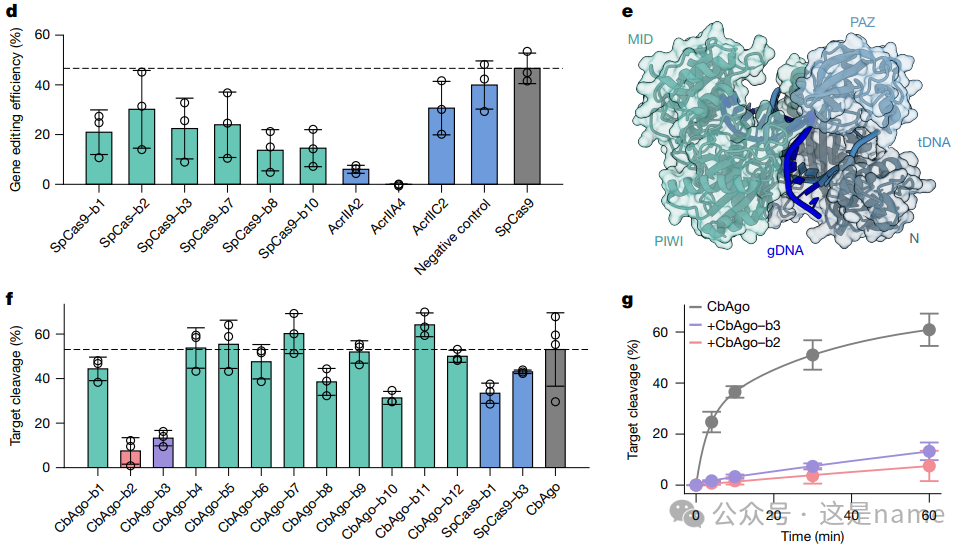
Fig. 4e: Structure Model of CbAgo. This figure presents another target—the structure of Argonaute (CbAgo) nuclease from Clostridium butyricum. Its PAZ domain and N+PIWI domain are marked as design targets, indicating that BindCraft’s designs can target different functional domains.
Fig. 4f, g: CbAgo Target DNA Cleavage Efficiency. These figures validate the inhibitory effect of the designed binders on CbAgo activity through in vitro experiments.
Fig. 4f The bar graph shows that both the green bar (designed CbAgo binder) and the blue bar (designed SpCas9 binder) lead to a significant decrease in the percentage of target DNA cleavage (Target cleavage %).
Fig. 4g The curve graph illustrates that without the binder (gray line), CbAgo-mediated DNA cleavage occurs rapidly over time. When the designed binder2 (pink line) or binder3 (purple line) is added, the cleavage rate significantly decreases, and the curve flattens. This indicates that these binders can effectively act as inhibitors of CbAgo.
Fig. 5: Engineering Targeted AAV Viral Vectors for Gene Delivery
This figure demonstrates the application of BindCraft in gene therapy, specifically achieving precise cell-targeted gene delivery by integrating designed binders into AAV capsids.
Fig. 5a: Schematic of AAV Redirection. This subfigure presents a clear flowchart showing how AAV vectors transition from natural, non-specific tropism to targeted delivery through de novo designed protein-protein interactions (PPI). This process includes knocking out the natural attachment sites of the AAV capsid (KO) and then inserting specific binder genes into the capsid to achieve redirection to specific cell types.
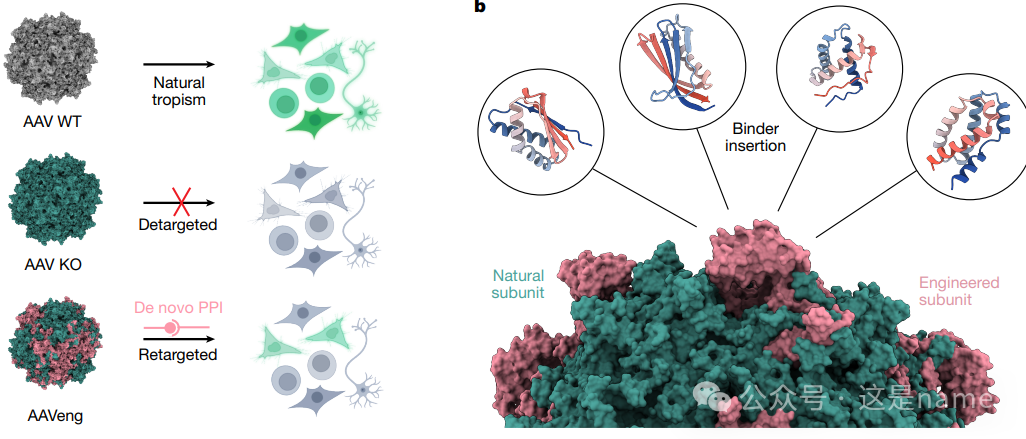
Fig. 5b: Assembly of Redirected AAV Particles. This figure illustrates the structure of AAV particles, where some capsid proteins (green) are natural, while others (pink) have been genetically inserted with designed binders. This explains how simple genetic engineering can modify the viral capsid.
Fig. 5c, f: Measurement of Transduction Efficiency. These figures present flow cytometry data showing the transduction efficiency of different AAV variants on HEK293 cells stably overexpressing HER2 and PD-L1.
Fig. 5c The bar graph shows that HER2-targeting HER2-b1 and HER2-b2, as well as PD-L1-targeting PD-L1-b202, exhibit significantly higher transduction efficiency (Transduced cells (GFP+) (%)) on target cells (HER2+ and PD-L1+) compared to other variants. Notably, their signal-to-noise ratios (signal-to-noise ratio, ‘x’ fold change) reach 17x and 100x, far exceeding wild-type (WT) and knockout (KO), indicating that the designed binders confer high specificity to the AAV.
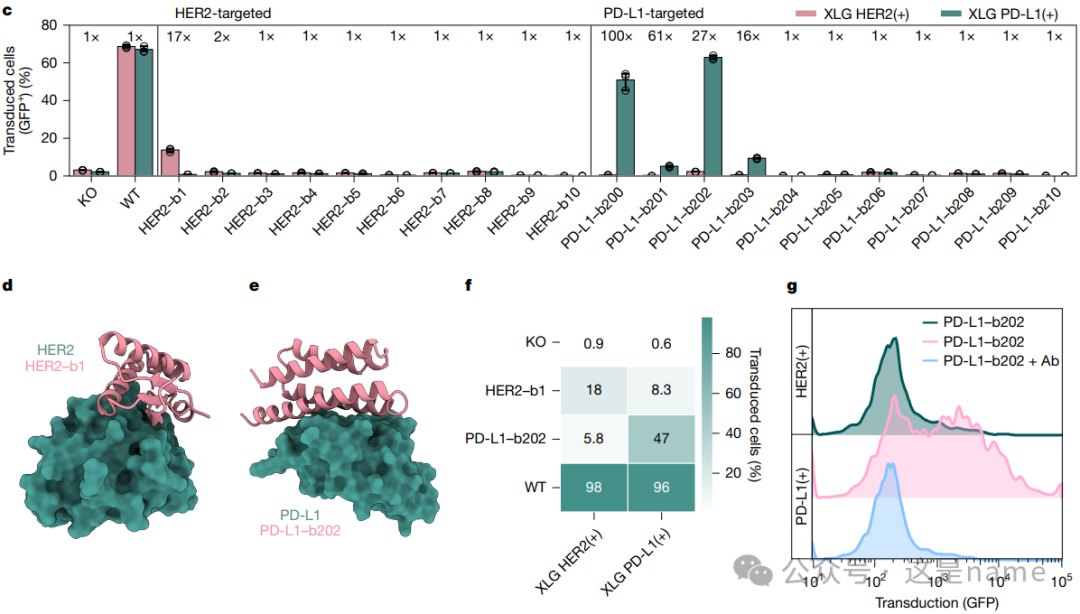
Fig. 5f The heatmap visually emphasizes the high specificity of HER2-b1 and PD-L1-b202 variants for their respective target cells, while the transduction rates for non-target cells are very low.
Fig. 5d, e: Binder Design Models. These two subfigures showcase the computational models of the binders (HER2-b1 and PD-L1-b202) used for redirection with their respective target receptors.
Fig. 5g: Blocking Transduction. This histogram presents a key validation experiment. When an antibody that can target the same epitope as the designed binder is added, the transduction of PD-L1-targeting AAV is blocked. Trend Changes: The curve shifts from the right side (high transduction) to the left side (low transduction), confirming that the transduction of AAV is indeed mediated by the binding of the designed binder to the target receptor.