Solution to the Issue of MATLAB Axis Lines Being Covered by pcolor
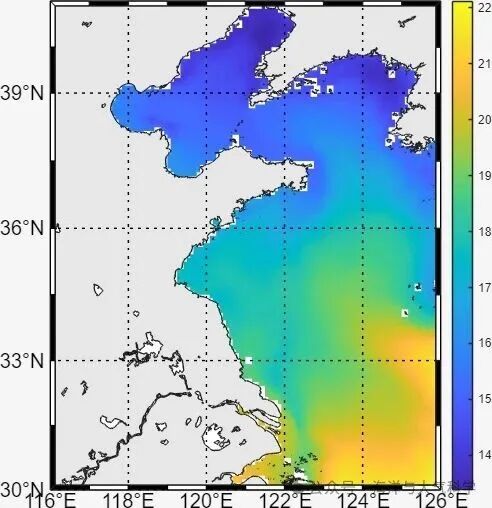
Coverage Situation: The plot without using m_map is as follows:
.rtcContent { padding: 30px; } .lineNode {font-size: 10pt; font-family: Menlo, Monaco, Consolas, "Courier New", monospace; font-style: normal; font-weight: normal; }close allfigure('Position',[100 100 800 600])pcolor(Lon, Lat, theta_sel');shading interp; colorbar;colormap(jet);caxis([min(theta_sel(:),[],'omitnan'), max(theta_sel(:),[],'omitnan')]);xlabel('Longitude (°E)');ylabel('Latitude (°N)');grid on; box on;Making the lines thicker does not work: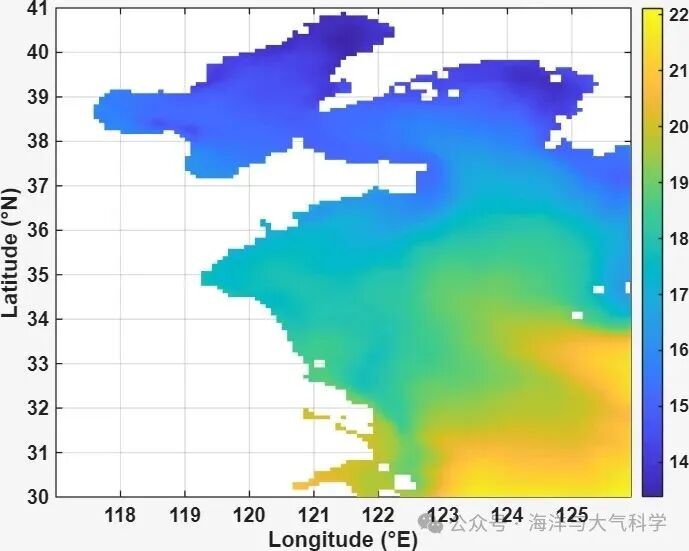

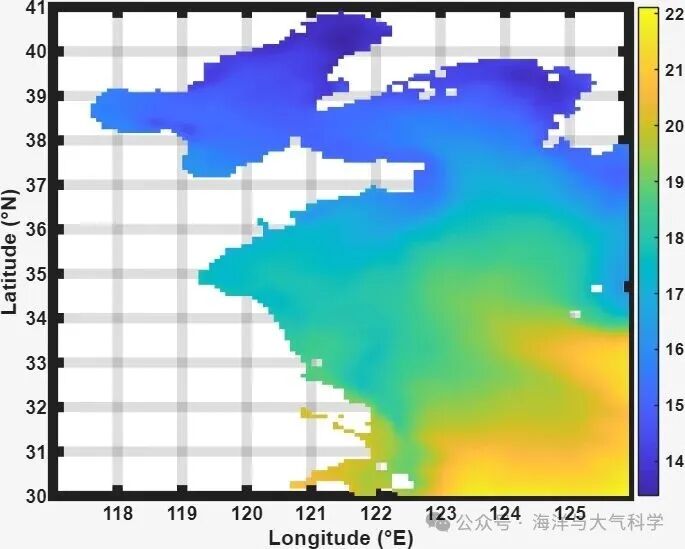
Resolved Plot:
The axis is now on top:
Solution: Set the layer to top
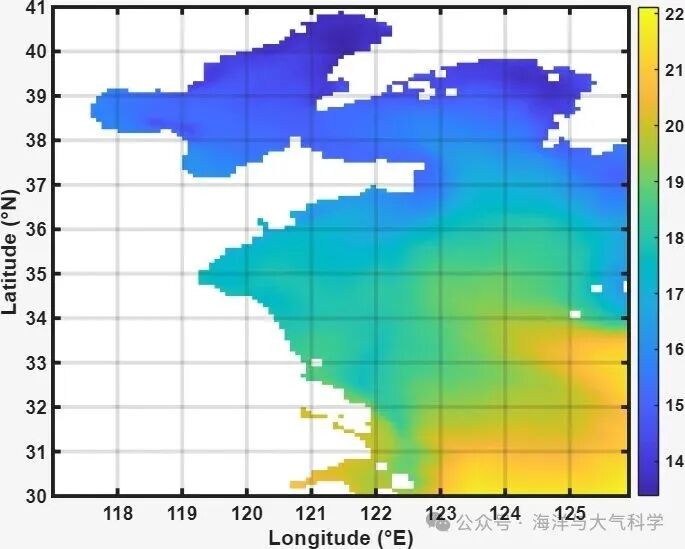
.rtcContent { padding: 30px; } .lineNode {font-size: 10pt; font-family: Menlo, Monaco, Consolas, "Courier New", monospace; font-style: normal; font-weight: normal; }close allfigure('Position',[100 100 800 600])pcolor(Lon, Lat, theta_sel');shading interp; colorbar;colormap(jet);caxis([min(theta_sel(:),[],'omitnan'), max(theta_sel(:),[],'omitnan')]);xlabel('Longitude (°E)');ylabel('Latitude (°N)');grid on; box on;set(gca,'linewidth',5,'fontsize',15,'fontweight','bold','layer','top')However, I found that using m_map directly does not have this issue. But I remember there was a problem once before, but today it is fine. I will address it if it comes up again:
box = fancy
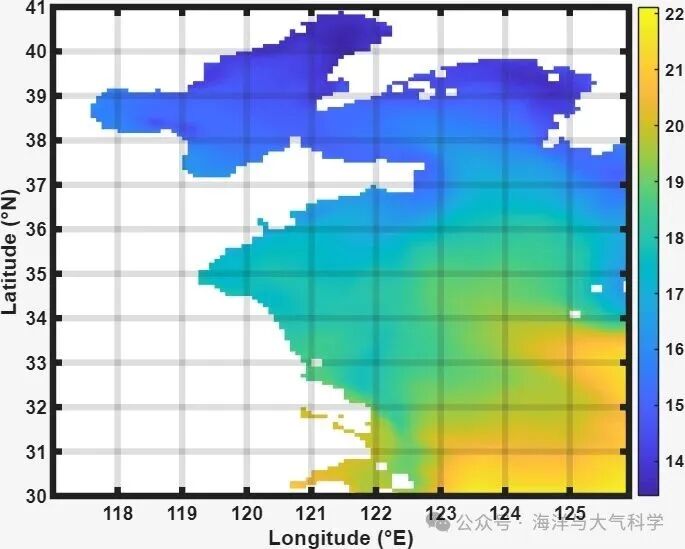
 box = on
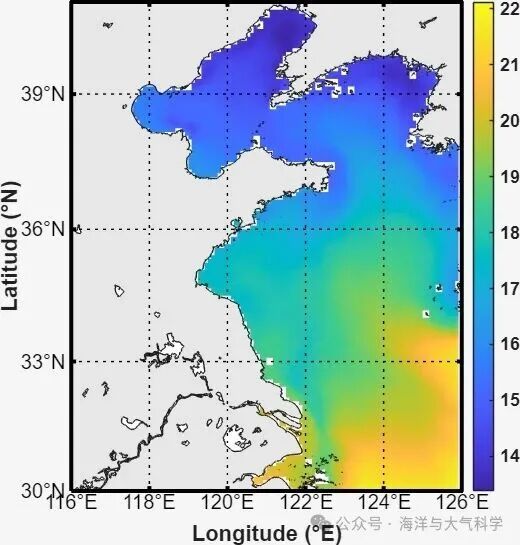
Full Code:
.rtcContent { padding: 30px; } .lineNode {font-size: 10pt; font-family: Menlo, Monaco, Consolas, "Courier New", monospace; font-style: normal; font-weight: normal; }clear; clc; close all;% Solution to the issue of MATLAB axis lines being coveredaddpath(genpath('D:\matlab_work\m_map\m_map'))%% === 1. Read Basic Information ===file = 'cmems_mod_glo_phy-thetao_anfc_0.083deg_P1M-m_1760937330475.nc';lon = double(ncread(file, 'longitude')); % 108x1lat = double(ncread(file, 'latitude')); % 133x1depth = double(ncread(file, 'depth')); % 21x1time = double(ncread(file, 'time')); % 40x1 (units: seconds since 1970-01-01)% Convert time to date time time_datetime = datetime(time, 'ConvertFrom', 'posixtime');thetao = ncread(file, 'thetao'); % [lon x lat x depth x time]theta_mean = mean(thetao, 4, 'omitnan'); % Three-year average [lon x lat x depth]%% === 5. Extract Longitude and Latitude Range (41N–30S, 117W–126E) ===lon(lon>180) = lon(lon>180)-360; % Convert to [-180,180]lon_mask = lon >= 116 & lon <= 126;lat_mask = lat >= 30 & lat <= 41;lon_sel = lon(lon_mask);lat_sel = lat(lat_mask);theta_sel = theta_mean(lon_mask, lat_mask, 1);[Lon, Lat] = meshgrid(lon_sel, lat_sel);%% Problem Plot Method 1: Normal Plot close allfigure('Position',[100 100 800 600])pcolor(Lon, Lat, theta_sel');shading interp; colorbar;colormap(jet);caxis([min(theta_sel(:),[],'omitnan'), max(theta_sel(:),[],'omitnan')]);xlabel('Longitude (°E)');ylabel('Latitude (°N)');grid on; box on;set(gca,'linewidth',4,'fontsize',15,'fontweight','bold')export_fig('pic13.jpg');%% Solution close allfigure('Position',[100 100 800 600])pcolor(Lon, Lat, theta_sel');shading interp; colorbar;colormap(jet);caxis([min(theta_sel(:),[],'omitnan'), max(theta_sel(:),[],'omitnan')]);xlabel('Longitude (°E)');ylabel('Latitude (°N)');grid on; box on;set(gca,'linewidth',5,'fontsize',15,'fontweight','bold','layer','top')export_fig('pic25.jpg');%% Marine Chart Method 1 close allfigure('Position',[100 100 800 600])m_proj('miller','lon',[116 126],'lat',[30 41])m_pcolor(Lon, Lat, theta_sel');shading interp; colorbar;colormap(jet);caxis([min(theta_sel(:),[],'omitnan'), max(theta_sel(:),[],'omitnan')]);xlabel('Longitude (°E)');ylabel('Latitude (°N)');m_gshhs_f('patch',[0.9 0.9 0.9])m_grid('xtick',5,'ytick',5,'box','on','linewidth',3,'fontsize',15,'fontweight','bold');grid on; box on;set(gca,'linewidth',2,'fontsize',15,'fontweight','bold')export_fig('pic1_mrpo.jpg');%% Marine Chart Method 2 close allfigure('Position',[100 100 800 600])m_proj('miller','lon',[116 126],'lat',[30 41])m_pcolor(Lon, Lat, theta_sel');shading interp; colorbar;colormap(jet);caxis([min(theta_sel(:),[],'omitnan'), max(theta_sel(:),[],'omitnan')]);grid on; box on;m_gshhs_f('patch',[0.9 0.9 0.9]);m_grid('xtick',5,'ytick',5,'box','fancy','linewidth',3,'fontsize',15,'fontweight','bold');export_fig('pic1_mrpo2.jpg');