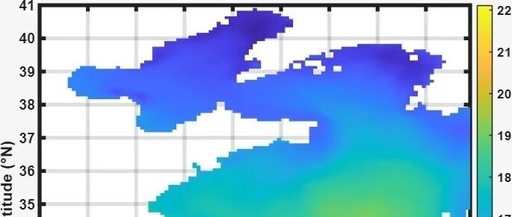
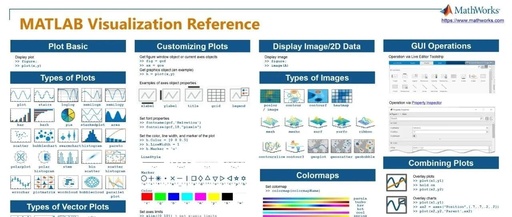
Graphviz: A Python Library for Graph Visualization!

Graphviz: A Python Library for Graph Visualization!

▼ Click the card below to follow me ▲ Click the card above to follow me Graphviz: Create Fancy Relationship Diagrams with Python! There are many amazing visualization tools in the Python world, and today I want to introduce a super cool library – Graphviz. Imagine being able to quickly draw complex network diagrams, flowcharts, … Read more

How to Draw Various Famous Mathematical Patterns with Python | Includes Images and Code

How to Draw Various Famous Mathematical Patterns with Python | Includes Images and Code

This article is reprinted with permission from the WeChat public account “Big Data Digest | bigdatadigest” Compiled by: Aileen, Xu Lingxiao Using Python to draw famous mathematical images or animations, showcasing the charm of algorithms in mathematics. Mandelbrot Set Code: 46 lines (34 sloc) 1.01 KB ”’ A fast Mandelbrot set wallpaper renderer reddit discussion: … Read more

FreeMaster – A Powerful Debugging Tool for MCUs

FreeMaster - A Powerful Debugging Tool for MCUs

What is FreeMaster FreeMaster is a data visualization debugging software developed by NXP, provided free of charge to users. Its main function is to provide a data visualization interface on a PC, displaying data variables from the MCU through communication interfaces such as SWD, UART, and CAN. When using the J-Link debugging tool for connection, … Read more

Exploring the Application of Matlab in A Level Mathematics Teaching

Exploring the Application of Matlab in A Level Mathematics Teaching

Author Chen Junming Mathematics Teacher at Jiangsu Taizhou High School, Cambridge International A Level Using graphics in A Level Mathematics teaching holds significant importance. As A Level Mathematics teaching progresses, teachers find it challenging to draw, prove, and solve complex graphics or teaching tasks quickly using chalk on the blackboard. The traditional teaching methods have … Read more

Getting Started with Matlab: Are My Plots Still Ugly?

Getting Started with Matlab: Are My Plots Still Ugly?

Below we present some function curves or surface plots drawn using Matlab. Since the public account cannot process EPS images, the images we screenshot are all bitmap, so you will see the ‘jagged edges’. To appreciate high-quality images with smooth edges and no jaggedness when zoomed in, please click on “Read the Original (Extraction Code: … Read more

Matlab Introduction Tutorial | 008 2D Plotting: Understanding Plot Usage

Matlab Introduction Tutorial | 008 2D Plotting: Understanding Plot Usage

Author: Daniel Date: 2020/8/24 Problem-oriented, starting from scratch, quick start, efficient learning, and mastering Matlab programming. 2D plotting is the foundation for all other types of plotting. We will introduce the details of 2D plotting in three articles! Key Points of This Article Vectors and Matrices Array Operations Three Steps of Plotting Mechanism of Matlab … Read more

Quick Start Guide to MATLAB (Plotting)

Quick Start Guide to MATLAB (Plotting)

Graphing Basics 1. Basic XY Plane Plotting Commands MATLAB is not only skilled in matrix-related numerical computations but is also suitable for various scientific visualizations. This section will introduce the basic plotting commands in MATLAB for the XY plane and XYZ space, including the plotting, printing, and saving of one-dimensional curves and two-dimensional surfaces. The … Read more

Essential Matlab Plotting Functions You Should Know

Essential Matlab Plotting Functions You Should Know

How Many Plotting Functions Do You Know? As we all know, MATLAB is not only good at handling numerical calculations related to matrices, but it also has a deep foundation in scientific visualization. The numerous rich functions it provides can well meet our various needs for using graphics to display numerical information. MATLAB has the … Read more

Introduction to Matlab Functions

Introduction to Matlab Functions

Click the blue text / Follow us 1. Introduction to Matlab Matlab, short for matrix laboratory, is a high-tech computing environment primarily aimed at scientific computing, visualization, and interactive program design. It integrates powerful functions such as numerical analysis, matrix computation, scientific data visualization, and modeling and simulation of nonlinear dynamic systems into an easy-to-use … Read more