Today, I happened to see on the news that a professor at a university in Jiangsu was found to have fabricated his credentials, claiming to have only a high school diploma. I can hardly believe that such an incredible thing can still happen in today’s internet age. How can a mentor guide students in their theses, how can they give presentations? How did they even get hired by a university? Emmm, shocking!!!
figure(‘Position’, [100, 100, 1000, 600]);
% Data Preparation
x = linspace(-5, 5, 50);
y = linspace(-5, 5, 50);
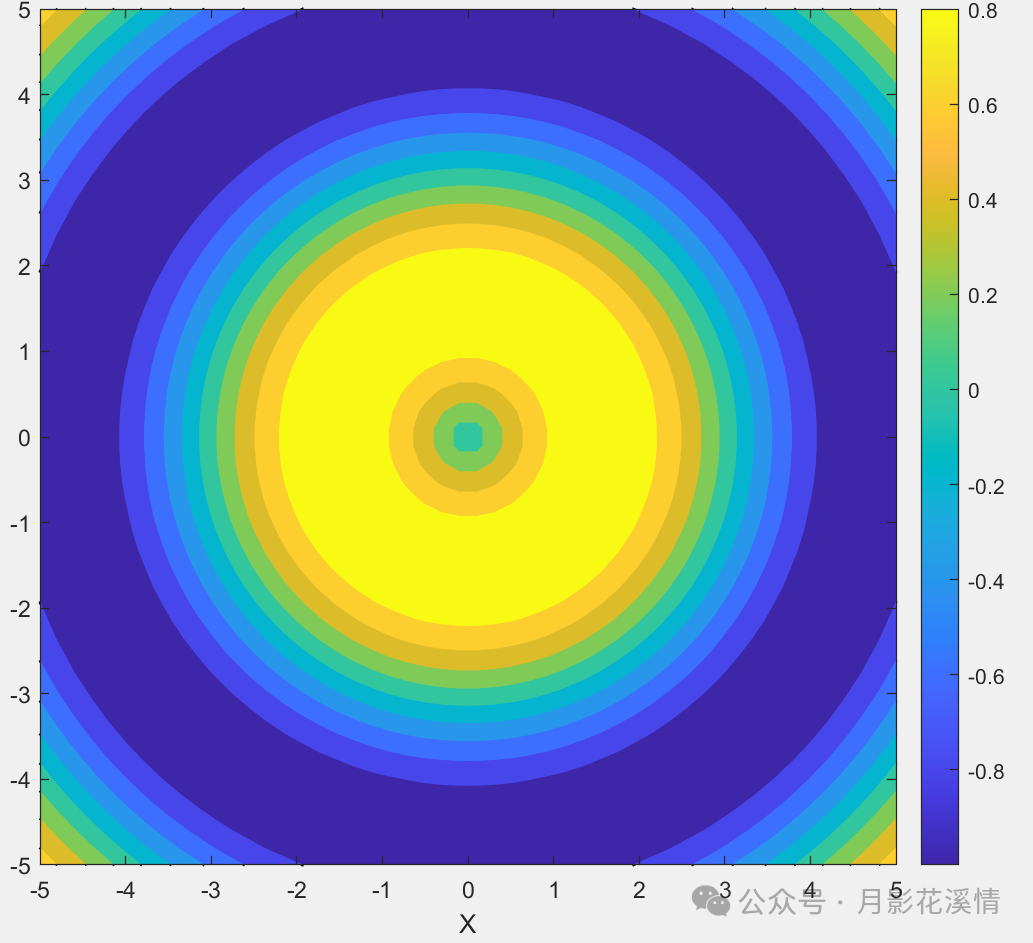
[X, Y] = meshgrid(x, y);
Z = sin(sqrt(X.^2 + Y.^2));
% Create Contour Plot
contour(X, Y, Z, ‘LineWidth’, 1.5, ‘LineColor’, ‘k’);
hold on;
contourf(X, Y, Z, ‘EdgeColor’, ‘none’); % Fill color areas
colormap parula;
colorbar; % Display color bar
% Adjust Layout
axis equal; % Maintain aspect ratio
xlabel(‘X’);
ylabel(‘Y’);
hold off;
The result is as follows: