Most of my categories are recorded while I learn, so they tend to be more like notes and somewhat rough.

01
—
Theoretical Three Steps of Analysis Report
Step One: Identify Our Business Needs
As a job seeker, it is important to understand the market situation for Python, such as: application fields (software development, scientific computing, artificial intelligence, machine learning, etc.), recruitment needs, and related positions.
Which industries are better, the learning and salary requirements, salary levels, company sizes, and the distribution of salaries and cities.
Step Two: Determine the Fields Needed for Each Requirement
Metrics: Industry of the company, number of records, educational requirements, salary, average salary, company size, latitude and longitude of the city.
Step Three: Determine Which Charts to Use
Group tables, pie charts, stacked charts, maps.
02
—
Practical Application
[Data Processing] For example, splitting salary into rows and columns, and converting text format to numbers.
① Determine if the data is clear (split fields, add, delete, hide).
② Handle missing values (missing values do not affect, filter, fill).
③ Remove outliers (for numerical fields, check for any that do not conform to reality, data cannot be less than 0, etc.).
④ Remove duplicate values.
⑤ Convert data types.
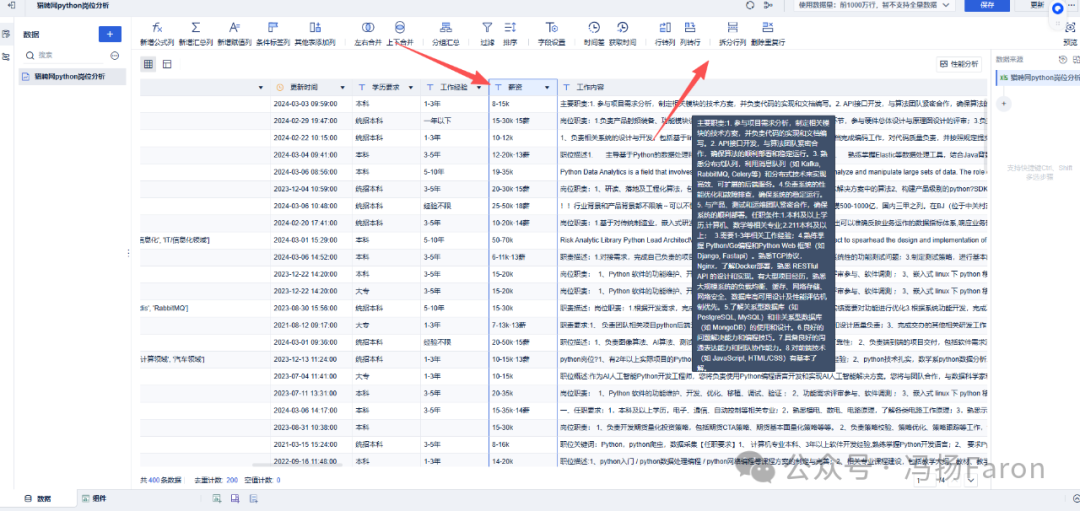
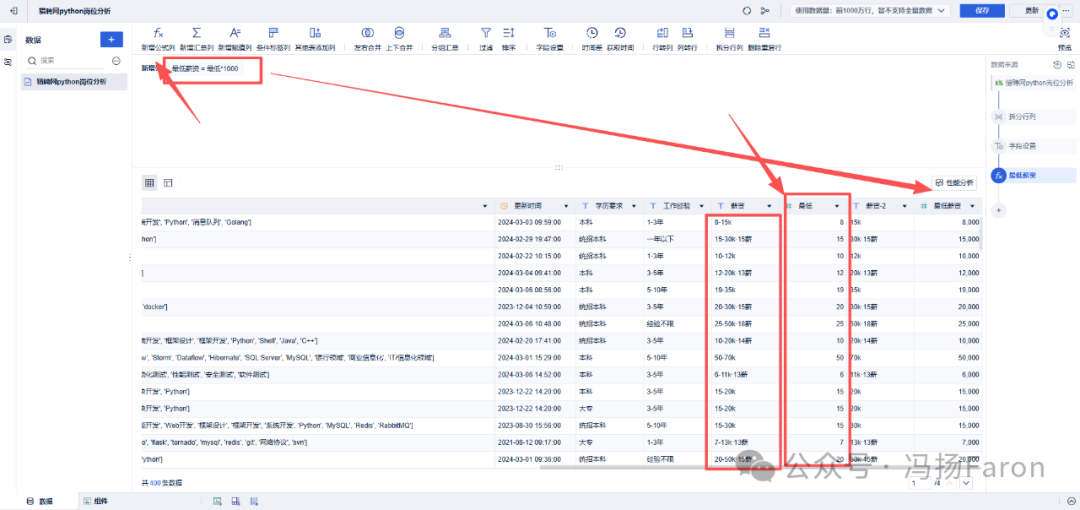
[Handling Minimum Salary] As shown in the figure, first split the salary, extract the minimum column and convert it to a number, then add a formula column to calculate minimum * 1000 to get the minimum salary.
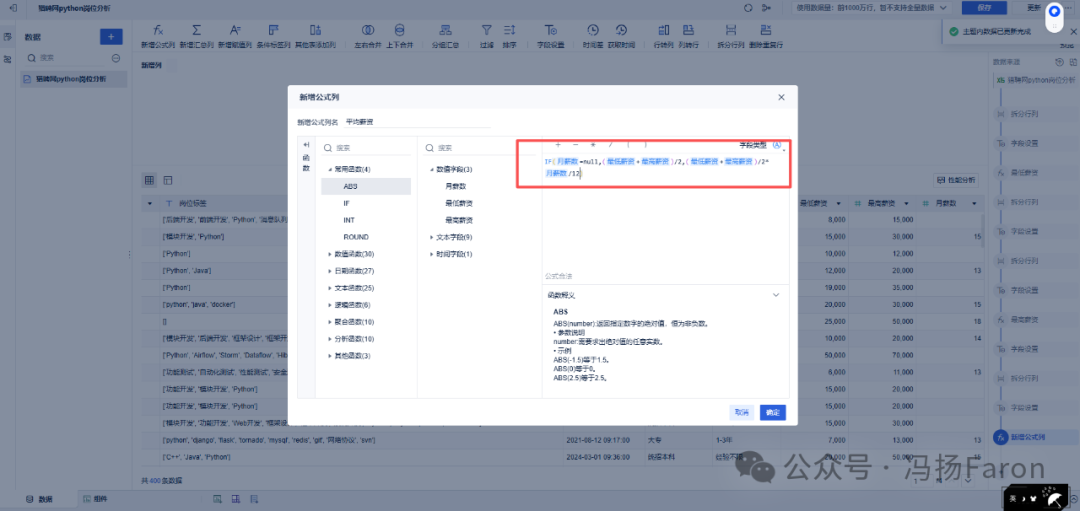
[Average Salary Function] Calculate the average monthly salary for each company based on the situation, the formula can be referenced below.
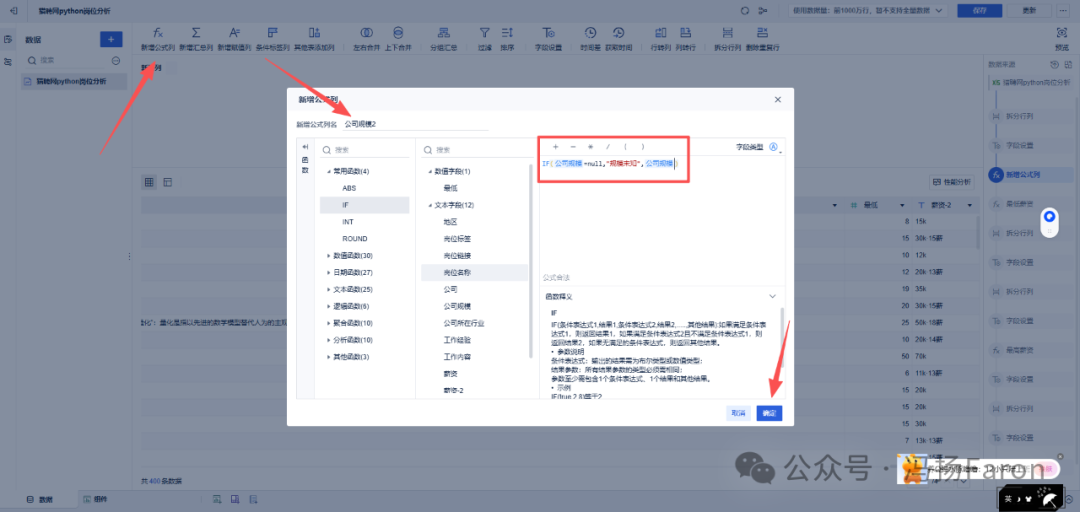
[Handling Company Size Field] The company size has blank fields, so we create a new column to fill in the blank fields.
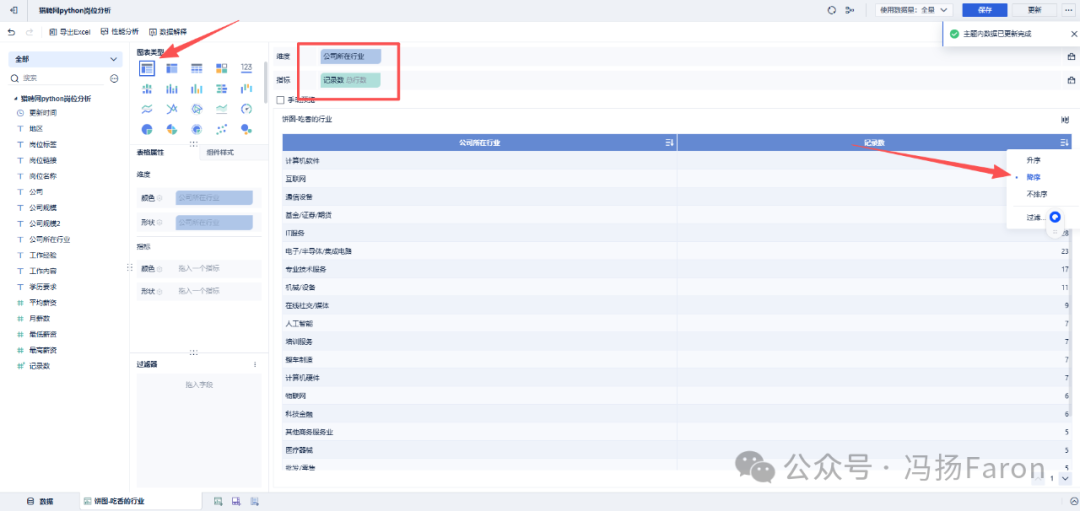
[Which Industries Are Better] Drag the metrics into the group chart to observe the data; the group chart can be converted to other types of charts at any time.
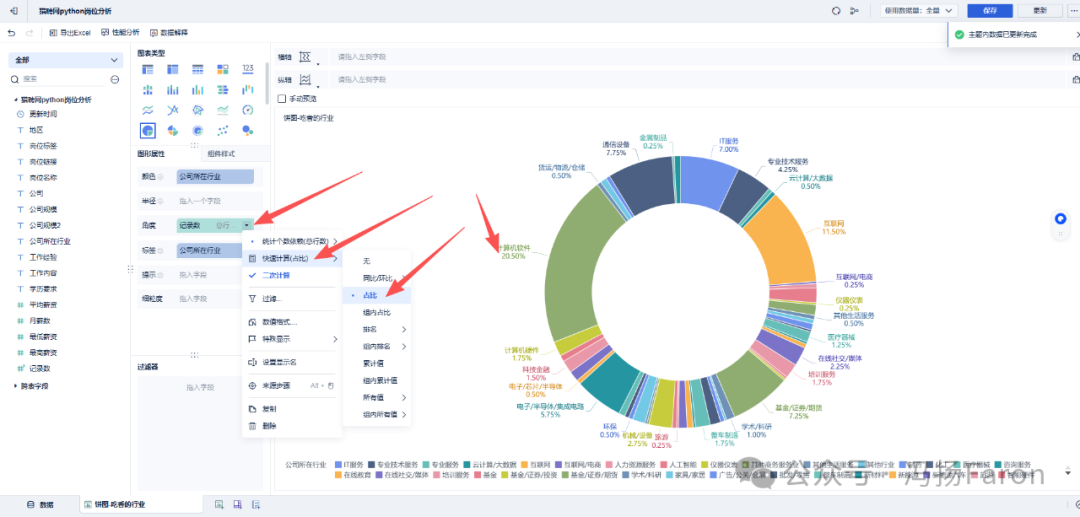
[Convert to Pie Chart] Directly click the pie chart icon, then click on the number of records for quick calculation to convert the values into proportions.
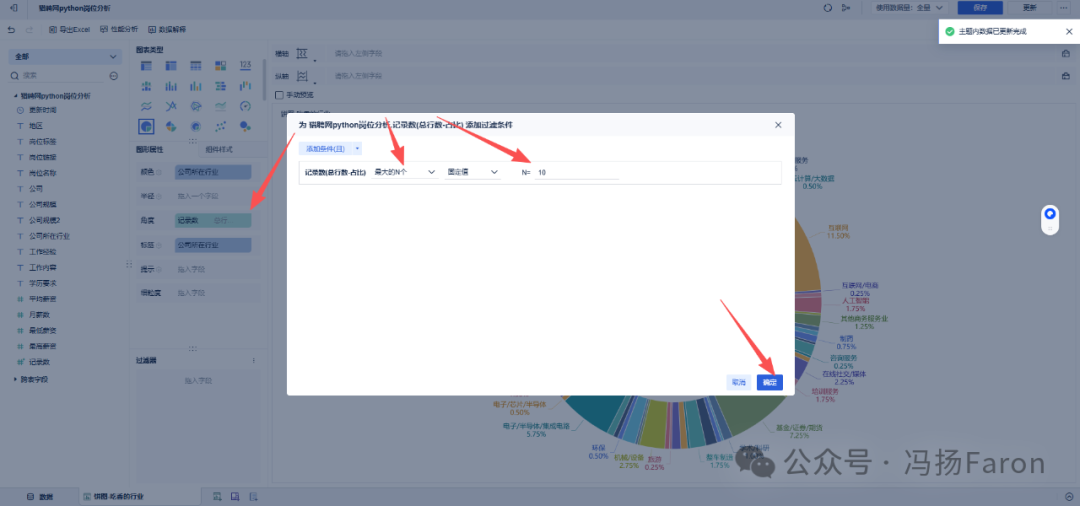
[Filter TOP 10 Industries] Filter the top 10 industries by the number of companies; the filtering function in Fine BI is called filtering.
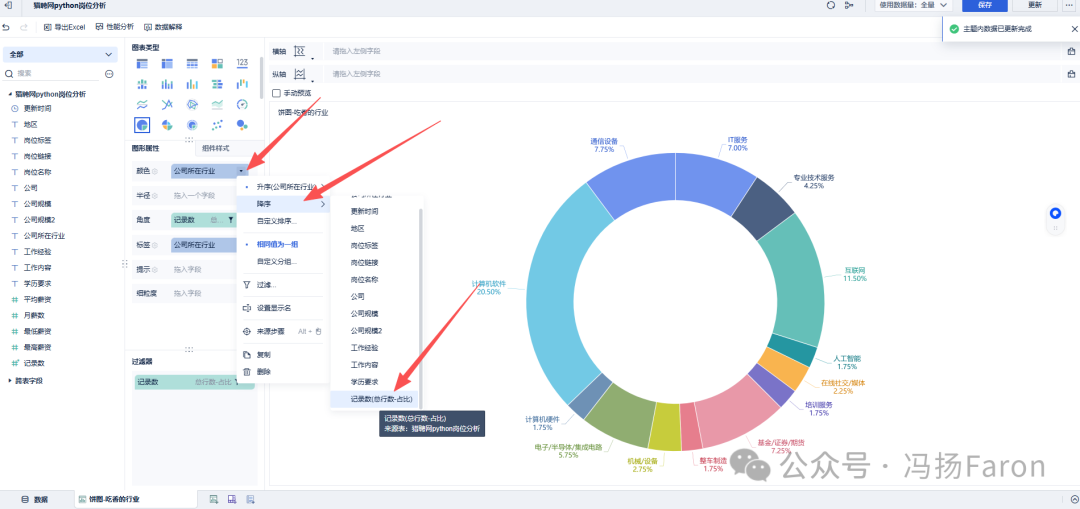
[Sort Text Fields] Sort the industries by the number of companies in descending order.
*It can be seen that the top 10 industries by number of companies are dominated by the computer software industry, accounting for 20%.
[Stacked Chart] Click on the stacked chart and drag in the fields.
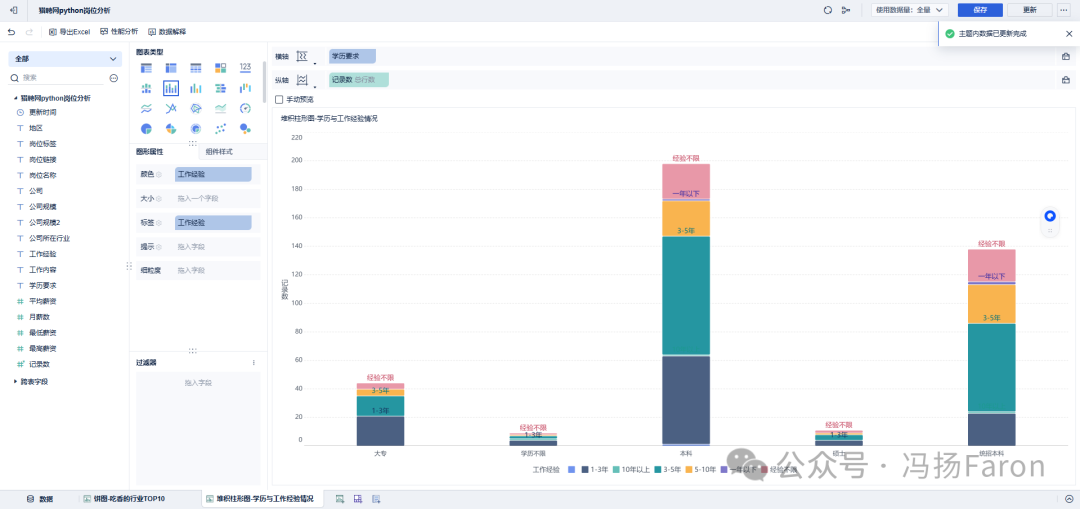
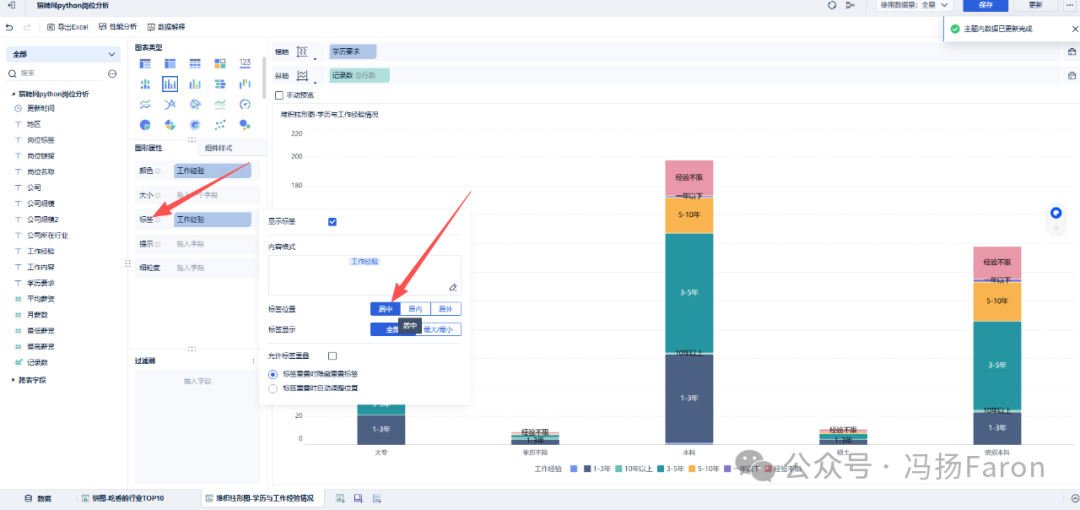
[Center Labels] Find the labels and adjust them to be centered.
*We can see that the higher the education level, the lower the experience requirements. Therefore, education is the key to entering the industry; without a degree, one must have work experience and project experience.
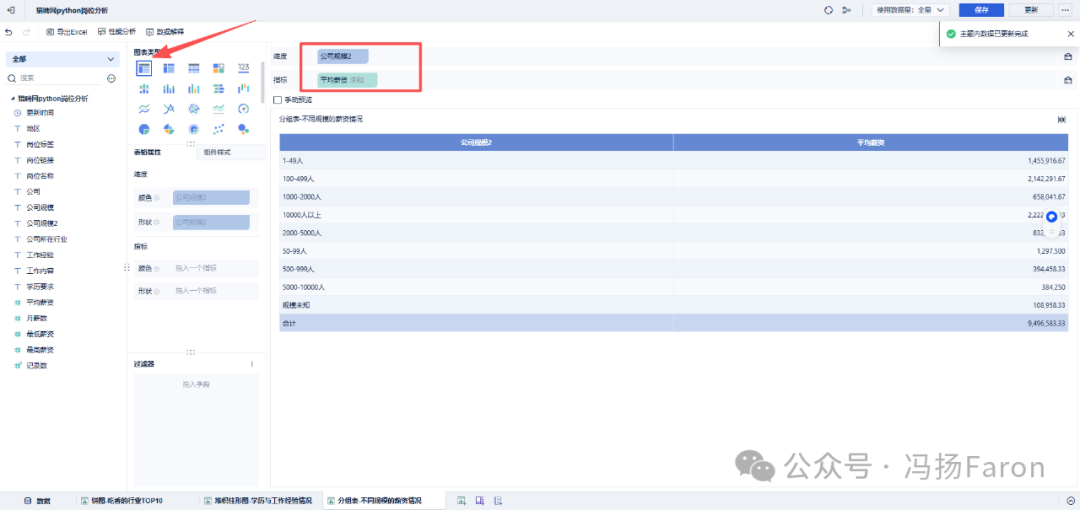
[View Size and Salary] Drag fields into the group table to view.
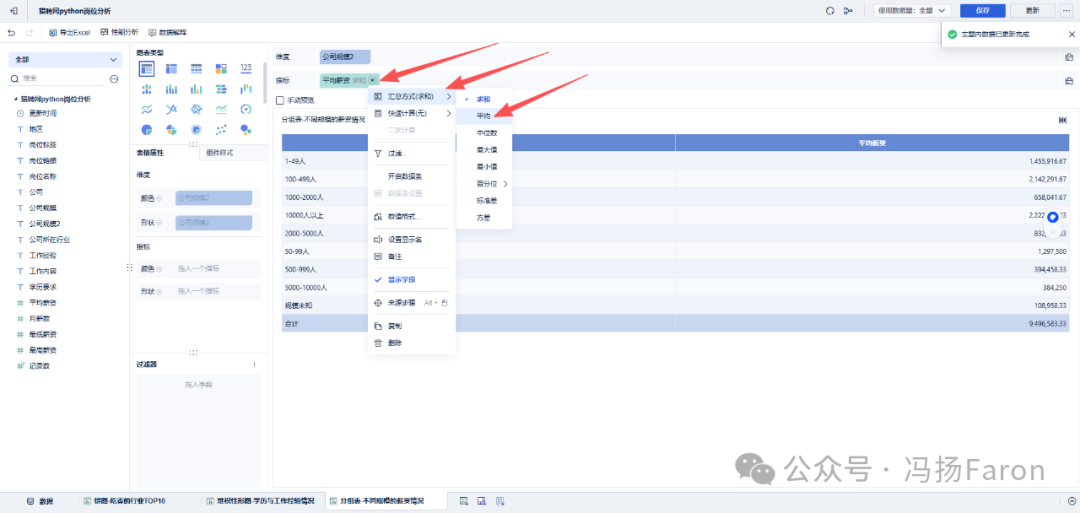
[Adjust Average Salary Summary Method] Change the summary method of average salary from sum to average to display the average salary.
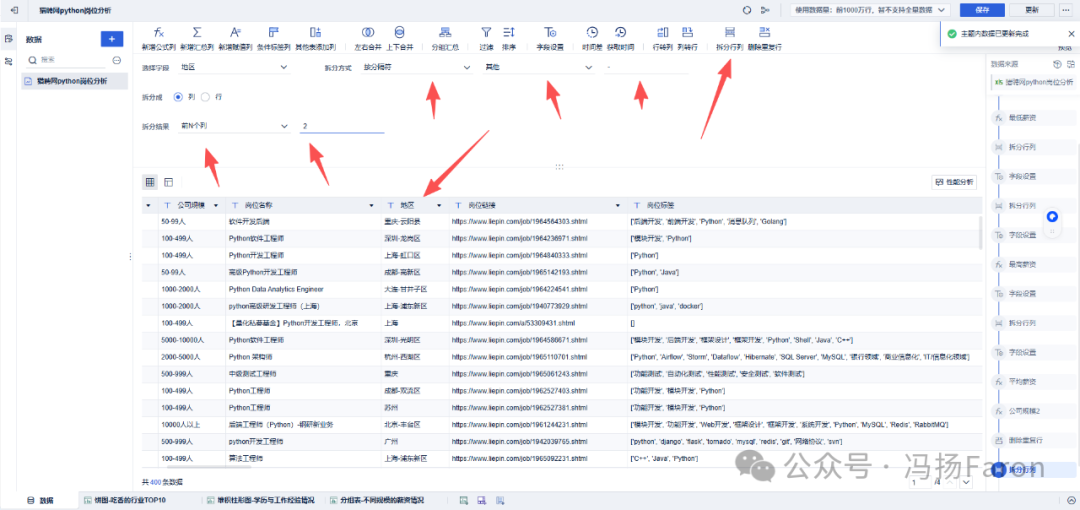
[Clean Region Field] During analysis, it was found that the fields were insufficient, so we continue to clean the data, splitting the region field to extract the city.
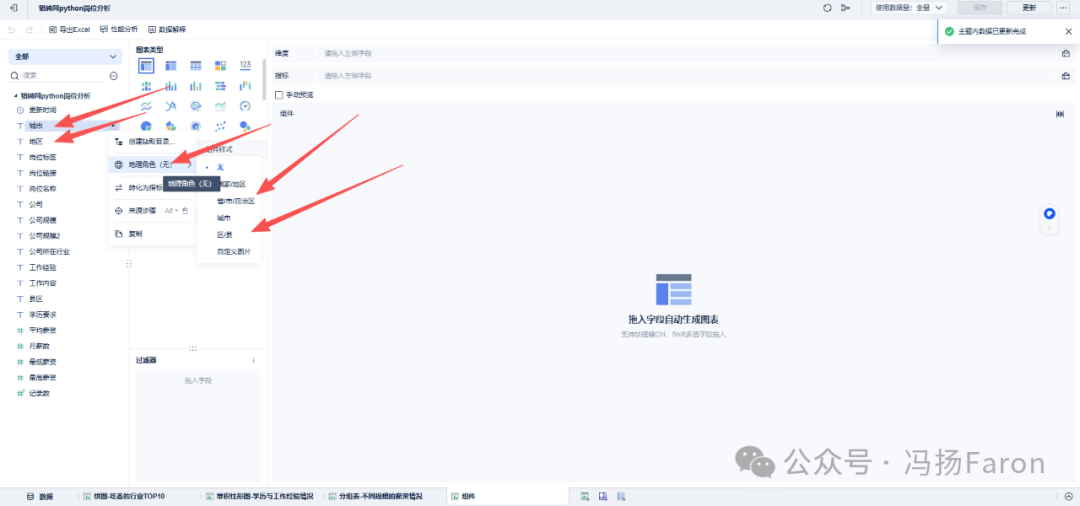
[Create Geographic Role] For the region field, convert it to a geographic role to create maps.
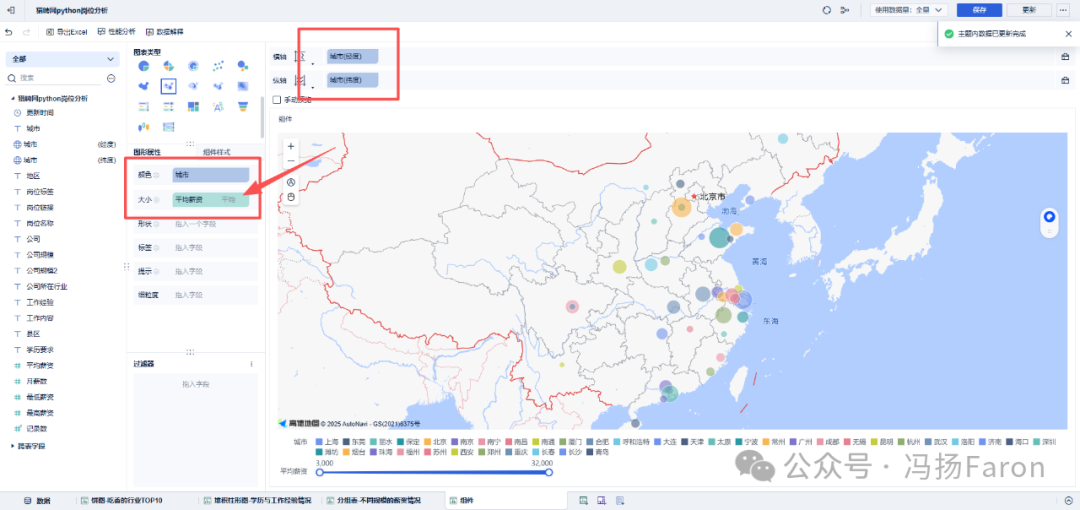
[Create Map] Click the map icon, then drag in the geographic role, and also drag in the city and average salary fields, remembering to convert the average salary field to average summary.
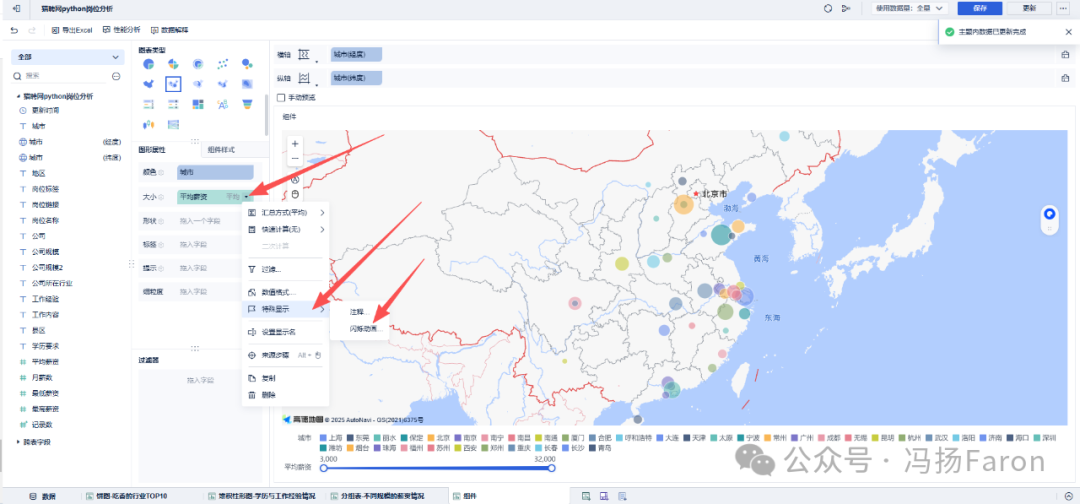
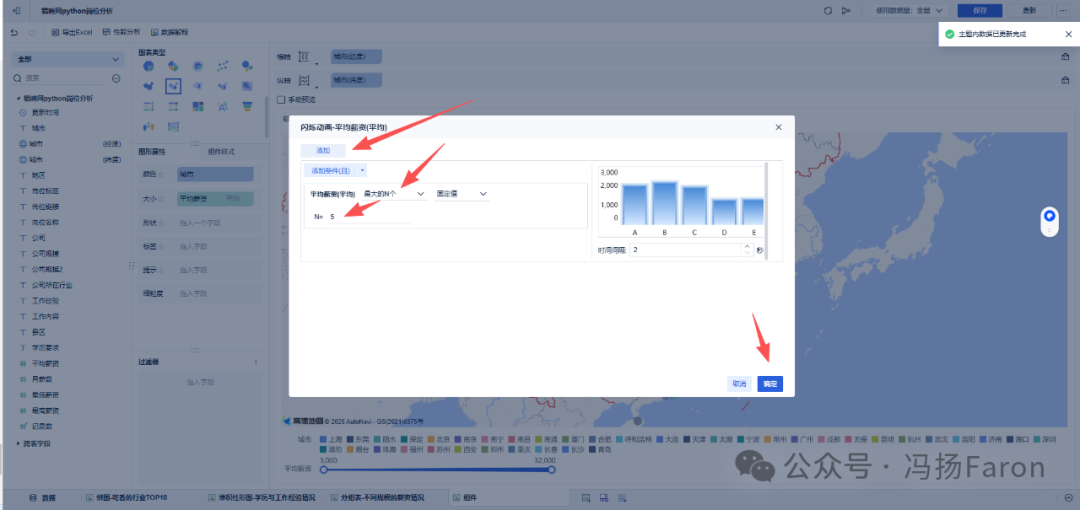
[Blink Animation] Apply special display to data fields by selecting blink animation.
[Top 5 Blink] Add conditions to only blink the top 5 for emphasis.
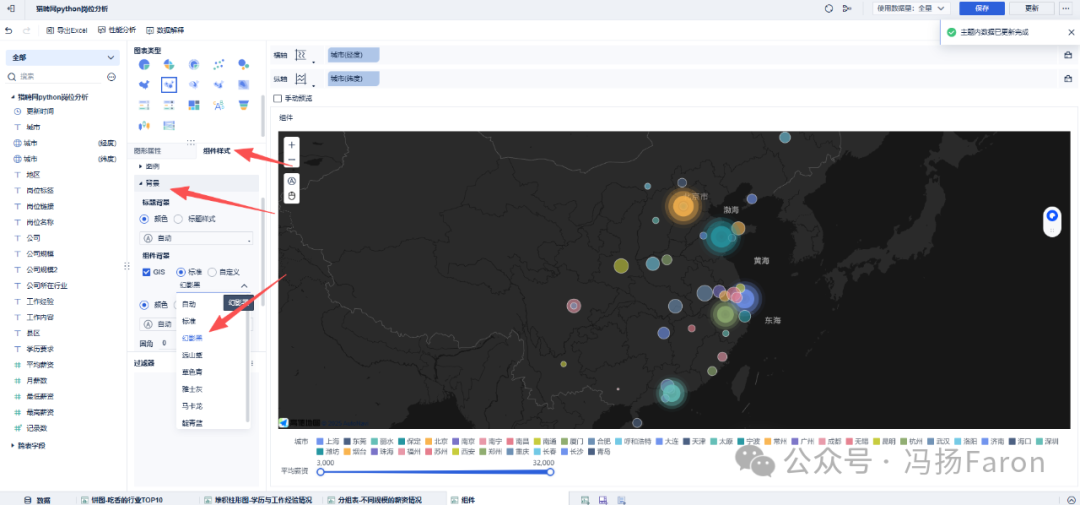
[Adjust Background] In the component style, adjust the background to phantom black to highlight colors.
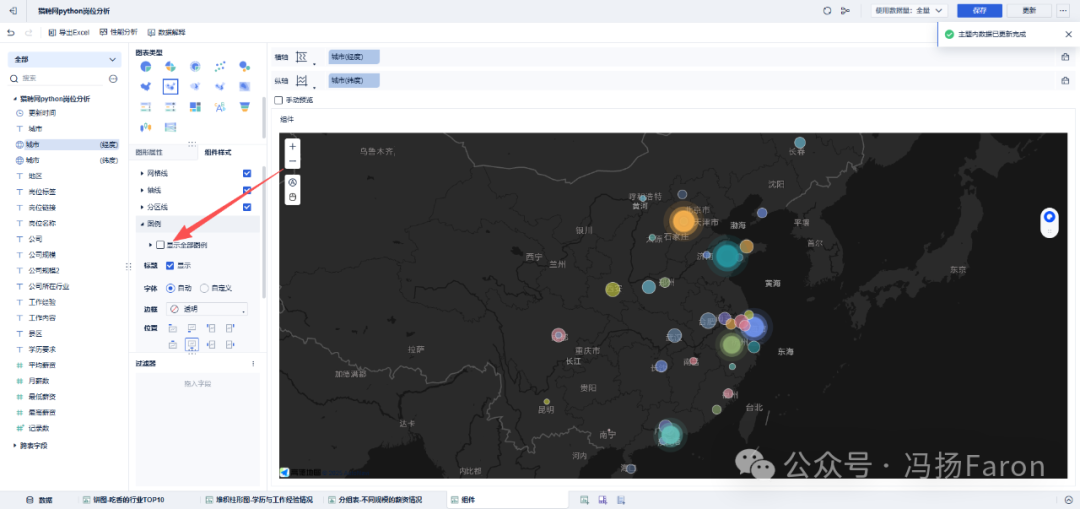
[Remove Legend] In the component style, uncheck the legend option.
*Thus, we can conclude that the salaries for Python positions in regions such as Beijing, Shanghai, Hangzhou, and Shenzhen are relatively high.
Original Author | Faron Feng

Previous Issues Review
E-commerce Operations _ Investment Strategies
E-commerce Operations _ Basic Capabilities in Operations and Promotion
Data Thinking _ Insight – Action
EXCEL Basic Functions _ Pivot Tables
END