Solution to the Issue of MATLAB Axis Lines Being Covered by pcolor
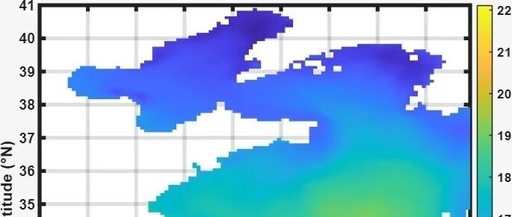
Solution to the Issue of MATLAB Axis Lines Being Covered by pcolor Coverage Situation: The plot without using m_map is as follows: .rtcContent { padding: 30px; } .lineNode {font-size: 10pt; font-family: Menlo, Monaco, Consolas, "Courier New", monospace; font-style: normal; font-weight: normal; }close allfigure('Position',[100 100 800 600])pcolor(Lon, Lat, theta_sel');shading interp; colorbar;colormap(jet);caxis([min(theta_sel(:),[],'omitnan'), max(theta_sel(:),[],'omitnan')]);xlabel('Longitude (°E)');ylabel('Latitude (°N)');grid on; box … Read more