Good article to read:
Abstract:
In the past decade, antibody-drug conjugates (ADCs) have sparked a new wave of development in the biopharmaceutical market due to their high efficacy in cancer treatment. As of now, the U.S. Food and Drug Administration (FDA) has approved 13 types of ADCs for clinical treatment. The development of ADCs relies on analytical tools to comprehensively characterize ADCs, from their biochemical properties (such as drug-to-antibody ratio and conjugation sites) to in vivo pharmacokinetics. This review will outline the characterization of ADCs from in vitro testing to in vivo pharmacokinetics. Recent advances in analytical techniques help us better understand and optimize the quality, safety, and efficacy of ADCs. The advantages and limitations of these methods will be described, and the challenges and potential opportunities facing the characterization of ADCs in the future will be discussed. This review will provide insights into the development of analytical methods for ADCs, thereby promoting the research and development of ADC drugs.
Continuing from the previous article……
[NO.2]In Vitro Analysis
2.3. Stability Characterization of ADCs
2.3.1. Raman Spectroscopy
Raman spectroscopy is a non-destructive, reagent-free technique. Each sample generates characteristic spectra due to active functional groups such as nucleic acids and proteins. In antibody research, Raman spectroscopy is used to study the aggregation and degradation of antibodies. For example, Zhang et al. studied the aggregation levels and particle formation of ADC samples and found that Raman spectroscopy combined with support vector machine regression could quickly and accurately predict the aggregation of ADCs. Notably, each measurement takes less than three minutes, including spectral acquisition and data analysis; this is much faster than high-performance size-exclusion chromatography (HP-SEC, approximately 20 minutes per sample). HP-SEC is widely used in the biopharmaceutical industry to monitor protein aggregation. The advantages of Raman spectroscopy in characterizing ADCs include no sample pre-treatment, simple operation, and short time consumption.
2.3.2. Differential Scanning Calorimetry (DSC) and Differential Scanning Fluorimetry (DSF)
DSC is a thermal analysis method. Under temperature-controlled programs, various thermodynamic and kinetic parameters can be measured by inputting the temperature relationship between the sample and the reference substance. DSC can directly record the thermal transition process of protein unfolding, and its characteristic curve is regarded as a biophysical indicator of proteins, often used to represent the thermal stability of ADCs, guiding further optimization of linkers, drugs, and conjugation strategies. For example, Gandhi et al. studied the stability of lysine-conjugated ADCs based on DSC. The results showed that the melting temperature (Tm) of the conjugated monoclonal antibody was lower than that of the naked monoclonal antibody, indicating that ADCs are more prone to aggregation. Furthermore, after conjugation, the CH2 domain of the antibody was found to be less stable than other regions. For the DM1 conjugated drug (MMAE), this result has been validated. The drug-to-antibody molar ratio (DAR) also increased, which directly affects the stability of ADCs. Adem and colleagues further studied the relationship between drug distribution and cysteine-conjugated ADC stability under forced degradation conditions. Consistent with the above studies, as DAR increased, Tm decreased, and the physical stability of ADCs also decreased. DSC requires only a small amount of sample for detection, no sample pre-treatment is needed, and it has reproducibility. Additionally, it takes less time.
DSF is a reliable tool for monitoring protein stability by slowly heating proteins within a controllable temperature range and measuring changes in fluorescence intensity and the protein’s Tm. Unlike requiring specialized equipment, DSF typically uses widely available real-time polymerase chain reaction (RT-PCR) equipment. Compared to DSC, DSF requires less protein and is suitable for high-throughput screening. In monoclonal antibodies, Fc glycosylation significantly contributes to antibody characteristics, including thermal stability. One study measured the thermal stability of glycoengineered antibodies and ADCs such as trastuzumab and rituximab through DSF and proposed new strategies for optimizing specific glycosylation sites in ADCs. Additionally, Buecheler et al. studied the oxidative stability of lysine or cysteine-linked ADCs. Cysteine-linked ADCs are most affected by oxidation, as their CH2 domains become unstable after conjugation compared to naked monoclonal antibodies and lysine-linked ADCs
2.4. Protein Structure Characterization
Hydrogen/deuterium exchange mass spectrometry (HDX-MS) is a powerful analytical tool for studying protein conformation and dynamics in solution. Its basic principle is that in proteins exposed to D2O, hydrogen atoms in amides are replaced by deuterium, leading to a lack of stable hydrogen bonds in the amides. Proteases then cleave the protein into small peptide segments, and mass spectrometry can identify each peptide segment and predict its conformation.HDX-MS has the outstanding advantage of versatility, allowing direct exploration of many systems, including dynamic proteins, biomolecular complexes, etc. It can provide a dynamic picture of protein function.HDX-MS has been used to characterize the higher-order structure of ADC drugs, such as chemical modifications and post-translational modifications of various monoclonal antibodies, as well as studying the aggregation mechanisms of monoclonal antibodies.
Pang and colleagues used hydrogen-deuterium exchange mass spectrometry (HDX-MS) to compare cysteine-conjugated antibody-drug conjugates (ADCs) with naked antibodies. They evaluated the kinetics of ADCs conjugated with either methyl auristatin E (vcMMAE) or methyl auristatin F (mcMMAF) at seven time points from 0.5 min to 22 h. The results indicated that ADCs and antibodies have very similar conformations in 90% of their amino acid sequences. Using HDX-MS with different spatial resolutions, they analyzed the conformational dynamics of linker proteins (a small therapeutic protein) and linker-drug conjugates, indicating no conformational changes between conjugated and unconjugated linker proteins. Recently, another study provided a detailed structural dynamics basis for the functional combination of ADCs with Fc receptors.
The above reports highlight how HDX-MS can become a relatively rapid method for the structural and protein dynamics characterization of ADCs and can be used to select specific conjugation sites, thereby guiding the drug development of ADCs.
[NO.3] Monitoring of ADCs in Cells
After injecting ADCs into live blood, we need to understand their behavior and fate in vivo to guide the optimization and development of ADCs. Traditional chromatographic and mass spectrometric methods can only detect the pharmacokinetics of ADCs, lacking information at the tissue and cellular levels, as well as the mechanisms of cytotoxicity induced by ADCs. Therefore, several bioanalytical methods have emerged in recent years aimed at providing and accurately describing the biological distribution changes of ADCs and quantitative data on drug accumulation within target tissues.
Using radioactive isotopes or fluorescent dyes to label antibodies and/or drugs, the biological distribution and tissue uptake of labeled ADCs can be detected through non-invasive in vivo imaging methods, such as positron emission tomography (PET) or liquid scintillation counting (LSC), or detected through ex vivo imaging after animal sacrifice. Similar to other therapies, understanding the fate of ADCs in vivo aids in drug development and optimization.
3.1. Near-Infrared Fluorescence Ratio Technology
To track and understand the metabolism of ADCs at the single-cell level, Cyril et al. reported near-infrared (NIR) fluorescence ratio technology and achieved visualization of trastuzumab and trastuzumab-maytansine conjugate (T-DM1). IRDye800CWN-hydroxysuccinimide (IRDye) and CellTrace far-red DDAO-SE(DDAO) were conjugated with antibodies. After binding to cell surface receptors, the ADCs are internalized and then degraded. The low molecular weight lipophilic DDAO diffuses out of the cell, while IRDye is trapped inside the cell. By measuring the fluorescence intensity absorption values and plotting the ratio of DDAO/IRDye, the amount of ADCs entering the cell can be quantified at the single-cell level.[Figure 6C]. By applying this technology to T-DM1 therapy, the authors demonstrated that the distribution of ADCs in tumors correlates with their efficacy, regardless of the type of payload delivered to the tumor.
3.2. “Clickable” ADCs
To dynamically study the interaction of ADCs with cells, strategies for labeling conjugates with fluorescent groups have been developed. However, such labeling may alter the behavior of ADCs. To overcome this drawback, researchers designed a “clickable” fluorescent labeling method that reacts azide-functionalized linkers with alkyne fluorophores, as incorporating azides into the linker region may minimize the impact on drug behavior. Kourkoutis et al. designed PFP-azide-lysine-thiopropionic acid LP, conjugated it with mutant trastuzumab, and then labeled it with maleimide-AlexaFluor488 (AF488) to prepare a clickable ADC[Figure 6B]. Additionally, part of the ADCs reacted with BCN-PEG-tetramethylrhodamine (TAMRA) to generate pre-clicked ADCs. The clickable ADCs can be fluorescently labeled before the antibody enters the cell; this is referred to as pre-clicked ADCs, while clickable ADCs are fluorescently labeled after the antibody enters the cell. Kourkoutis and colleagues further studied the biological activity of pre-clicked ADCs and clickable ADCs, and the results indicated that clickable ADCs exhibited excellent potency in cells expressing HER2, while pre-clicked ADCs lost activity by 200-fold. Time-course studies on SKOV3 cells indicated that the different activities between pre-clicked ADCs and clickable ADCs may be due to the released fluorophore label from pre-clicked ADCs inhibiting the uptake of amino acid transporters in the lysosomal membrane.
3.3. Fluorescence Resonance Energy Transfer (FRET)
Fluorescent labeling has become a common imaging technique, but it cannot effectively track the fate of the payload since the payload is unlabeled. Lee and colleagues used PC3 and SK-BR-3 human cancer cell lines targeting two growth factors, namely thyroid-stimulating hormone-releasing protein (TR) and HER2, to explore the processing and uptake mechanisms of ADCs. By adding a FRET reporter group to the linker of ADCs, the authors were able to track the linker and cellular uptake, and visualize the release of the payload and antibody distribution. They confirmed that adding FRET components did not alter the ability of the drug to kill cells. Their results indicated that the FRET-ADC technology is powerful, simple, and non-invasive. Therefore, it can serve as a tool to evaluate the internalization and processing of ADC drugs.
In general, compared to other fluorescent labeling methods, near-infrared fluorescence ratio technology provides an irreversible measurement method for measuring the delivery of effective payloads and intact proteins without larger dye-quenching conjugates or highly labeled substances. Additionally, the “clickable” ADCs demonstrate a fluorescent labeling method that does not alter the behavior of ADCs. Finally, FRET can visualize drug release and distribution. All these methods can visualize the interaction and distribution of ADCs with cells. These three techniques can provide visual monitoring of ADCs in cells.
[NO.4] In Vivo Analysis of ADCs
Visual assessment of cellular uptake of ADCs helps us determine the interaction of ADCs with cells and the efficiency of cellular utilization of ADCs. However, after human absorption of ADCs, we lack the ability to visually monitor their transport, metabolism, and excretion processes in real-time. For in vivo monitoring, the labels must have strong tissue penetration, be able to stably exist in tissues, and pose minimal harm to the human body. Therefore, to track therapeutic drugs and achieve in vivo visual monitoring, researchers have proposed several in vivo monitoring methods for ADCs.
4.1. Immunofluorescence
The immunofluorescence method is based on the antigen-antibody reaction, which can provide strong fluorescent imaging for specific molecular targets and some key organelles for visual localization. Researchers often wash, fix, and permeabilize cells to observe the transport of ADCs to lysosomes in tumor cells. By using confocal laser scanning microscopy to observe the co-localization of ADC drugs with lysosomes, the mechanisms of action of ADC drugs in cells can be understood. Additionally, isotype controls of ADC drugs and non-target cells can also serve as references to observe the targeting specificity of ADC drugs. This technique can be applied to tissues and cells.Szot et al. performed co-immunofluorescence staining to monitor the behavior of the drug after intravenous injection of ADCs in mice implanted with HT29 tumors. As shown in Figure 7A, after staining with Texas Red-labeled anti-human secondary antibody, the ADC drug (red) was observed in the tissues. The target gene was detected by staining with its monoclonal antibody (green). Co-localization of ADC drugs with the target gene was also shown (yellow)..Li et al. observed the single-cell situation of the process of ADCs entering lysosomes and co-localization with the lysosomal marker protein LAMP-1. As shown in Figure 7B, after incubating with the ADC drug (red) for 0, 4, and 24 hours, the gradual display of lysosomes (green) was shown. The co-localization signal merged to yellow. The immunofluorescence method is free from radioactive contamination and is easy to operate. However, there are also some drawbacks. For example, the fluorescence intensity observed under the microscope can be affected by the fluorescence imaging conditions, and the same slice may show different fluorescence intensities under different brands of microscopes. Secondly, fluorescence decay is very significant. Finally, due to the numerous variables present during the staining process, there are some limitations in quantification.
Figure 6.(A) The principle of detecting ADCs using near-infrared fluorescence ratio technology. The green circle represents the weakly lipophilic DDAO, and the yellow circle represents the strongly lipophilic IRDye. Quantification of single-cell uptake of ADCs through intracellular and extracellular imaging. (B) The principle of detection for ADC drugs using the “clickable” fluorescent labeling method. The gray circle is the azide-treated linker region; the red circle is the fluorescent label.ADCs can be fluorescently labeled before entering the cell (“pre-clicked ADC”) or after (“clickable ADC”). (C) Confocal images of labeled T-DM1. DDAO (red) shows a loss of signal over time with surface labeling of cells. IRDye (green) shows punctate spots trapped in lysosomes when labeled at the cell surface. Scale bar: 10µm..(D) Confocal images of SKOV3 cells treated with clickable ADC (left image) or labeled ADC (right image) through live-cell imaging after treatment with ADCs for 30 minutes, 4 hours, or 24 hours. Monoclonal antibodies were labeled with green AF488; for “labeled ADC”, the payload was labeled with red TAMRA.
4.2. Zirconium Immuno-PET
Positron emission tomography (PET) is commonly based on its detection of gamma pairs for non-invasive imaging. Immuno-PET is a combination of traditional PET technology with antibody-based radioactive tracers for imaging tumors based on antigen-antibody binding. This technology provides a biomarker to verify the targeted delivery of antibodies to tumors. Immuno-PET helps analyze the efficacy of ADC treatment through visual studies of various cancers and improves precision treatment for cancer patients. Radioactively labeled ADC monoclonal antibodies, such as copper-64 (64Cu), yttrium-86 (86Y), and zirconium-89 (89Zr), can achieve visualization of ADCs in vivo.
Among them, 89 Zr is the most widely used. It has a relatively long half-life of 3.3 days, allowing visualization of tumors even 7 days after injection. Additionally, 89Zr can be cleared. 89Zr-immuno-PET is produced by chelators such as desferrioxamine, forming stable complexes that bind to monoclonal antibodies. 89Zr-immuno-PET can be used to measure the effects of targeted drugs on tumors, predicting toxicity and efficacy through biodistribution, pharmacokinetics, and targeting tumors with ADCs, and can also be used to screen cancer patients who may benefit from ADC treatment.
Lambert et al. conducted the first human study using 89Zr-immuno-PET as a systemic biomarker to assess the relationship between the efficacy of ADCs and the emergence of metastatic lesions expressing mesothelin in ovarian and pancreatic cancer patients, and to determine potential tissue toxicity. As another example, Reyloff and colleagues used 89Zr-labeled anti-CD30 monoclonal antibodies to explore their potential in patient selection, treatment monitoring, and improving personalized therapy. In a recent publication, 89Zr-immuno-PET labeled prodrug conjugates CX-2009 and their parent derivatives were used to study targeted activity in a lung cancer xenograft mouse model.
Figure 7(A) The injection of isotopes into the HEK-293GCC2 tumor (top) and HEK-293 tumor (bottom) images. The 3H signal is red, and the 111In signal is green, with the two signals overlapping to yellow. After 24 hours, the HEK-293GCC2 shows that the drug has diffused from the antibody accumulation site into the tumor. (B) The principle of detecting ADC drugs using the dual dye ratio system. The yellow oval is the IRD dye, and the green oval is the mXCy fluorescent activator dye. When the yellow fluorescent-labeled ADC enters the cell, the linker breaks after internalization, separating the drug, and the remaining ADC portion shows red fluorescence. Therefore, drug release can be monitored by observing fluorescence. (C)(a) Time-dependent images of white light, XCy (near-infrared fluorescent activator dye), and IRD (near-infrared fluorescent dye) channels, as well as overlay images of mice given IRD-Ab-mXCy-CLB and control mice. (b) Fluorescent images of selected organs and tumors after 120 hours (left, control mice; right, treated mice). H, heart; S, spleen; L, liver; B, brain; K, kidney; T, tumor.
4.3. Cold Imaging Quantitative Radioautography (CIQA)
Although 89Zr-immuno-PET allows researchers to non-invasively assess tumor uptake, it cannot evaluate the distribution of ADCs within tumors. Radioautography has been used to assess the distribution of target proteins using radioactively labeled ligands to study drug metabolism dynamics (ADME) and changes in neurotransmitter receptors in brain tissues. Computer image quantitative analysis (CIQA) is an imaging method that can perform radiological analysis on slices of entire tissues to determine the distribution of radioactively labeled molecules within tissues. Labeling with isotopes of different half-lives can achieve dual-isotope imaging, which helps understand interactions between molecules. Ilovich and colleagues used dual-labeled ADCs and CIQA for three-dimensional modeling, independently tracking the distribution of ADCs in tumors. This technology opens a new door to understanding the relationship between ADC dosage and antigen expression for drug efficacy. They used indium-111 labeled monoclonal antibodies (mAbs) and tritiated monomethyl auristatin E (MMAE) to study the efficiency of ADCs in vivo in guanylate cyclase (GCC) positive and negative tumors. Their results indicated that the localization signal in GCC-positive tumors was stronger than that in GCC-negative tumors, demonstrating the presence of specific lytic toxins in GCC-positive tumors.[Figure 8A]
4.4. Dual Near-Infrared Dye Ratio System
It can be demonstrated that dual radioactive labeling can provide a comprehensive understanding of ADCs. Cohen et al. labeled microtubule-disrupting variants with 131I and trastuzumab with 89Zr to monitor the pharmacokinetics of ADCs. Additionally, Muns et al. used 195mPt labeled metal-organic conjugates with 89Zr labeled monoclonal antibodies to study the targeting activity and stability of ADCs. However, this method requires specialized equipment and expensive radioactive isotopes. Additionally, due to the random incorporation of radioactive labels on ADCs, the behavior and characteristics of ADCs may be affected.
Fluorescent probes are simple and efficient for labeling biomolecules. Multidimensional and three-dimensional fluorescence imaging has been used to assess in vivo biomarkers, biomolecules, and targeting activity. ADCs labeled with fluorescent dyes can achieve real-time monitoring of drug distribution in vivo. However, due to internal and external factors such as sample light absorption, excitation light source fluctuation noise, and dye concentration, quantifying drug release through fluorescence monitoring is not accurate. To address this issue, Shi et al. established a dual-fluorescence signal emission ratio system. Continuous dual-fluorescence signal measurements provide internal calibration and improve the quantification of drug release. Since the absorption and emission of these dyes are in the near-infrared window (650-900nm), which has good tissue penetration and low toxicity, they are commonly used for laboratory imaging as well as clinical diagnosis and treatment. Therefore, Thankarajan and colleagues recently developed a ratio assay system based on monoclonal antibodies, namely IRD-Ab-mXCy-CLB. In these components, IRD is the reference dye, which is near-infrared fluorescent hemicyanine, AB is trastuzumab, mXCy is the near-infrared fluorescent activator dye, CLB is the model drug phenylbutyric acid nitrogen mustard, which is connected to mXCy through a hydrolyzable ester linker. This dual-dye ratio system can monitor the distribution and drug release of ADCs. The specific process is shown in Figure 8B, and example images are shown in Figure 8C. The authors’ results indicate that this ratio design can achieve the goal of quantitatively monitoring free drug. Furthermore, this platform is not affected by experimental variations or the changes in mouse responses to ADC administration.
4.5. Fecal Microbiota Transplantation
Fluorescent labeling is an effective method for monitoring ADCs in vivo, and among all fluorescent imaging techniques, FMT imaging can collect three-dimensional (3D) tomographic data using near-infrared spectroscopy. It has potential applications in localization across multiple organs and quantification and detection of fluorescently labeled drugs. Additionally, FMT allows the use of multiple fluorophores and is non-invasive, enabling longitudinal monitoring of the same animal. Giddabasappa et al. used near-infrared fluorophores VivoTag680XL to label naked antibodies and the antibody portion of ADCs to assess the targeting accuracy and biodistribution of anti-5T4 (5T4: trophoblast glycoprotein) antibodies and related ADCs. Through the 3D quantitative data of FMT, cardiac imaging signals can be quantified and correlated with plasma concentration curves. Furthermore, tumor growth can also be monitored.
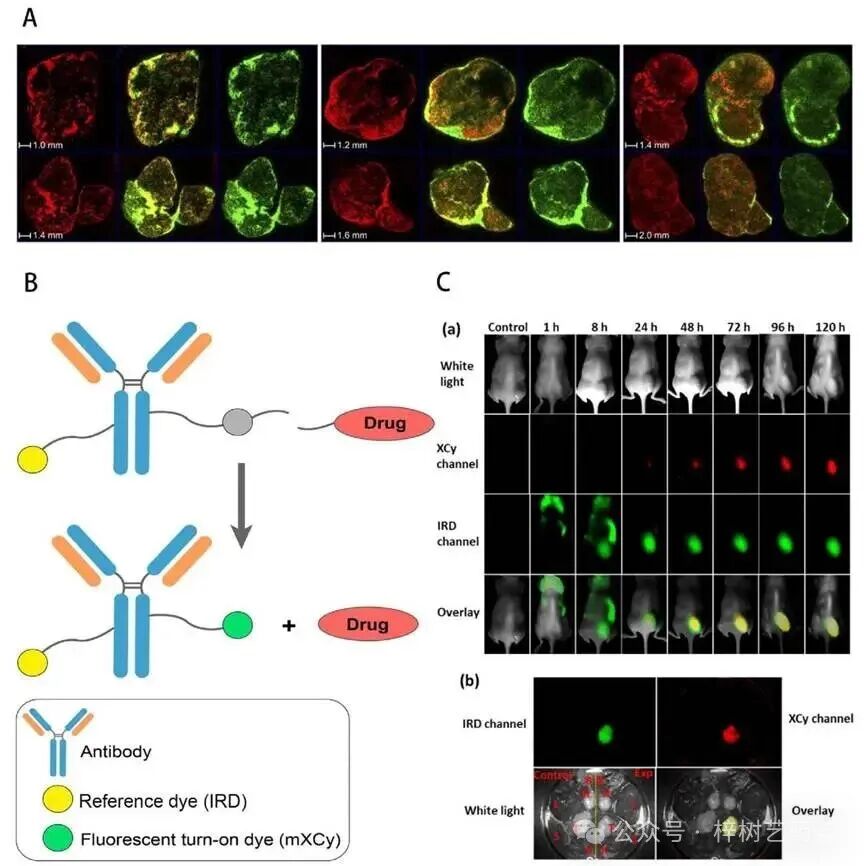
Figure 8.(A) The images of HEK-293GCC2 tumor (top) and HEK-293 tumor (bottom) injected with isotopes. The 3H signal is red, and the 111In signal is green, with the two signals overlapping to yellow. After 24 hours, the HEK-293GCC2 shows that the drug has diffused from the antibody accumulation site into the tumor. (B) The principle of detecting ADC drugs using the dual dye ratio system. The yellow oval is the IRD dye, and the green oval is the mXCy fluorescent activator dye. When the yellow fluorescent-labeled ADC enters the cell, the linker breaks after internalization, separating the drug, and the remaining ADC portion shows red fluorescence. Therefore, drug release can be monitored by observing fluorescence. (C)(a) Time-dependent images of white light, XCy (near-infrared fluorescent activator dye), and IRD (near-infrared fluorescent dye) channels, as well as overlay images of mice given IRD-Ab-mXCy-CLB and control mice. (b) Fluorescent images of selected organs and tumors after 120 hours (left, control mice; right, treated mice). H, heart; S, spleen; L, liver; B, brain; K, kidney; T, tumor.
[NO.5]Summary, Challenges, and Future Perspectives
This review summarizes the characterization of ADCs from in vitro to in situ at the cellular or organism level. In vitro techniques mainly focus on the detection of DAR and conjugation sites, as well as the structure and stability of ADCs. In the analysis of DAR, most recent studies have concentrated on condition optimization, such as mobile phase composition, pH values, temperature, salt concentration, organic solvent ratios, column length, and equipment. However, so far, there is still no perfect analytical technique; even two-dimensional chromatography may be criticized for consuming samples, being time-consuming, and relying on expensive equipment. As the overall trend of stabilizing ADCs is shifting from heterogeneity to homogeneity, conjugation technology will become the next hotspot in ADC research. Therefore, the characterization of conjugation sites is crucial. New technologies will be developed to clearly understand the interactions between amino acid residues and linkers, which will aid in the further development and improvement of site-specific ADCs. For in vitro analysis, further innovative methods can be developed for preprocessing steps, which will assist in subsequent analysis and quantification. In a recent study, computer simulations were used to challenge our traditional analytical perspectives. This reminds us that optimizing future strategies may require us to abandon fixed mindsets and leverage computer modeling to simulate more effective methods.
At the cellular, tissue, and organism levels, most analytical techniques are imaging methods, such as fluorescence and radioactive labeling. These methods can intuitively and dynamically analyze the transport, absorption, and clearance of ADCs, providing information on their behavior and fate in vivo to guide the optimization and development of ADCs. Like other therapeutic methods, understanding the fate of ADCs in vivo is crucial for their development, optimization, and successful translation to human applications. However, when visualizing, several factors must be considered, including the physicochemical properties of antibodies, conjugation positions, and the hydrophobicity of the payload. For instance, the hydrophobicity of the drug can lead to a bystander effect, and how to visualize it is also a challenge for researchers. Recently, Khera et al. tracked the labeled ADCs and payloads through the application of 3D cell culture techniques and primary human tumor xenograft studies. The results indicated that the payload could penetrate beyond the target cells. This study provides a way to understand the mechanism of bystander effects of clinically effective therapeutic drugs. However, the most significant drawback of these methods is that they cannot be used for accurate quantification of ADCs or for DAR calculations and distribution analysis. Therefore, each method has its advantages and disadvantages and should be evaluated based on different experimental requirements and objectives.
 Classic Books and More Learning Resources Welcome to follow the “Yiyao Hui” knowledge community!
Note: Name + Unit + Direction
Copyright Notice: This article is welcome to be forwarded to personal WeChat Moments, but media or institutions are prohibited from reprinting it to other platforms in any form without authorization. For reprint authorization or other cooperation needs, please contact Zishu (WeChat: Z07302256).
Disclaimer: This article is for informational exchange purposes only, and the views expressed in the text do not represent the position of “Zishu Yiyao Hui”, nor do they represent “Zishu Yiyao Hui”‘s support or opposition to the views in the text. This article is not a recommendation for treatment plans. For treatment guidance, please visit a regular hospital.