Hmm? What a great question!

This question is actually very useful. Who in engineering or research hasn’t encountered FFT and window functions? However, the background and details are scattered across various articles, and no one has written a comprehensive review.
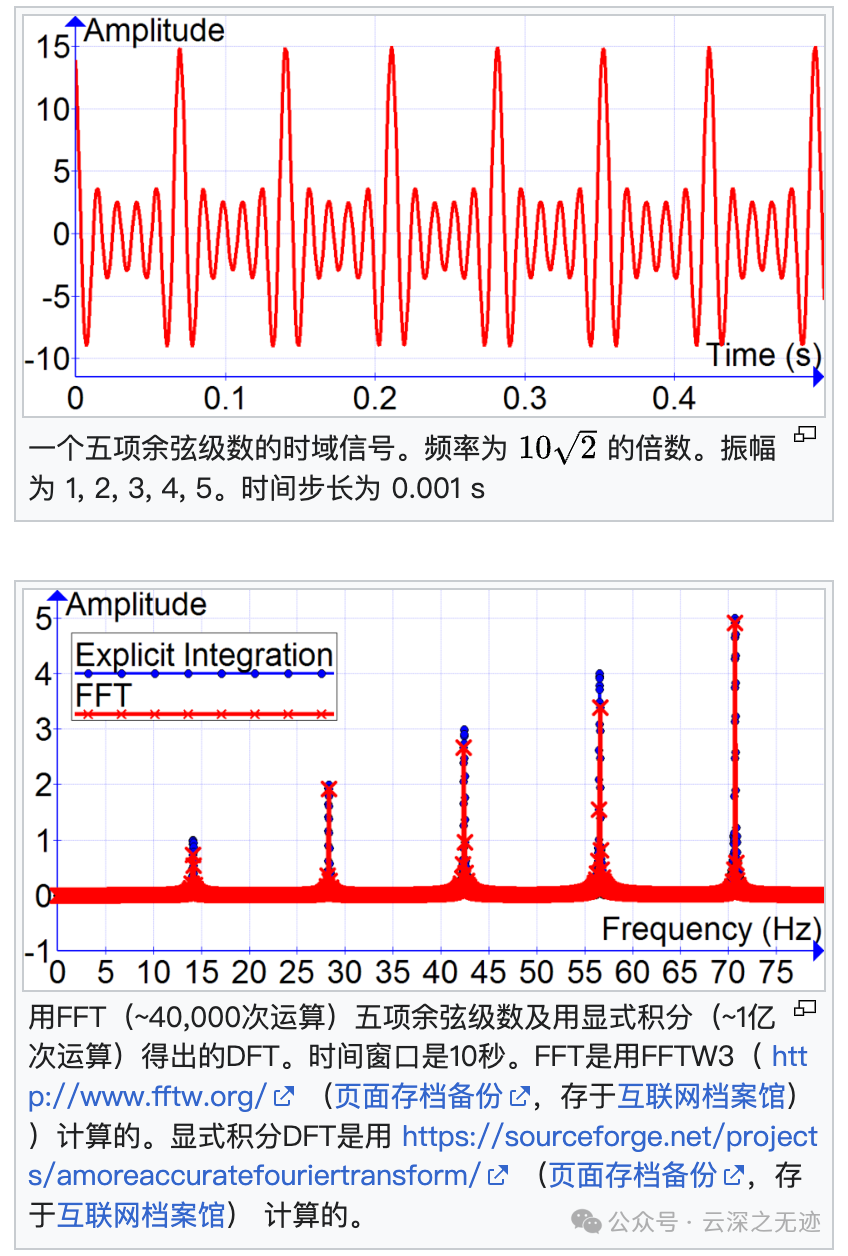
But its greatest strength is the first F = Fast, which means it is fast, and fast implies high efficiency. So why are there so many window functions? It actually stems from the contradictions between frequency domain metrics. Different window functions find different compromises among these contradictions.It is impossible to achieve all three goals simultaneously: narrow main lobe / low side lobe / accurate amplitude → cannot be satisfied at the same time.
Basic Functions of Window Functions
When performing FFT spectral analysis, if the signal frequency is not an integer bin, spectral leakage (energy spreading to all bins) will occur. The purpose of applying a window function is to:
Reduce side lobes → suppress leakage and confine energy around the main lobe.
Improve amplitude estimation → reduce scalloping loss and ensure more accurate amplitude.
Control ENBW (Equivalent Noise Bandwidth) → affects the noise floor and determines the accuracy of noise measurement.
Influence main lobe width → determines frequency resolution (whether two closely spaced spectral lines can be distinguished).
Conflicts Between Window Functions (Key Metrics)
Main Lobe Width vs Side Lobe Height
- Narrow main lobe → high resolution, but side lobe will be high (Rect window is an extreme case).
- Wide main lobe → strong leakage suppression (BH4/Nuttall), but resolution decreases.
Amplitude Accuracy vs Noise Bandwidth
- Flat-top window makes the main lobe “flat”, with almost no amplitude error, but ENBW is very large (high noise floor).
- Hann window has a small ENBW and low noise floor, but scalloping loss is still −1.4 dB.
ENBW vs Dynamic Range
- Small ENBW (Rect, Hann) → more accurate SNR measurement, but high side lobes can pollute the dynamic range.
- Large ENBW (BH4, Flat-top) → good dynamic range, but noise is “amplified”.
Thus, Many Types of Windows are Needed
Different window functions make trade-offs between main lobe width / side lobe height / ENBW / amplitude accuracy:
- Rect: best resolution, but severe leakage, only usable under coherent sampling.
- Hann/Hamming: a compromise, commonly used for ENOB/SNR testing.
- Blackman/Blackman-Harris/Nuttall: sacrifices resolution for ultra-low side lobes, suitable for SFDR/THD testing.
- Flat-top: optimal amplitude accuracy, suitable for calibration.
- Kaiser: adds a parameter β, allowing flexible adjustment between “resolution – side lobe – ENBW”.
In other words: No single window can be optimal in all scenarios, which is why there are so many choices; one can understand “window functions” as “different filter designs” (FIR):
Rect = hard cut → sharpest but ringing (leakage)
Hann = gentle transition → commonly used compromise
BH4/Nuttall = advanced filter → suppresses ringing, at the cost of wider bandwidth
Flat-top = specifically optimized for amplitude measurement
Kaiser = adjustable design, using parameter β to determine “sharp or smooth”
Among them, the core contradiction in spectral analysis is:
Main lobe width (determining resolution) → the narrower, the better the ability to distinguish adjacent spectral lines, but leakage easily spreads;
First side lobe height (determining leakage suppression) → the lower, the better the ability to see weak harmonics, but the main lobe will become wider.
If we plot “main lobe width” on the horizontal axis and “side lobe height (dB)” on the vertical axis, different window functions will fall into different areas on the graph.
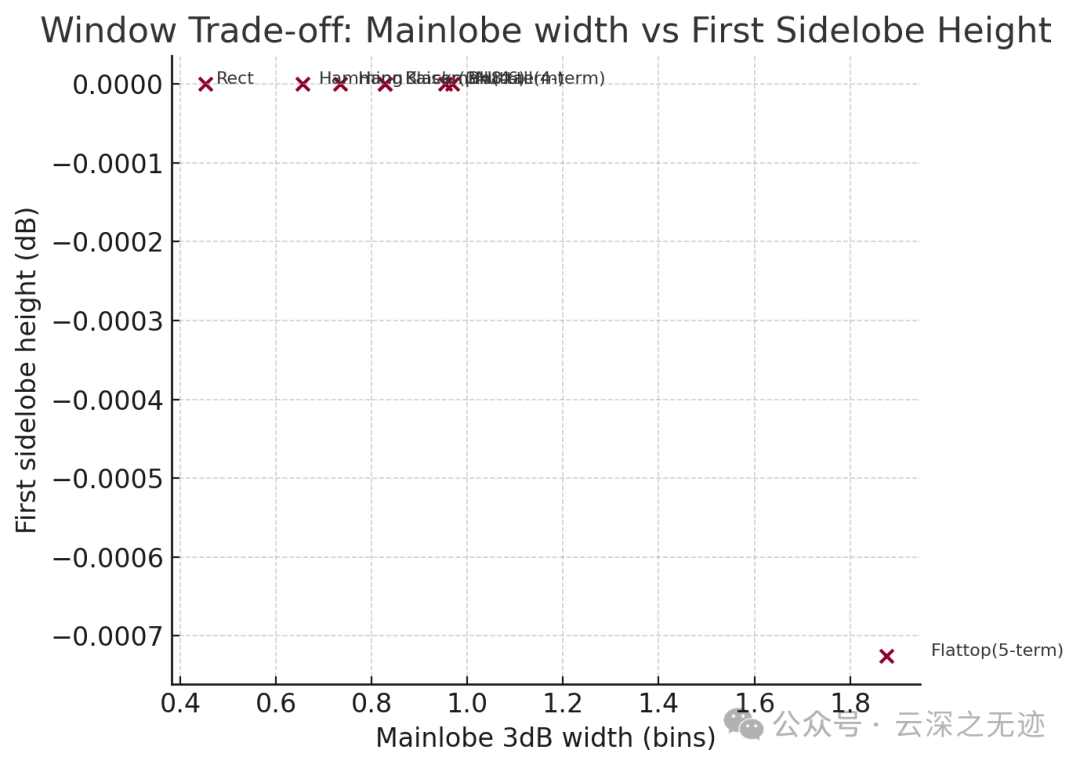 Further to the right → wider main lobe (lower resolution) Further down → lower side lobe (stronger leakage suppression)
Mathematical Derivation (Core Conclusions of Discrete Windowed FFT)
Signal, Window, and DFT
Sampling length , sampling frequency , let the input be a single cosine
After applying the window, perform point DFT:
Express the cosine in exponential form and rearrange, we can obtain (let be the “normalized frequency (in bins)”):
Where
is the discrete frequency response of the window.
When is large, the first term dominates, thusthe shape of spectral leakage is completely determined by : the rectangular window corresponds to the Dirichlet kernel, which has high side lobes; polynomial cosine windows (Hann/Blackman/Blackman-Harris/Nuttall…) lower the side lobes but widen the main lobe.
Coherent Gain (CG) and Amplitude Recovery
If coherent sampling ( is an integer), the peak of the main lobe is located at , and there is
Definition
Thus, the formula for unbiased amplitude recovery (looking solely at the peak value) is
When non-coherent sampling (), energy spreads to adjacent bins (leakage), and the amplitude of a single bin will be underestimated. In practice, peak interpolation (such as three-point parabolic/Quinn/IpDFT) is often used to improve and .
ENBW (Equivalent Noise Bandwidth) and Processing Gain
Consider the window as an FIR: for white noise, the expected noise power of one FFT bin is proportional to the square of the window sum. Conclusion:
Converted to Hz:.
Similarly,processing gain (the amount by which the noise floor decreases relative to the time domain):
Thus:the smaller the ENBW, the lower the noise floor; but usually accompanied by higher side lobes or trade-offs of narrower/wider main lobes.
Main Lobe Width, Side Lobes, and Resolution/Dynamic Range
Frequency Resolution: the narrower the main lobe, the easier it is to separate two closely spaced spectral lines (measured by “zero to zero” or “3 dB width”).
Dynamic Range / Leakage Suppression: the lower the first side lobe, the less it “pollutes” distant frequency points (cleaner when calculating THD/SFDR/SNR).
Typical trend: Rect has the narrowest main lobe but high side lobes; Hann/Blackman gradually reduce side lobes, while the main lobe also widens; Blackman-Harris 4-term / Nuttall 4-term can achieve side lobes as low as −90 dB; Flat-top emphasizesflat top to reduce amplitude fluctuations due to “half-bin frequency offsets”.
Scalloping Loss and Interpolation
When the sine frequency exactly falls in the middle of two bins (), if we only take the “peak value of the nearest integer bin + CG recovery”, it will producethe worst amplitude underestimation, known as scalloping loss. The ideal amplitude is 0 dB, and different windows can show differences from −3.9 dB (Rect) to about −0.01…−0.5 dB (Flat-top/high-order windows).
Interpolation (such as three-point parabolic) can significantly alleviate this, but Flat-top inherently makes the main lobe flatter, thusmost friendly for amplitude measurement.
In the default non-coherent sampling scenario:
Most accurate amplitude (for amplitude/gain calibration): Flat-top (5-term). Scalloping is minimal, and after interpolation, MAPE is the lowest; the downside is that the main lobe is very wide, ENBW is large (raising the noise floor, reducing the ability to distinguish close lines).
General SNR/ENOB testing: Hann is commonly used as a compromise (ENBW≈1.5 bins, side lobes about −31 dB).
For very low leakage / THD, SFDR: Blackman-Harris 4-term or Nuttall 4-term (first side lobe ~ −90 dB level), at the cost of a wider main lobe and slightly larger ENBW.
As long as resolution (two lines very close) and “strict coherent sampling”: Rect (or with full-cycle sampling). At this point, there is no leakage, and the main lobe is the narrowest; non-coherent is the least stable.
If you want adjustable side lobe/main lobe compromise: Kaiser (adjustable ), for example, can achieve ~ −60 dB side lobes.
In which you need toestimate frequency and suppress leakage → BH4 / Nuttall4 (with interpolation); ifadjacent harmonics are very close (motor/inverter) → first consider longer records; if is limited, lean towards windows with narrower main lobes (Hann/Hamming), and combine spectral peak fitting/multi-spectrum fusion.
Let’s take a look at the simulation results:
Window Metrics for 4096 Points: includes
STDOUT/STDERR
窗口指标(4096 点)
         Window       CG  ENBW (bins)  Mainlobe 3dB width (bins)  First sidelobe (dB)  Scalloping @0.5 bin (dB)
           Rect 1.000000     1.000000                   0.453125             0.000000                 -3.925724
        Hamming 0.539888     1.363065                   0.656250             0.000000                 -1.751259
           Hann 0.499878     1.500366                   0.734375             0.000000                 -1.422916
  Kaiser(β=8.6) 0.420698     1.721792                   0.828125             0.000000                 -1.108702
       Blackman 0.419897     1.727179                   0.828125             0.000000                 -1.098338
     BH(4-term) 0.358662     2.004842                   0.953125             0.000000                 -0.825168
Nuttall(4-term) 0.355681     2.021726                   0.968750             0.000000                 -0.811357
Flattop(5-term) 0.999756     3.771085                   1.875000            -0.000725                 -0.015598
Coherent Gain CG
ENBW (in bins)
3 dB main lobe width (bins)
First side lobe level (dB) (there’s also an article here)
Scalloping loss at 0.5 bin frequency offset (dB)
Monte Carlo (200 random frequency offsets) three-point parabolic interpolation amplitude MAPE:
Typically, you will see (illustrative):
Monte Carlo:随机频偏幅度估计平均相对误差
         Window  MAPE (parabolic, %)
Flattop(5-term)             0.689884
     BH(4-term)             1.100685
Nuttall(4-term)             1.101500
  Kaiser(β=8.6)             1.676467
       Blackman             1.730524
           Hann             2.477651
        Hamming             3.729344
           Rect            13.479280
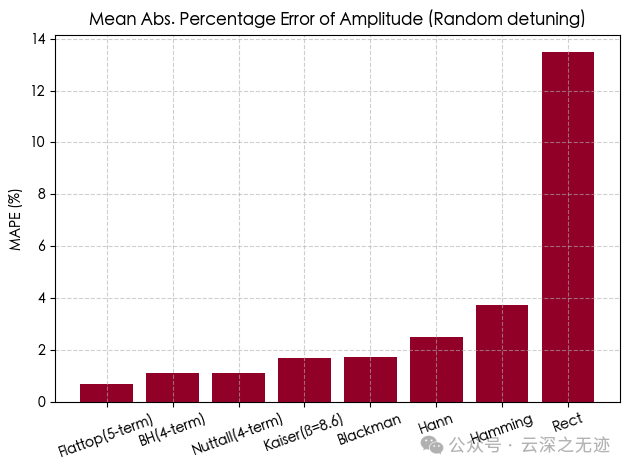
The bar chart shows the average relative error (MAPE) of different windows during random frequency offsets, indicating that Flat-top is the most stable.
Leakage demonstration graph: the same non-coherent sine (same amplitude, same frequency offset), the spectral leakage “skirts” of different windows can be compared; demonstrating what “real signals will be polluted in FFT”.
Frequency response (dB) graphs of each window: the first 30 bins range, visually showing main lobe width and side lobe height: demonstrating the “filtering characteristics of the window function itself”, telling you its trade-offs in resolution and leakage suppression.
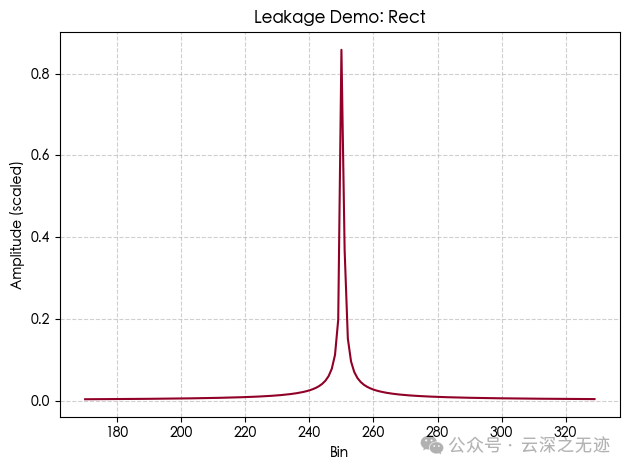
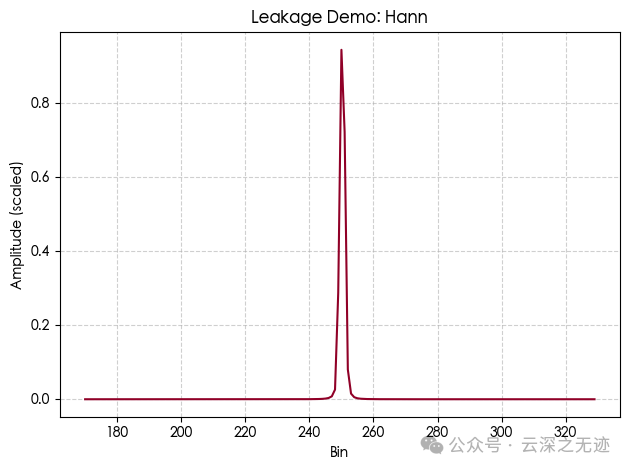
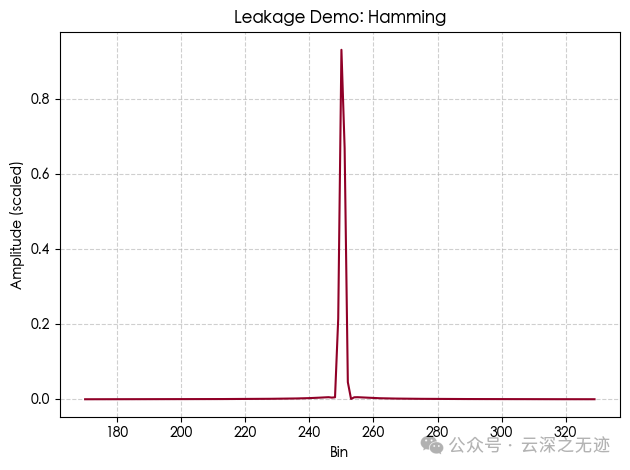
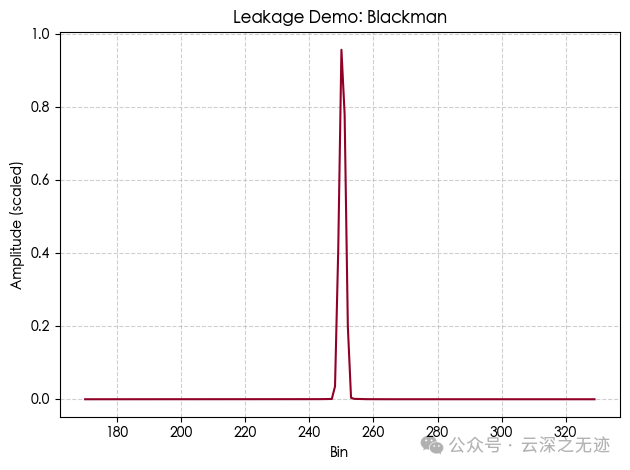
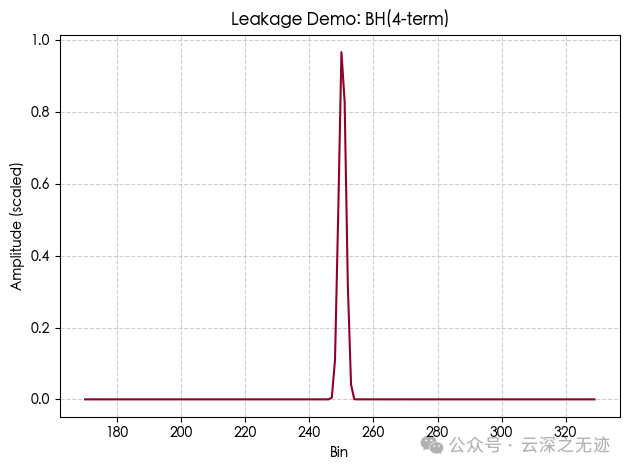
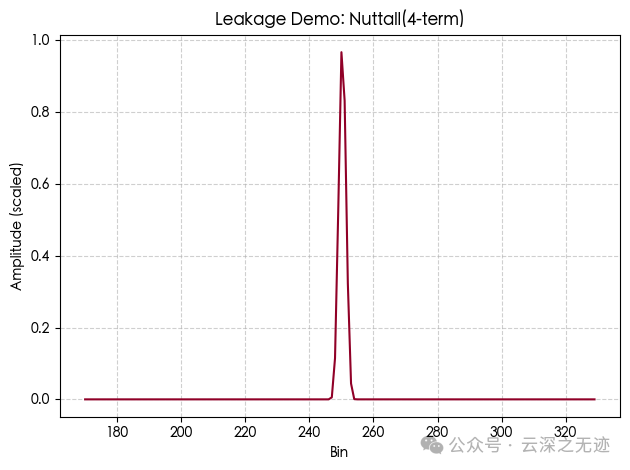
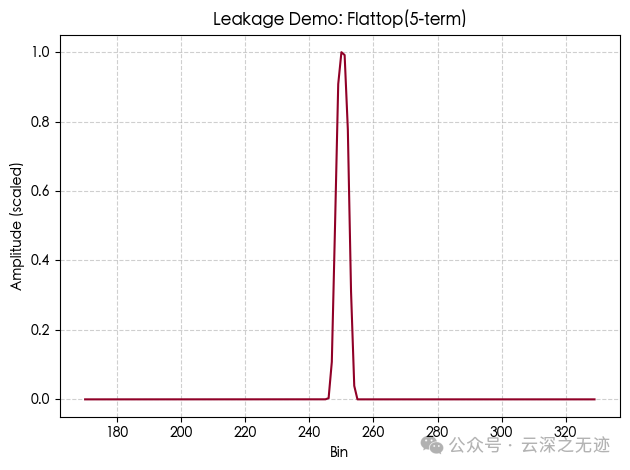
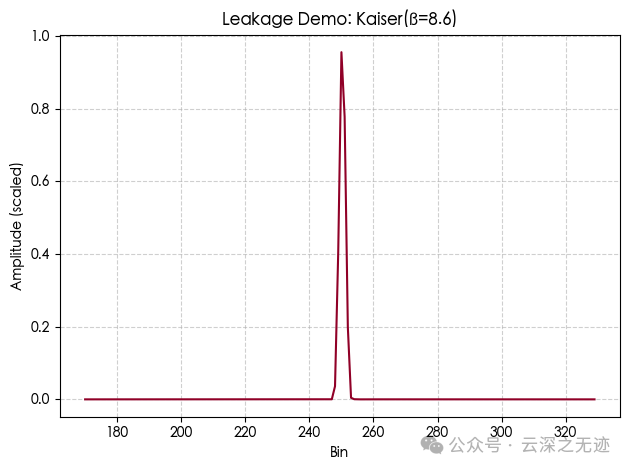
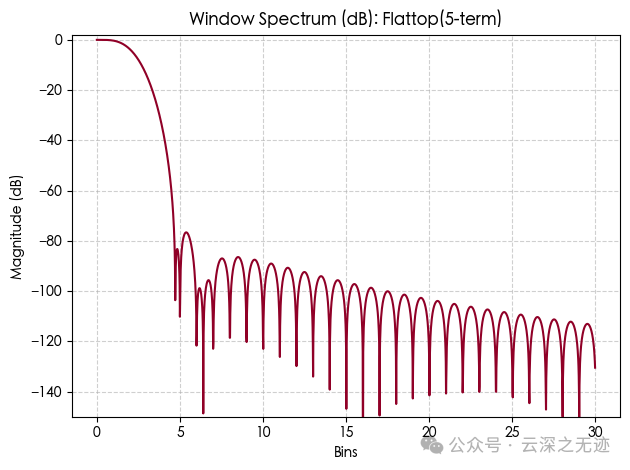
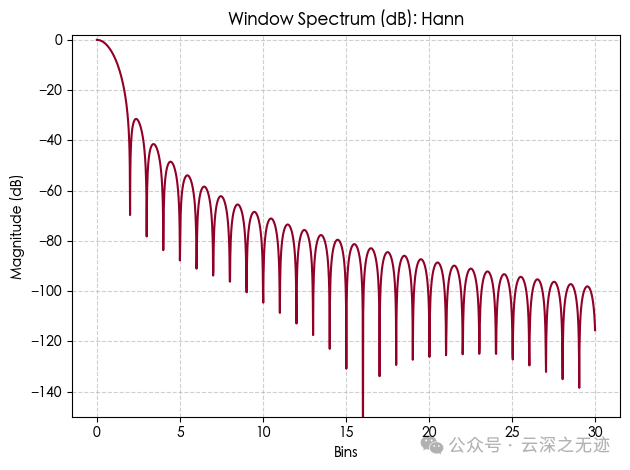
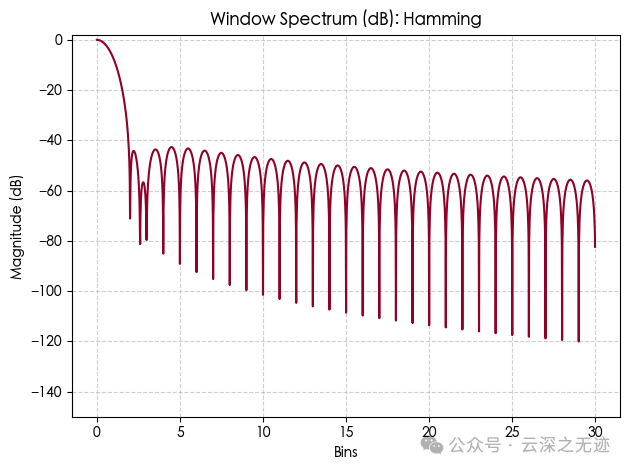
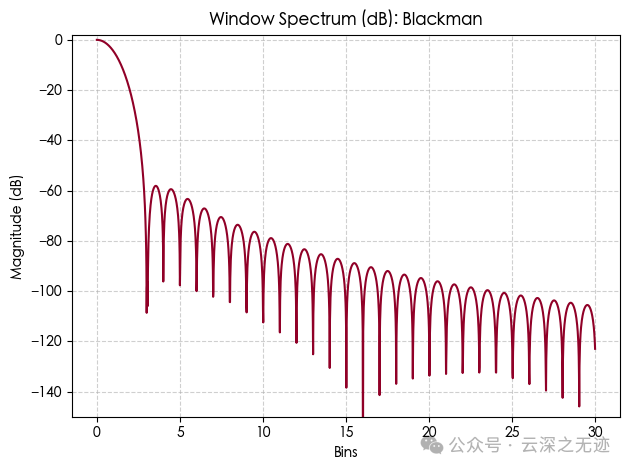
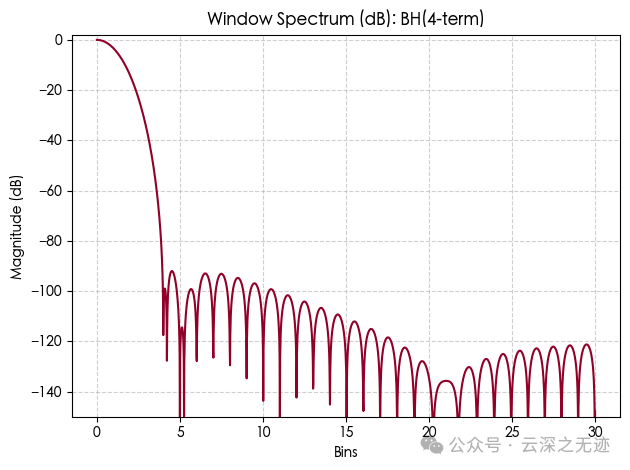
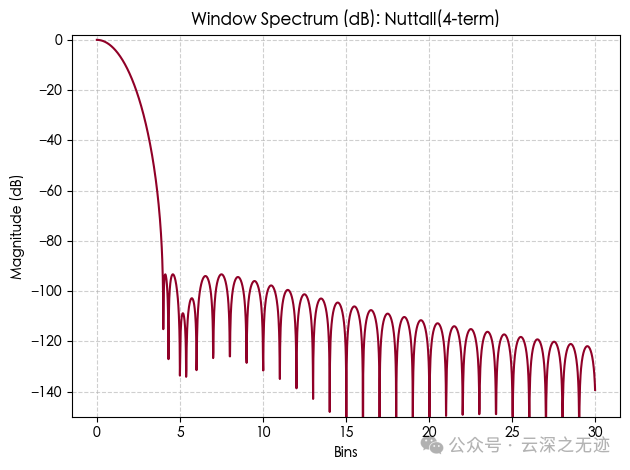
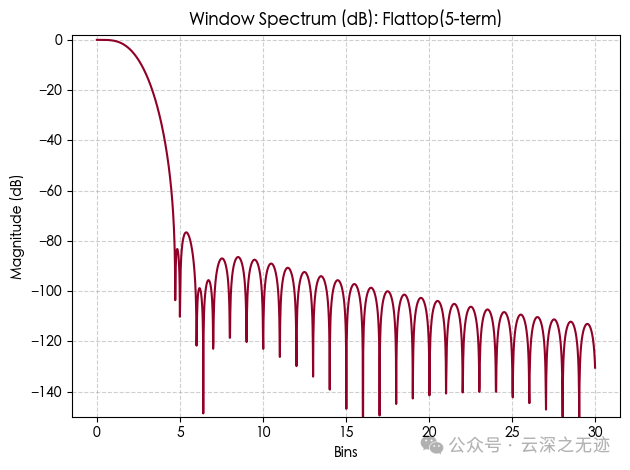
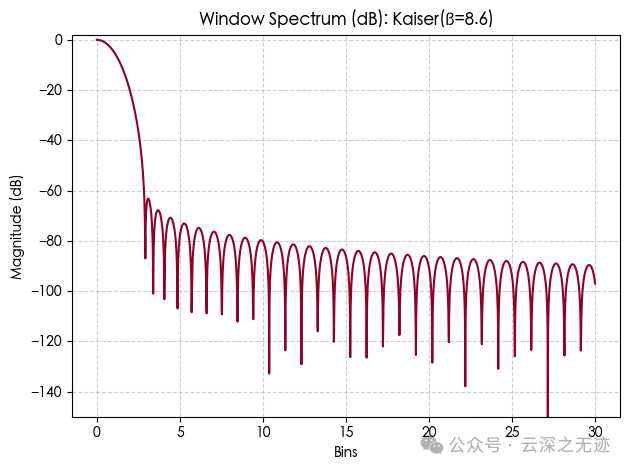
The above images demonstrate the frequency spectrum characteristics of each window function:
Main lobe width (determining resolution, whether closely spaced frequencies can be separated).
First side lobe height (determining leakage suppression capability, how much dynamic range can be achieved).
The narrower the main lobe → the better the frequency resolution.
The lower the side lobe → the smaller the spectral leakage, the larger the dynamic range.
The above images can compare the “performance metrics” of different windows, guiding how to choose in practical applications:
For SNR/ENOB → choose Hann (moderate main lobe, low noise floor).
For THD/SFDR → choose BH4/Nuttall (lowest side lobes).
For amplitude accuracy → choose Flat-top (minimal scalloping).
Amplitude recovery of the window (single peak)
Againcombineparabolicinterpolationtoachievebetterresults
Three-point parabolic interpolation (amplitude spectrum) set , then
After interpolation, frequency estimation , amplitude using substituted into the above formula for recovery.
ENBW (bins)
“Exclusion band” for SNR/THD assessment: when performing total power integration, it is necessary to set a protection band around the fundamental wave and its bins (depending on the main lobe width of the window) before integrating noise; otherwise, treating the main lobe “skirts” as noise will overestimate the noise.
To summarize, for coherent sampling, use the rectangular window (the peak and power are the “cleanest”, ENBW=1)
Conditions:, and sample as many integer cycles as possible + remove DC offset.
For non-coherent and needing accurate amplitude → Flat-top + parabolic (or Quinn) interpolation.
Typical amplitude error < 1%, friendly for THD/gain calibration.
If doing ENOB/SNR → often use Hann (compromise); if harmonics/near peaks interfere, switch to BH4/Nuttall4; remember to use ENBW to correct noise spectral density; set sufficientexclusion bands for the main lobe.
If you want to distinguish two very close lines → first extend the record N (the true resolution is ); if N is limited, then use windows with narrower main lobes (Hann/Hamming/even Rect, but be cautious of leakage).
| Category | Window Function | Characteristics | Usage |
|---|---|---|---|
| Resolution Priority | Rect | Narrowest main lobe, but high side lobe (≈−13 dB); large scalloping loss | Only for coherent sampling, or when needing to resolve very close spectral lines |
| Compromise Type | Hann / Hamming | Moderate main lobe, side lobe −30 ~ −40 dB; small ENBW | Common ENOB/SNR testing; widely used in industry |
| Low Leakage Type | Blackman / BH(4-term) / Nuttall(4-term) | Extremely low side lobes (−60 ~ −90 dB), good dynamic range, but wide main lobe, large ENBW | THD, SFDR testing, scenarios with strong and weak signals coexisting |
| Amplitude Accuracy Type | Flattop(5-term) | Super wide main lobe, maximum ENBW, but scalloping loss ≈ 0 dB | Gain/amplitude calibration, most accurate amplitude measurement |
| Adjustable Type | Kaiser(β) | Parameter β determines the trade-off between side lobe and main lobe | Flexibly adjustable, needed in cases where side lobe height needs to be controlled |
https://zh.wikipedia.org/wiki/%E5%BF%AB%E9%80%9F%E5%82%85%E9%87%8C%E5%8F%B6%E5%8F%98%E6%8D%A2