Background
This series of articles is based on the scenario initiated by American telecom giant Verizon, British Telecom BT Group, and UAE Telecom Etisalat, TMF Catalyst Project: Unleash the potential of GenAI-powered 5G network slicing.
As the commercial deployment of 5G deepens, network slicing, as a core technology, provides customized network services for vertical industries (such as smart ports, ultra-high-definition live broadcasting, and autonomous driving). However, ensuring end-to-end SLA for these slices is a significant challenge. Traditional NOCs (Network Operation Centers) rely on domain-segmented, static threshold-based monitoring systems, leading to alarm storms, slow fault localization, and inefficient cross-team communication, making it difficult to meet dynamic and stringent SLA requirements.
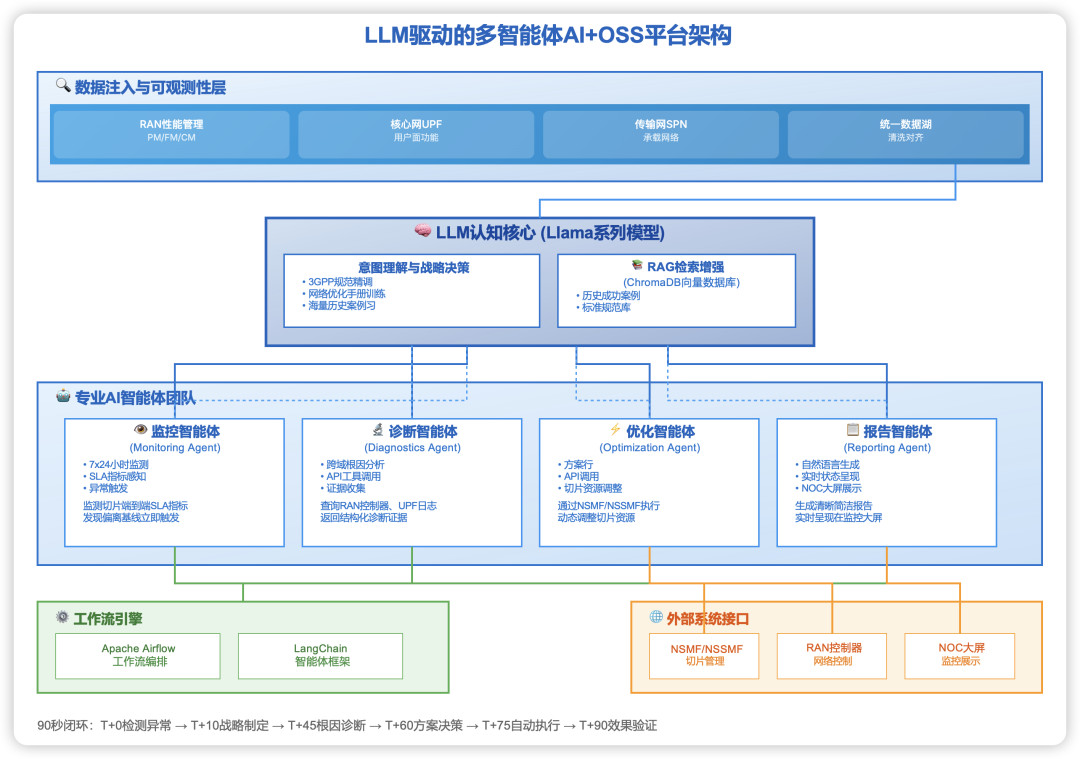
A previous article by the author (Part I: Top-Level Design) deeply analyzed a highly challenging scenario—dynamic QoS assurance for eMBB slices during large sporting events—and proposed a solution that aligns closely with the concept of self-intelligent networks. It elaborated on how to adopt a new paradigm of AI+OSS, with a large language model (LLM) as the “cognitive core” and four specialized AI agents working collaboratively, achieving a revolutionary transformation from passive “fault repair” to proactive, autonomous “experience assurance”, ultimately paving the way for the commercial realization of 5G slicing at scale.
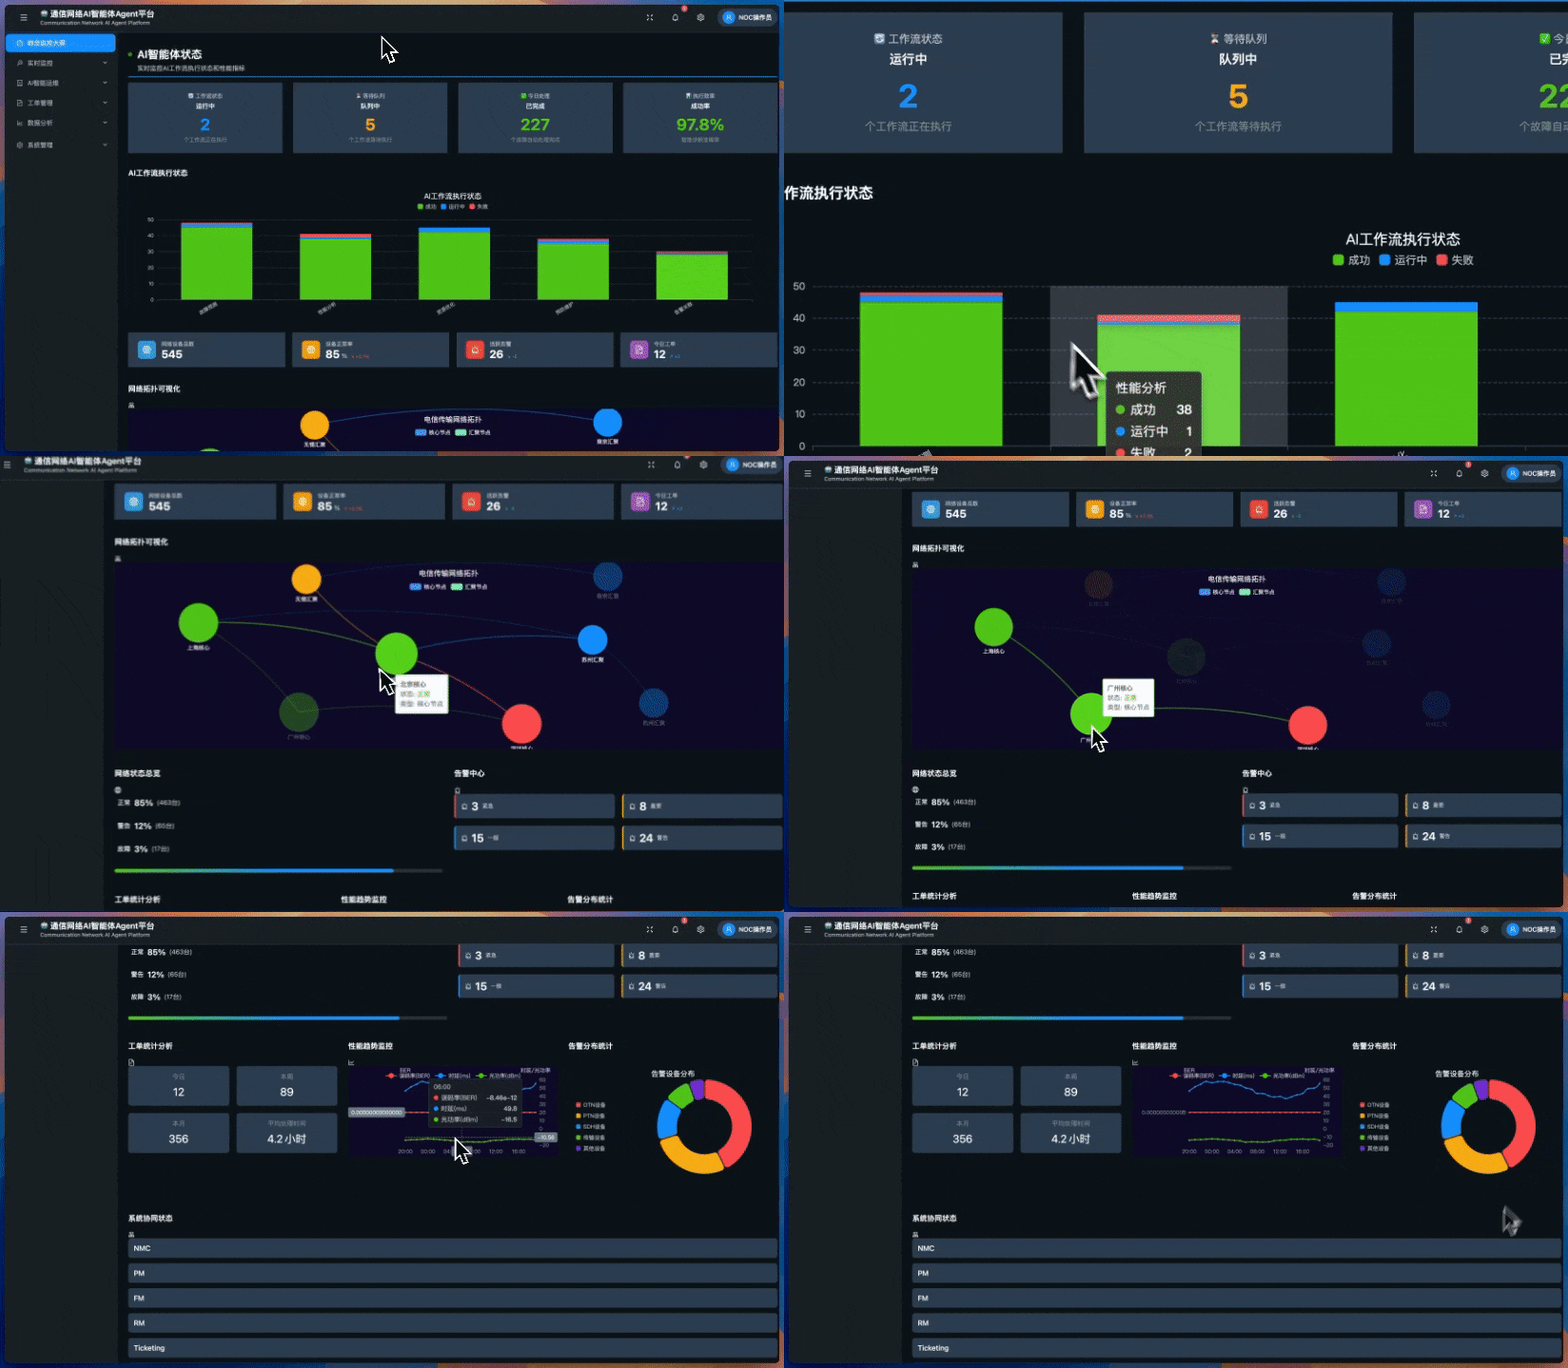
- 1. Monitoring Agent: Responsible for 24/7 uninterrupted monitoring of network slice performance and SLA metrics, serving as the team’s “sentinel”.
- 2. Diagnostics Agent: Responsible for cross-system and cross-domain data querying and correlation analysis upon receiving alerts, identifying the root cause of issues, acting as the team’s “detective”.
- 3. Optimization Agent: Responsible for executing specific network adjustment operations (such as resource scheduling and configuration changes) based on diagnostic conclusions and LLM-approved plans, serving as the team’s “engineer”.
- 4. Reporting Agent: Responsible for reporting the entire event handling process and results to human experts in natural language, serving as the team’s “communicator”.
This article puts the concept of telecom AIOps into practice, building an AI Diagnostics Agent for 5G network slice SLA degradation events based on the workflow orchestration capabilities of agents and the RAG knowledge base. This agent aims to automate the root cause analysis (RCA) process, compressing what traditionally takes hours of manual cross-domain troubleshooting into minutes.
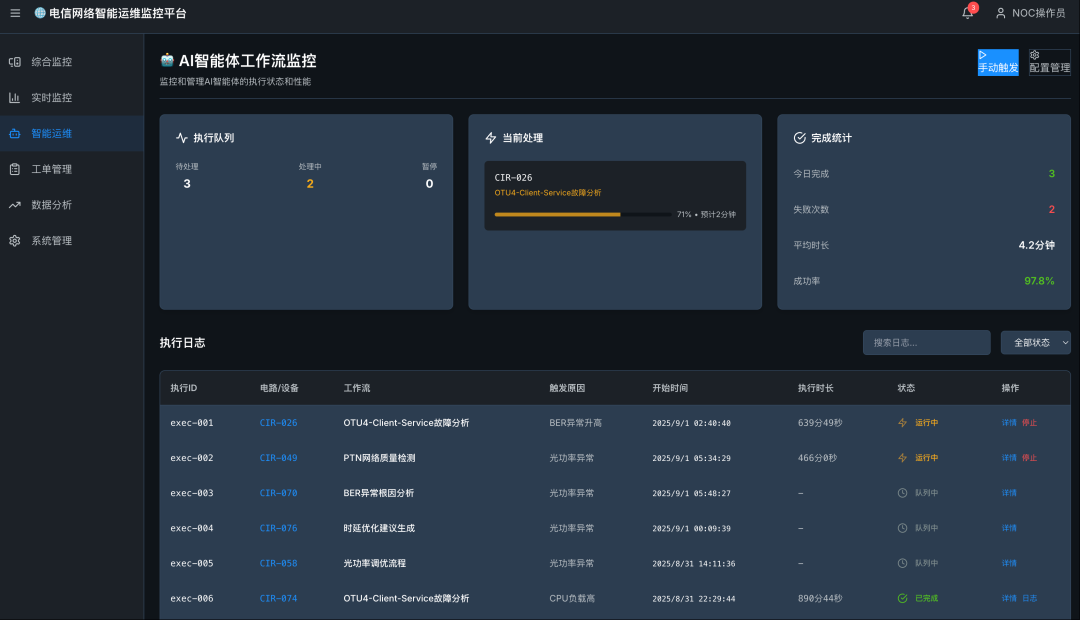
The core of this case is to simulate how the AI Monitoring Agent issues alerts after detecting issues in 5G slices, a monitoring paradigm replicated by global operators from Verizon to the Middle Eastern digital carrier Etisalat, and how the AI Diagnostics Agent autonomously conducts in-depth analysis. The systems involved include: AIOps data platform, Orchestrator, Fault Management System (FM), Resource Management System (RM), and RAG Knowledge Base (RAGKB).
AI large models are becoming the core engine for achieving highly autonomous networks. Their powerful contextual understanding, logical reasoning, and multi-source data fusion capabilities can simulate the diagnostic thinking of seasoned network experts, uncover hidden correlations from vast, heterogeneous telecom data, and pinpoint the root causes of issues.
In traditional NOCs, root cause analysis is the most labor-intensive and expert-experience-dependent process. When the monitoring system reports “delay exceeds standard”, the possible causes may span multiple technical domains, including wireless, transport, and core networks, requiring collaboration among multiple experts. The emergence of the AI Diagnostics Agent aims to automate this process, mimicking the expert’s diagnostic process of “looking, listening, asking, and feeling”: Acquire alerts (looking) -> Query multi-domain data (listening) -> Retrieve knowledge base (asking) -> Infer decisions (feeling), significantly enhancing operational efficiency and accuracy.
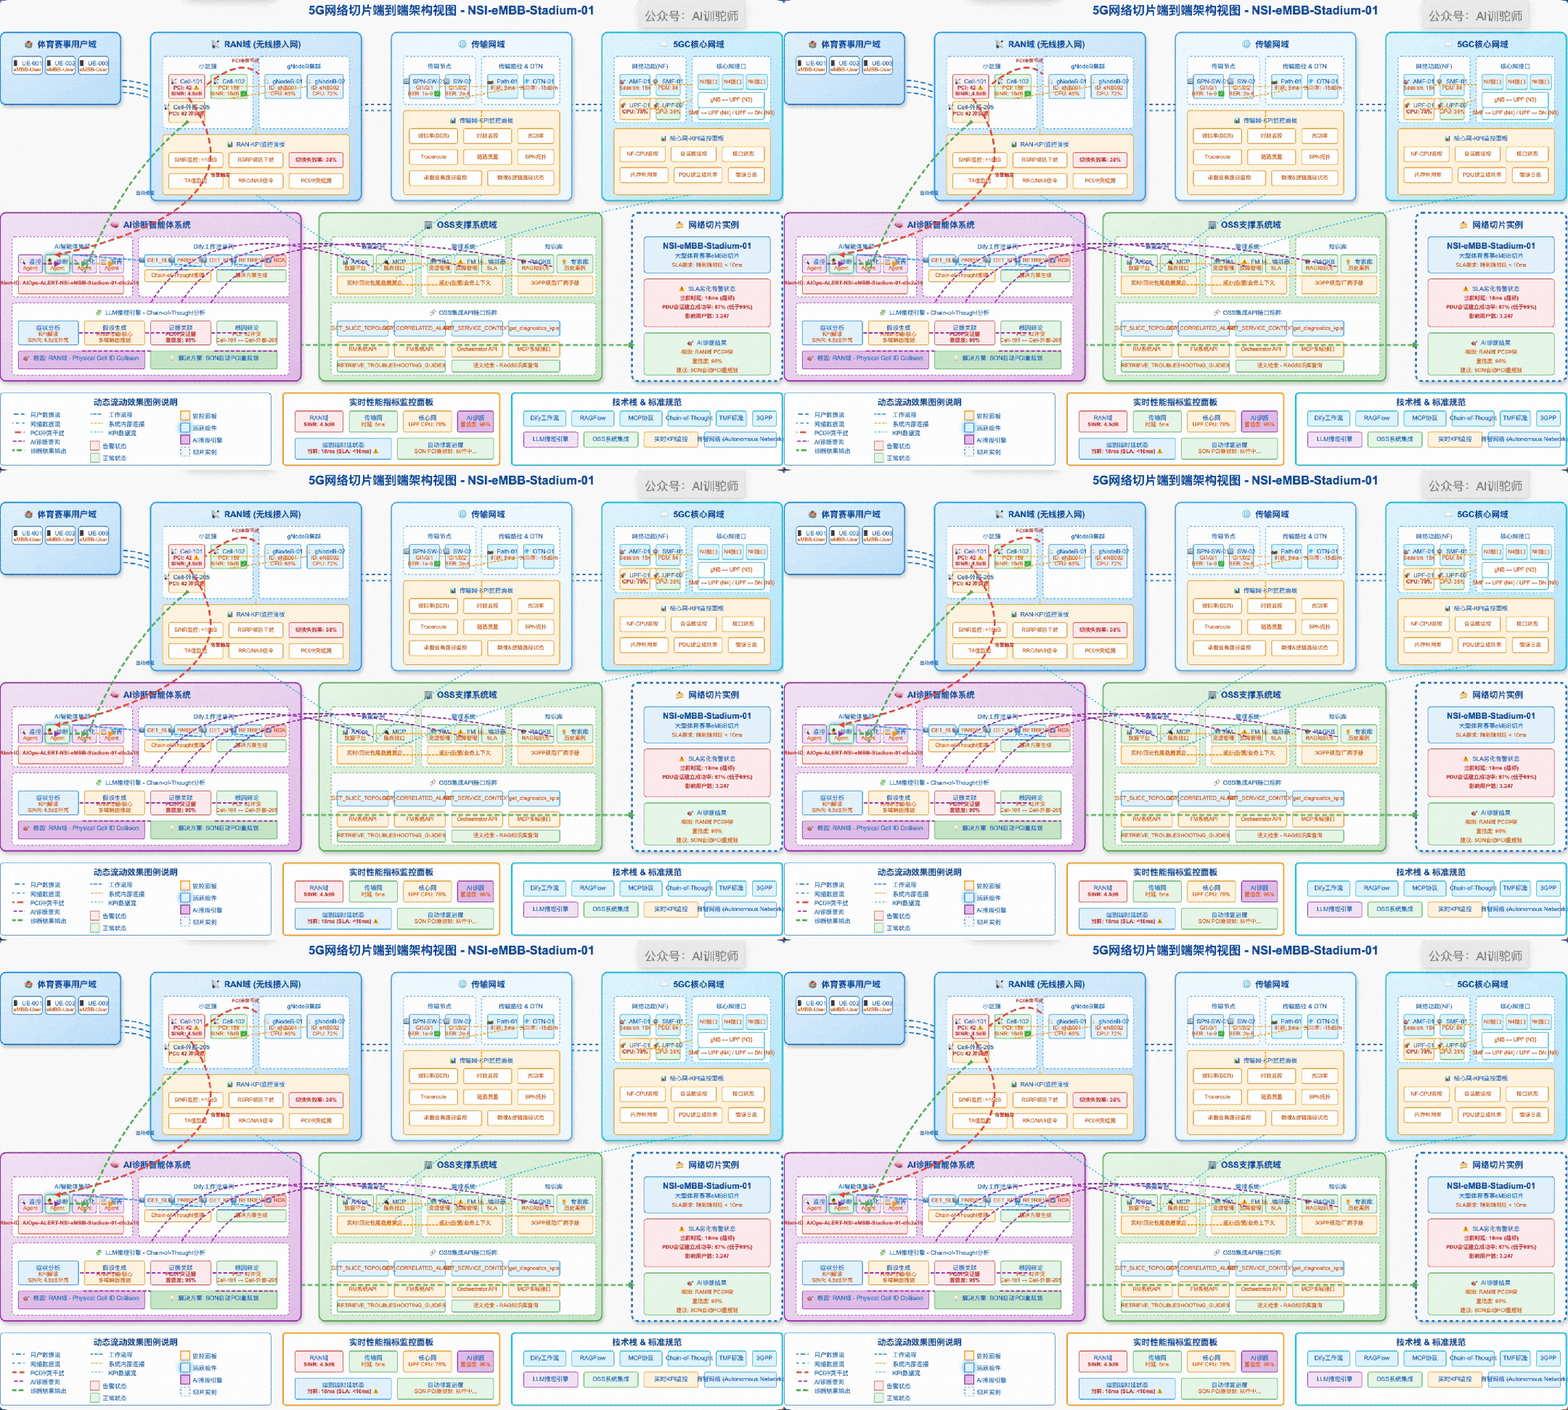
1. Scenario Description
This case continues the scenario of eMBB network slicing during large sporting events. The AI Monitoring Agent has issued a preliminary alert: “Slice instance NSI-eMBB-Stadium-01 has exceeded end-to-end delay and the PDU session establishment success rate has declined, posing a risk of SLA breach.”

Although this preliminary alert is timely, it does not specify the root cause. Is it congestion on the RAN side? Transmission network link jitter? Or core network SMF processing delay? Now, it is the turn of the AI Diagnostics Agent to take the stage. Its core task is to receive this alert ID and then autonomously and systematically conduct an in-depth cross-domain investigation, ultimately outputting a root cause analysis (RCA) report that includes the root cause, evidence chain, and solution recommendations for decision-making.
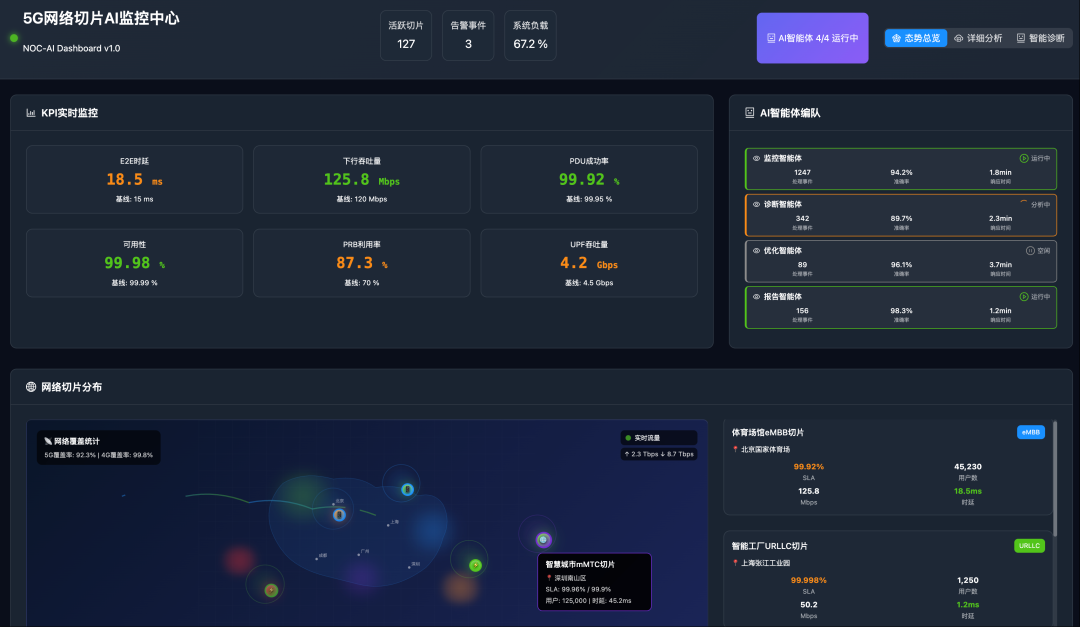
Diagnosis Target: SLA Degradation Event of eMBB Network Slice Instance (NSI-eMBB-Stadium-01)
1. Diagnosis Trigger
- • Input: Alert event ID from
AI Monitoring Agent, such asAIOps-ALERT-NSI-eMBB-Stadium-01-dfc2a198.
2. Diagnosis Objectives
- • Locate Fault Domain: Accurately determine whether the issue primarily occurs in the RAN, transport network, or core network.
- • Identify Root Cause: Find the specific technical reasons leading to SLA degradation (e.g., PCI conflict in a specific cell, increased bit error rate in a fiber link, CPU overload in a specific UPF instance).
- • Provide Solutions: Based on diagnostic conclusions, propose specific, actionable repair or optimization recommendations.
3. Key Diagnostic Probes
During the investigation, the AI Diagnostics Agent will query the following types of refined data as needed:
| Network Domain | Category | Key Diagnostic Probes | Query System | Diagnostic Value |
|---|---|---|---|---|
| RAN | Interference | Neighbor SINR/RSRP | AIOps Platform/OMC-R | Identify external or neighboring interference. |
| Configuration | PCI, Neighbor Relationship List | Resource Management (RM) | Check for PCI conflicts or neighbor misconfigurations. | |
| Signaling | RRC/NAS Failure Reason Code | AIOps Platform (Signaling) | Precisely locate failure reasons during wireless interface or core network attachment processes. | |
| Transport Network | Link Quality | Optical Power, Bit Error Rate (BER) | AIOps Platform/Transport NMS | Determine if the physical link quality has degraded. |
| Path | Traceroute/Ping Delay | NMS/Probe | Detect if there are congestion or high-latency nodes along the path. | |
| Topology | SPN/OTN Path for Carrying Services | Resource Management (RM) | Confirm the physical and logical paths actually carrying the services. | |
| Core Network (5GC) | Resource Utilization | NF CPU/Memory/Session Count | AIOps Platform/NFVO | Determine if the network function (NF) is overloaded. |
| Error Logs | UPF/SMF/AMF Error Logs | AIOps Platform (Logs) | Search for specific error messages or abnormal stacks in the logs. | |
| Connectivity | N3/N4/N6 Interface Status | AIOps Platform/Core NMS | Check if packet transmission between core network interfaces is normal. |
2. On-Site Situation
The operator’s NOC center has deployed preliminary AIOps capabilities, and data from various domains is collected into the AIOps data platform, but the analysis and decision-making process still heavily relies on manual intervention. When the AI Monitoring Agent generates an alert, the conventional process is:
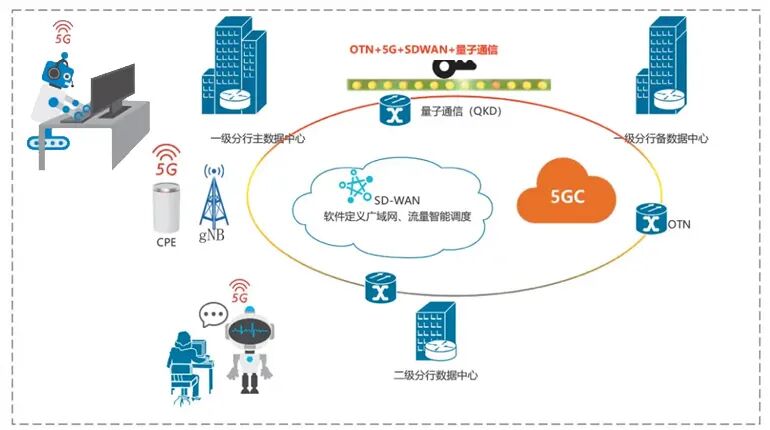
- 1. The alert automatically enters the ticketing system.
- 2. NOC frontline engineers receive the ticket and preliminarily judge the domains that may be involved based on the alert description.
- 3. Manually query data in different OSS interfaces (wireless performance monitoring, transport topology, core network log queries) based on the slice ID or associated network element ID.
- 4. Copy and paste the queried screenshots and data into internal communication groups, tagging domain experts.
- 5. Experts discuss and analyze based on their experience, a process that may take several hours or even longer.
The goal of this case is to completely replace steps 3, 4, and 5 with the AI Diagnostics Agent, achieving fully automated, intervention-free deep diagnostics after an alert is triggered.
3. System Architecture
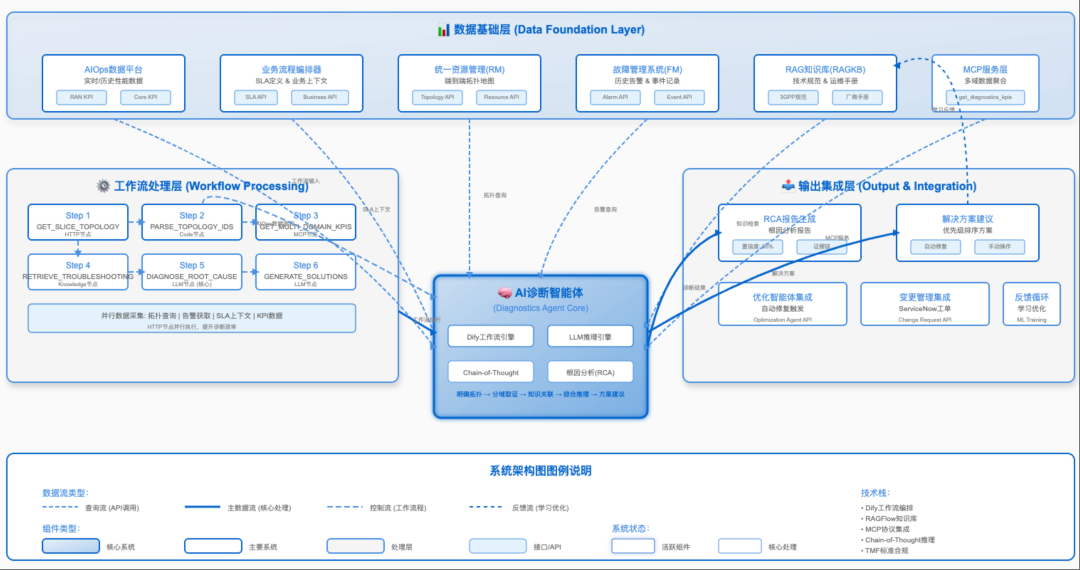
The operation of the AI Diagnostics Agent relies on a collaborative system ecosystem, where each system plays an indispensable role.
1. AIOps Data Platform
As the data foundation, it provides all necessary real-time and historical performance data for the Diagnostics Agent.
2. Business Process Orchestrator
As the provider of business context, it informs the agent of the specific SLA for the slice and its commercial value.
3. Resource Management System (RM)
This is the “map” for the Diagnostics Agent. At the start of the diagnosis, the agent first needs to query the RM to obtain the complete, end-to-end resource topology of the affected slice. This includes precise relationships between all network resources from wireless cells (Cell), gNodeB, to transport network switches, ports, and core network UPF, SMF, etc. Without this “map”, cross-domain diagnosis is impossible.
4. Fault Management System (FM)
As the historical event recorder, the FM system provides the agent with historical alarms and event tickets related to the current faulty network elements, assisting AI in pattern matching and trend analysis.
5. RAG Knowledge Base (RAGKB)
As an “external expert”, the RAGKB stores a vast amount of technical specifications and operational manuals. When the agent encounters a specific error code or alert, it queries the RAGKB for the most authoritative explanations and officially recommended handling steps, greatly enhancing diagnostic accuracy.
4. Technical Solution
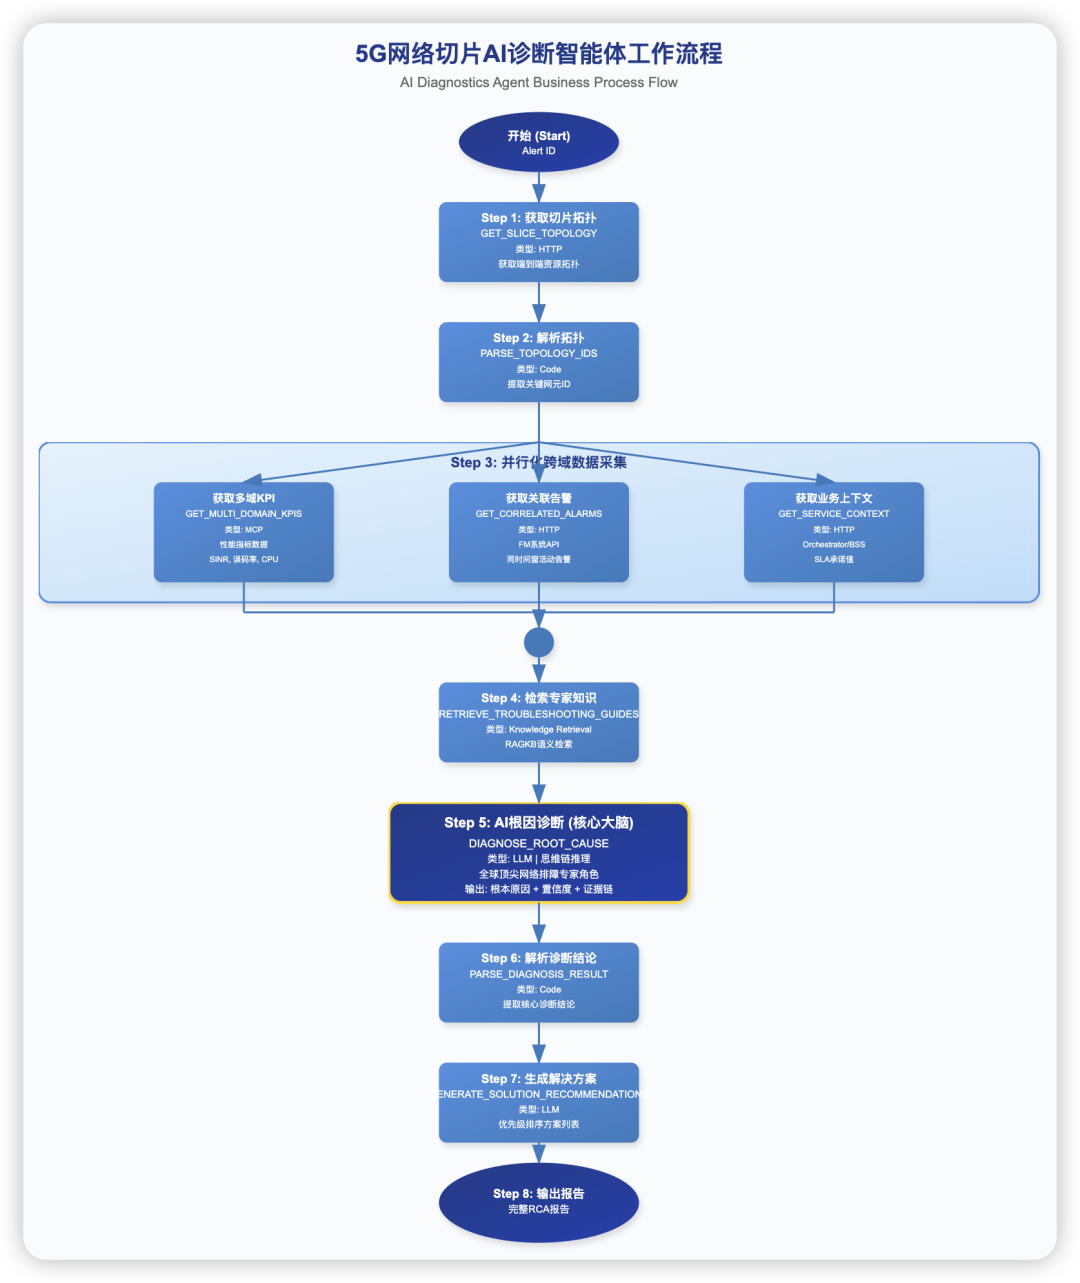
The core of the AI Diagnostics Agent is a meticulously designed Dify workflow that simulates the thought process of top network experts: Clarify topology -> Domain-specific evidence collection -> Knowledge correlation -> Comprehensive reasoning -> Solution recommendations.
Step 1: Acquire End-to-End Slice Topology
- • Node Type: HTTP
- • Node Name:
GET_SLICE_TOPOLOGY - • Function: Receives the
alert_idpassed from theStartnode. Using this ID, it first queries the FM system to find the associatedslice_instance_id, and then calls the RM (Resource Management) system’s API to obtain the complete, end-to-end resource topology of the slice. It returns a JSON object containing all related network elements (cells, gNodeBs, transport nodes, UPF, SMF, etc.) and their connection relationships.
Step 2: Parse Topology and Extract Key Network Element IDs
- • Node Type: Code
- • Node Name:
PARSE_TOPOLOGY_IDS - • Function: This Python code node parses the complex topology JSON returned in the previous step, extracting the lists of key network element IDs needed for subsequent queries (e.g.,
ran_cell_ids,transport_node_ids,core_nf_ids).
Step 3: Parallel, Cross-Domain Data Collection
This step pulls diagnostic evidence simultaneously from multiple data sources through parallel HTTP and MCP nodes.
- 1. Obtain Multi-Domain KPIs:
- • Node Type: MCP
- • Node Name:
GET_MULTI_DOMAIN_KPIS - • Function: Calls the AIOps MCP service’s
get_diagnostics_kpisinterface, passing in the multi-set of network element ID lists parsed in the previous step. The MCP service queries the AIOps data platform in the background to obtain detailed performance KPI data for these network elements within one hour before and after the alert occurred (e.g., RAN’s SINR, transport network’s bit error rate, core network’s CPU utilization, etc.).
- • Node Type: HTTP
- • Node Name:
GET_CORRELATED_ALARMS - • Function: Calls the FM system’s API to obtain all active alarms for these network elements within the same time window.
- • Node Type: HTTP
- • Node Name:
GET_SERVICE_CONTEXT - • Function: Calls the Orchestrator/BSS API to obtain the detailed SLA commitment values for the slice.
Step 4: Retrieve Expert Knowledge
- • Node Type: Knowledge Retrieval
- • Node Name:
RETRIEVE_TROUBLESHOOTING_GUIDES - • Function: Uses the preliminary anomaly (e.g., “delay exceeds standard”) and the key alarm texts returned from
GET_CORRELATED_ALARMSas queries to semantically search the RAGKB knowledge base, finding relevant 3GPP specifications, device manuals, and historical optimal solutions.
Step 5: AI Root Cause Diagnosis (RCA)
- • Node Type: LLM
- • Node Name:
DIAGNOSE_ROOT_CAUSE - • Function: This is the core brain of the entire diagnostic process. It receives and integrates data from all previous nodes: slice topology, cross-domain KPIs, real-time alarms, SLA requirements, and expert knowledge. Guided by a prompt template tailored for RCA scenarios, the LLM acts as a “world-class network troubleshooting expert”, performing “Chain of Thought” reasoning, gradually analyzing evidence, ruling out possibilities, and ultimately outputting the most likely root cause, domain, confidence score, and detailed evidence chain in structured JSON format.
Step 6: Parse Diagnostic Conclusions
- • Node Type: Code
- • Node Name:
PARSE_DIAGNOSIS_RESULT - • Function: Parses the JSON returned from the previous LLM step, extracting the core diagnostic conclusions to prepare for generating solutions in the next step.
Step 7: Generate Solution Recommendations
- • Node Type: LLM
- • Node Name:
GENERATE_SOLUTION_RECOMMENDATIONS - • Function: This node receives the identified root cause. Under the guidance of a prompt that assumes the role of a “senior solution architect”, the LLM combines the official recommendations retrieved from the RAGKB to generate a prioritized list of solutions with detailed operational steps.
Step 8: Output Final Diagnostic Report
- • Node Type: End
- • Function: Integrates the diagnostic conclusions from
DIAGNOSE_ROOT_CAUSEand the solution recommendations fromGENERATE_SOLUTION_RECOMMENDATIONS, generating and presenting a complete root cause analysis (RCA) report that can be directly dispatched to the relevant operations team.
5. Sample RCA Report for 5G Network Slice
1. Report Summary
- • Report ID (RCA ID):
RCA-NSI-eMBB-Stadium-01-dfc2a198 - • Diagnostics Agent (Agent ID):
Diagnostics-Agent-007 - • Associated Alert (Alert ID):
AIOps-ALERT-NSI-eMBB-Stadium-01-dfc2a198 - • Diagnosis Completion Time:
2025-08-13 20:35 UTC
2. Diagnostic Conclusions
- • Root Cause: PCI Collision (Physical Cell ID Collision)
- • Domain: RAN (Radio Access Network)
- • Confidence Score: 95%
- • Summary: The cell located in the south stand of the venue
Cell-101(PCI: 42) collided with another macro cellCell-External-205(PCI: 42) located about 1.5 kilometers away under another gNodeB. During peak event times, due to signal leakage, users at the edge of the service area ofCell-101received identical PCI signals from both cells, causing severe downlink reference signal interference.
3. Evidence Chain
| Evidence Item | Source System | Discovery Details |
|---|---|---|
| Low SINR Value | AIOps Platform (RAN KPI) | The average SINR value in the affected area (coverage area of Cell-101) dropped sharply from a normal 18dB to 4.5dB during the alert period. |
| High TA Value Users | AIOps Platform (RAN KPI) | Under Cell-101, multiple users were detected with abnormally high TA (Timing Advance) values, indicating that these users were physically far away and should not be served by this cell. |
Handover Failure (Targeting Cell-101) |
AIOps Platform (RAN Signaling) | The failure rate of handover requests from neighboring cells to Cell-101 due to “wireless link failure” reached as high as 30%. |
| PCI Collision Alert | Fault Management (FM) | Two hours before the alert occurred, the SON (Self-Organizing Network) system generated a low-priority alert for a “potential PCI collision” involving PCI 42, but it was not addressed in time. |
| 3GPP TS 36.211 Specification | RAG Knowledge Base (RAGKB) | The specification clearly states that neighboring cells with the same PCI will cause reference signal confusion, leading to channel estimation failures and severe demodulation performance degradation. |
4. Solution Recommendations
Priority 1: Immediate Execution (Automation)
- • Solution: Trigger SON for PCI Replanning
- • Operational Steps:
- 1. Send a command to the SON system via API to automatically optimize the PCI for the cell cluster where
Cell-External-205is located. - 2. The SON system will automatically assign a unique PCI within the area for
Cell-External-205. - 3. Continuously monitor the SINR and handover success rate metrics of
Cell-101to confirm whether the issue is resolved.
Priority 2: Manual Execution (If Automation Fails)
- • Solution: Manually Modify the PCI of
Cell-External-205 - • Operational Steps:
- 1. Operations engineer logs into the RAN controller.
- 2. Query the list of unused PCI values in the area.
- 3. Change the PCI of
Cell-External-205from 42 to one of the available values in the list (e.g., 45). - 4. Verify whether the modification is effective and monitor related KPIs.
Report Generator: AI Trainer – Diagnostics Agent
6. System Extension Features
- • Integrate Optimization Agent: The output of this Diagnostics Agent can directly serve as input for the Optimization Agent, triggering automated repair processes, forming a complete loop of “monitoring-diagnosis-repair”.
- • Integration with Change Management System: For solutions requiring manual execution, a change request can be automatically created in the change management system (e.g., ServiceNow), with the RCA report attached.
- • Predictive Diagnostics: Combining historical data and trend analysis, proactively trigger the diagnostic process when indicators show early degradation trends before SLA breaches occur, upgrading from “fault diagnosis” to “risk prediction”.
- • Human-Machine Interactive Diagnostics: Allow NOC engineers to engage in multi-round conversations with the Diagnostics Agent through natural language, posing more specific query requests (e.g., “Compare the downlink PRB utilization trends of Cell-101 and Cell-102”), guiding the diagnostic process.
7. Data Structures Involved in the Case
Resource Management (RM) – Slice Topology Data Structure
Description: This is the starting point of the diagnostic process, defining the complex relationships between the slice instance and its constituent cross-domain network resources.
| Field Name | 中文名称 | Data Type | Comments |
|---|---|---|---|
SliceID |
Slice Instance ID | String |
Primary key, e.g., “NSI-eMBB-Stadium-01”. |
RanSubnet |
RAN Subslice | Object |
|
RanSubnet.Cells |
Service Cell List | Array[String] |
List of all cell IDs constituting this slice. |
RanSubnet.gNodeBs |
Service gNodeB List | Array[String] |
|
TransportSubnet |
Transport Subslice | Object |
|
TransportSubnet.Paths |
Transport Paths | Array[Object] |
Each object describes a path, including node and link IDs. |
CoreSubnet |
Core Network Subslice | Object |
|
CoreSubnet.UPF_ID |
UPF Instance ID | String |
|
CoreSubnet.SMF_ID |
SMF Instance ID | String |
CREATE TABLE `tabSliceTopology` (
  `name` varchar(140) NOT NULL,
  `creation` datetime(6) DEFAULT NULL,
  `modified` datetime(6) DEFAULT NULL,
  `SliceID` varchar(140) DEFAULT NULL,
  `TopologyData` json DEFAULT NULL, -- A JSON object containing the detailed structure
  PRIMARY KEY (`name`),
  UNIQUE KEY `slice_id_topo_unique` (`SliceID`)
) ENGINE=InnoDB;
(For other data structures such as slice KPI, service definitions, alarm data, etc., please refer to the author’s previous articles on “AI Monitoring Agents”, which will not be repeated here.)
8. Case Source Code
Dify Workflow YAML Source Code
# dify-workflow-telecom-monitor.yml
# Follow this public account (AI Trainer) and send a private message to obtain the Dify workflow YAML source code.
Workflow Code Node Code (Code-PARSE_TOPOLOGY_IDS.py)
import json

def parse_topology_ids(topology_json_str: str) -> dict:
    """
    Parses the slice topology JSON to extract lists of key network element IDs.
    """
    try:
        topology = json.loads(topology_json_str)
        ran_subnet = topology.get('RanSubnet', {})
        transport_subnet = topology.get('TransportSubnet', {})
        core_subnet = topology.get('CoreSubnet', {})

        # Extracting transport node IDs from paths
        transport_node_ids = set()
        for path in transport_subnet.get('Paths', []):
            for node in path.get('nodes', []):
                transport_node_ids.add(node['id'])

        return {
            "ran_cell_ids": ran_subnet.get('Cells', []),
            "ran_gNodeB_ids": ran_subnet.get('gNodeBs', []),
            "transport_node_ids": list(transport_node_ids),
            "core_nf_ids": [core_subnet.get('UPF_ID'), core_subnet.get('SMF_ID')]
        }
    except Exception as e:
        return {"error": f"Failed to parse topology: {str(e)}"}

def main(topology_data: str) -> dict:
    return parse_topology_ids(topology_data)
Workflow Prompt Words (Prompt-LLM-DIAGNOSE_ROOT_CAUSE.md)
# Role and Goal
You are a world-class Tier-3 5G Network Troubleshooting Expert. Your mission is to perform a rigorous, evidence-based Root Cause Analysis (RCA) on a 5G network slice SLA degradation event. You must act like a detective, using a Chain-of-Thought process to connect disparate data points and arrive at the most logical conclusion.

# Core Task
Synthesize the comprehensive data packet provided below to determine the single most likely root cause. You must output your findings in a structured JSON format.

# Critical Output Constraint
Your entire response MUST be a single, valid JSON object. Do not add any text before or after the JSON block. The JSON must contain the keys: "root_cause", "domain", "confidence_score", and "evidence_chain".

---
### Input Data Packet for Diagnosis

#### 1. Initial Alert
- **Alert ID**: {{#Start.alert_id#}}
- **Anomaly**: {{#GET_MULTI_DOMAIN_KPIS.abnormal_reason#}}

#### 2. E2E Topology
- **Slice Topology**:
{{#GET_SLICE_TOPOLOGY.body#}}

#### 3. Multi-Domain KPIs (at time of alert)
- **KPI Snapshot**:
{{#GET_MULTI_DOMAIN_KPIS.text#}}

#### 4. Correlated Alarms (from FM)
- **Active Alarms**:
{{#GET_CORRELATED_ALARMS.body#}}

#### 5. Expert Knowledge (from RAGKB)
- **Relevant Docs**:
{{#RETRIEVE_TROUBLESHOOTING_GUIDES.result#}}

---
### Your Task: Perform RCA and output JSON

Analyze all the data. Your Chain-of-Thought should internally cover:
1.  **Symptom Analysis**: What do the KPIs concretely show?
2.  **Hypothesis Generation**: Based on symptoms and knowledge, what are the possible causes across RAN, Transport, and Core?
3.  **Evidence Correlation & Elimination**: Use topology, alarms, and specific KPI values to confirm or deny each hypothesis.
4.  **Conclusion**: State the final root cause with a confidence score.

Now, provide your final answer in the required JSON format.
Dify Workflow External Interface
# Follow this public account (AI Trainer) and send a private message to obtain the Dify workflow external interface source code.If you find the content useful, please follow
and give a thumbs up, share, and recommend. Your support is my motivation for continuous updates.
Selected Previous Articles
(Part II: Monitoring Agent) AI Multi-Agent Collaborative Architecture in 5G Slicing Optimization(Part I: Top-Level Design) AI Multi-Agent Collaborative Architecture in 5G Slicing OptimizationTelecom Network AI Intelligent Operations Research Innovations and Implementation DirectionsRevealing: Why ChatGPT is Becoming ‘Smarter’ with You? The Answer Lies in These 5 StepsAI Multi-Agent Agent Collaborative New Play: Monitoring → Diagnosis → Optimization → Reporting Automation(Source Code Attached) First Public Release! Complete Technical Solution for Automated Repair of 5G Slices Based on AI Intelligent AgentHow to Build AI Diagnostics Agent to Ensure 5G Network Information Communication for Sporting EventsFrom American Telecom Giant Verizon to Middle Eastern Digital Carrier Etisalat, Global Operators are Replicating the 5G Slice AI Agent Monitoring ParadigmBest Practices for Self-Intelligent Networks: Building a New Intelligent Operations Paradigm for the Commercialization of 5G SlicesDesign Methodology and Case Studies of AI Intelligent Agents in Telecom Network Intelligent Operations AIOps(Source Code Attached) Dify+RAGFlow Building Intelligent Optimization AI Intelligent Agent for Telecom Transmission Network, Rapidly Achieving Network Fault Prediction and Automated OperationsEverything Can Be MCP: Teaching You How to Build MCP Services from Scratch, Making AI Intelligent Agents Instant Industry BrainsFrom Ticket-Driven to AI-Driven Paradigm Shift, Huawei’s AI Innovation Empowers the Evolution of OSS in the 5G EraWhen AI Intelligent Agents ‘Understand’ 3GPP Specifications, 5G Network Optimization Experts PanicBuilding AI+OSS Intelligent Agent Platform Compliant with TMF for Telecom Network Quality Optimization, Rapidly Generating Business Performance Optimization Plans, Achieving Intelligent Transformation from Passive Response to Proactive Prediction(Source Code Attached) Dify+RAGFlow Building Industrial Internet MCP Services and AI Intelligent Agents, Rapidly Achieving Predictive Maintenance for Pump Enterprises[50,000-word long article, including case studies] Based on DeepSeek Private Deployment RAGFlow Industry Knowledge Base and Intelligent Agent, Perfectly Achieving Knowledge Graph and Low-Code DevelopmentQwen3 Large Model AI Agent’s Secret Weapon for Mimicking ‘Human Memory’—Open Source Dynamic Knowledge Graph GraphitiHow to Rent Servers for Private Deployment of DeepSeek at Low CostLangChain+RAG+Agent Local Deployment of DeepSeek-R1 Commercial Grade Knowledge Base, Perfectly Achieving Low-Code Visual Process OrchestrationThrough the Llama Large Model Architecture Diagram, See Through the Principles of TransformersHow to Build Efficient AI Intelligent AgentsLlama 3.2 90 Billion Parameter Visual Multi-Modal Large Model Local Deployment and Case Demonstration