Go is a new generation programming language that combines the rapid prototyping advantages of Python with the performance benefits of C/C++. This characteristic makes it suitable for the embedded field as well, but what factors need to be considered to achieve optimal usage?
Generally speaking, the most important evaluation aspects for correct operation include the following:
- Efficient use of data structures and algorithms
- Optimizing critical paths
- Interaction with peripheral devices
- Concurrent tasks
- Memory management
The first two points are quite general; regardless of the programming language chosen, we should select efficient data structures and algorithms to optimize the main tasks that the embedded system needs to perform. For example, we generally want to avoid computations with O(n^2) time complexity or long blocks on certain system calls. Let’s focus on the latter three points.
1. I/O Operations
I/O management is a very important part.
Generally, there is no concept of non-blocking APIs in Go. In Go, io.Reader is one of the basic interfaces, which defines a blocking Read method. Therefore, when data needs to be read from a file descriptor or TCP connection, this Read method will block until data arrives or the stream is closed. In contrast, when programming in C++, we can read from multiple streams simultaneously until at least one of them becomes readable.
Let’s look at a simple example in C/C++:
#include <stdio.h>
#include <unistd.h>
#include <string.h>
#include <sys/poll.h>
int main(int argc, char **argv) {
    struct pollfd fds[1];
    // watch stdin for input
    fds[0].fd = STDIN_FILENO;
    fds[0].events = POLLIN;
    while (1) {
        const int timeout_msecs = 5000;
        const int ret = poll(fds, 1, timeout_msecs);
        if (ret <= 0)
            break;
        if (fds[0].revents & POLLIN) {
            char buf[32];
            memset(buf, 0, sizeof(buf));
            const int n = read(fds[0].fd, (void *)buf, sizeof(buf)-1);
            if (n < 0)
                break;
            printf("stdin has input data: %s\n", buf);
        }
    }
}
By using the poll system call, we can receive notifications about which file descriptors are readable (potentially multiple). Therefore, if we need to read data from multiple TCP connections, we can use the same thread to read non-blockingly, avoiding being blocked waiting on connections with no input data. Whenever new data is available, we can decide how to handle it, depending on where the receiving function is located, whether in the main thread or another concurrent thread.
If needed, to synchronize two threads, communication can also be done through mutexes or inter-process sockets.
Now, let’s look at the same example written in Go:
package main
import (
    "fmt"
    "os"
    "time"
)
func main() {
    ch := make(chan string)
    go func(ch chan<- string) {
        buffer := make([]byte, 32)
        for {
            n, err := os.Stdin.Read(buffer)
            if err != nil {
                close(ch)
                return
            }
            ch <- string(buffer[:n])
        }
    }(ch)
    for {
        select {
        case s, more := <-ch:
            if !more {
                return
            }
            fmt.Println("data from stdin:", s)
        case <-time.After(5 * time.Second):
            return
        }
    }
}
In the above example, a reading Goroutine is started, which only applies to one input stream. If we have more streams to read, we should start other Goroutines that run concurrently with the main loop. Thus, the execution flow of a Go program differs from that of C, allowing available CPU cores to be utilized more naturally. In this example, we also used a channel to send data to the main loop.
If data needs to be shared between different Goroutines, the available options are mainly channels or mutexes!
2. Concurrent Tasks
Suppose we need to receive data from multiple input TCP connections, with a main Goroutine responsible for data processing. As mentioned earlier, the idiomatic way to handle this in Go is to run a Goroutine for each TCP connection, as shown in the diagram below:
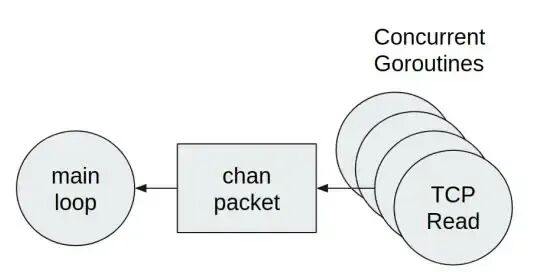
Each Goroutine runs the same code:
- Read data from the network.
- Decode the data into Go structures.
- Send the data packets to the main loop.
To communicate between each Goroutine and the main loop, channels need to be used. Additionally, each data packet received from the network is sent individually through the channel. This method is correct, but it is not efficient when a large number of packets are received. Each channel write operation incurs:
- Access to synchronization primitives, as channels are thread-safe.
- Processing a large number of read events in the receiving Goroutine.
As a result, the main loop cannot timely process each received packet. Generally, in such cases, using a slice of elements is a workaround that can help reduce the number of channel write operations:
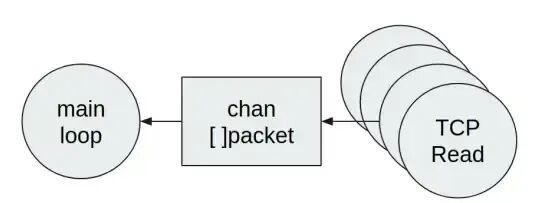
Therefore, if multiple packets are read from the network connection, it is acceptable to group them all into one slice and write the entire slice to the channel. Compared to the previous method, this solution is better if we want to reduce the latency between receiving packets and subsequent processing. However, the main drawback is related to increased pressure on Go’s garbage collector, as each slice will likely contain pointers to the packets, which will also be released by the GC.
3. Memory Management
The use of system memory is a very important aspect that needs to be strictly controlled when developing embedded Linux applications. Go has its own logic for performing garbage collection (GC), and as memory allocation increases, GC pressure also increases. This can lead to more frequent GC actions, potentially causing work pauses, i.e., a complete stop of the main execution flow. Therefore, GC may cause unexpected delays in embedded systems, which we want to keep below a certain threshold. Next, let’s look at how to limit the impact of GC.
1. Dynamically Allocate Elements Without Pointers
Let’s try to measure how much time GC spends in the following two tests:
A: Dynamically allocate elements without pointers.
B: Dynamically allocate elements with pointers.
package main
import (
    "fmt"
    "runtime"
    "time"
)
type A struct {
    value int
}
func testA() {
    arr := make([]A, 1e6)
    runGC()
    arr[0] = A{}
}
type B struct {
    value *int
}
func testB() {
    arr := make([]B, 1e6)
    runGC()
    arr[0] = B{}
}
func runGC() {
    t0 := time.Now()
    runtime.GC()
    fmt.Printf("test duration: %s\n", time.Since(t0))
}
func main() {
    testA()
    testB()
}
Output: (Tested in go1.20.7 environment!)
test duration:1.723175ms
test duration:4.26417ms
From the results, it is clear that GC scanning and releasing memory containing pointers takes more time.
Note: Some Go objects internally contain pointers. In these cases, we must be cautious when allocating structures that contain them.
2. Closures and Escape Analysis
Go allows the definition of anonymous functions, and more generally, the existence of closures. While the former typically does not cause performance issues, the latter may lead to performance problems.
A Go closure is essentially an object that captures the state that a function must operate on.
If a task heavily uses closures, the time for GC operations may again decrease.
Therefore, it is best not to use closures in the critical path of the program unless the compiler can avoid heap usage. This optimization is known as escape analysis, which determines whether some references escape their declaring function boundaries. If there are no escaping references, then the value can be placed on the function’s stack, thus avoiding further allocation and deallocation of memory. The rules of escape analysis are not part of the Go language specification, so they may change with version updates.
package main
import "os"
func adder(x, y int) func() int {
    return func() int {
        return x + y
    }
}
func main() {
    ret := adder(1, 3)()
    os.Exit(ret)
}
Output: (Verified on go1.20.7!)
$ go run -gcflags '-m' hello.go
# command-line-arguments
./hello.go:6:6: can inline adder.
./hello.go:7:9: can inline adder.func1.
./hello.go:12:14: inlining call to adder.
./hello.go:7:9: can inline main.func1.
./hello.go:12:20: inlining call to main.func1.
./hello.go:7:9: func literal escapes to heap.
./hello.go:12:14: func literal does not escape
exit status 4
We can see that the returned adder function is allocated on the heap memory.
This program can be rewritten by converting the closure into a “context” structure.
This rewriting method can avoid the closure being allocated on the heap, thus improving the program’s performance. By converting the closure into an object, better control over memory allocation can be achieved, enhancing program execution efficiency.
package main
import "os"
type context struct {
    x, y int
}
func (c context) Add() int {
    return c.x + c.y
}
func main() {
    ret := context{1, 3}.Add()
    os.Exit(ret)
}
By verification, we can confirm that now all values are allocated on the stack:(Verified on go1.20.7!)
$ go run -gcflags '-m' hello.go
# command-line-arguments
./hello.go:6:6: can inline context.Add.
./hello.go:9:6: can inline main.
./hello.go:10:29: inlining call to context.Add<autogenerated>:1: inlining call to context.Add
exit status 4
3. Logging May Have Performance Bottlenecks
In embedded systems, just like in any other systems, having informative or error prints is very important. Through logging, we can analyze the system’s operation and whether the software is functioning correctly. In Go, when we want to print messages, we can achieve this through functions in the fmt package. However, the definition of the Printf function is as follows:
func Printf(format string, a ...interface{}) (n int, err error)From a performance perspective, there are several issues, mainly related to the second parameter. In fact, the interface{} data type cannot be evaluated at compile time, leading to memory allocation and requiring the actual type to be determined at runtime. For example, we can see in the following example program that even constant values are moved to heap memory.
package main
import "fmt"
func main() {
    fmt.Printf("%d\n", 1)
}
Output: (Verified on go1.20.7!)
$ go run -gcflags '-m' hello.go
# command-line-arguments
./hello.go:3:6: can inline main.
./hello.go:4:15: inlining call to fmt.Printf.
./hello.go:4:15: ... argument does not escape.
./hello.go:4:24: 1 escapes to heap
In efficiently managing logs, zerolog can be used. Zerolog is a very useful library that allows setting the log level for each message. More specifically, if our program emits many debug messages, their impact will be very limited, almost negligible.
By performing escape analysis, we can prove that there is no dynamic allocation in the following program using zerolog.
package main
import "github.com/rs/zerolog/log"
func main() {  log.Info().Int("val", 1).Msg("")}
Output:
$> go run -gcflags '-m' foo.go
{"level":"info","val":1,"time":"2019-01-30T17:18:20+01:00"}
Finally, let me summarize. Thanks to Go’s concurrency model, the Go language can make better use of the latest CPU architectures.In terms of synchronization, using channels is the idiomatic approach, and it is best to achieve this by grouping the data to be written into slices. Mutexes are still useful, but care must be taken not to create bottlenecks between Goroutines. Additionally, especially for embedded applications, controlling the timing of garbage collection is very important. To reduce memory allocation, we can reuse slices that have been created or avoid using closures.
Your new batch of technical insights is on the way! Click [Follow] for smoother delivery!