//
The NIST Multi-TRL calibration technology in the United States implements precise calibration tests of on-chip scattering parameters (S parameters), but this calibration technology has not yet been realized domestically, resulting in the inaccuracy of on-chip measurements not meeting the requirements for precision testing. Based on a thorough study of the Multi-TRL algorithm and independently deriving relevant core formulas, the Multi-TRL calibration software CETC13 was developed, and the accuracy of the calibration software was validated. Then, using semiconductor processes, the design and fabrication of the 0.1~40GHz Multi-TRL calibration standard 1312 were carried out. Through optimization design of substrate thickness and cross-section, this calibration standard can effectively suppress multimode transmission. The measurement results of the on-chip system calibrated with CETC13 calibration software and calibration standards are comparable to those of foreign on-chip systems of the same level. In the 0.1~40 GHz frequency range, the transmission amplitude differs by 0.05~0.10dB, the phase differs by 0.05°~1.3°; the reflection amplitude differs by 0.002~0.007, which can solve the problem of precise calibration testing of on-chip S parameters domestically.
Before using the on-chip S parameter testing system (mainly referring to the vector network analyzer, abbreviated as VNA), it is necessary to apply on-chip calibration methods for vector calibration. Currently, the commercially available calibration methods are mainly divided into two types: The first type is the calibration method using lumped parameter components as calibration standards (such as SOLT, LRRM, etc.); The second type is the calibration method using coplanar transmission lines that transmit quasi-TEM waves (such as TRL). The accuracy of the first calibration method depends on the accuracy of the definition of lumped parameters, such as the capacitance of Open, the inductance of Short, and the resistance of Load. The calibration reference plane for this type of calibration method is at the probe end face, and the parasitic coupling components generated by the probe and calibration standards are difficult to model accurately, leading to limited calibration accuracy. The TRL calibration method uses easily fabricated transmission lines and large reflections that do not require value assignment as calibration standards. The definition of the calibration standard is the accurately measurable length of the transmission line, and the calibration reference plane is the middle of the straight-through transmission line, which reduces parasitic coupling and greatly improves calibration accuracy, but this is based on the premise that the system reference impedance is the characteristic impedance of the transmission line. The TRL calibration method itself cannot obtain the characteristic impedance of the transmission line, so it cannot correct system errors caused by inconsistencies in system characteristic impedance through impedance transformation. In addition, among all the above calibration methods, the impact of random errors such as the repeatability of the probe’s contact with the wafer cannot be ignored.
The National Institute of Standards and Technology (NIST) in the United States has researched this issue and proposed the Multi-TRL calibration technology around this century, developing the calibration algorithm Multical and producing the Multi-TRL calibration standard. The Multi-TRL algorithm can accurately define the characteristic impedance of transmission lines and reduce random errors during on-chip testing, thus being internationally recognized as the most accurate calibration method in on-chip VNA calibration. However, in contrast, the Multi-TRL calibration technology has not yet been applied domestically. This is firstly limited by the lack of calibration software and secondly by the absence of corresponding Multi-TRL calibration standards.
Based on the above issues, this paper conducts research on on-chip Multi-TRL calibration technology. Multi-TRL calibration software was developed, and Multi-TRL calibration standards were produced, and they were tested and compared with foreign research.
1 Multi-TRL Algorithm
The multi-line TRL calibration algorithm is based on the TRL calibration method, and they share the same 8 error models, as shown in Figure 1. The purpose of calibration is to obtain the propagation constant of the transmission line and the error terms of the on-chip measurement system (also known as calibration constants). The propagation constant is used to move the reference plane for microwave testing, while the system error terms are used to correct hardware imperfections and ultimately obtain the S parameters of the measured object. During the on-chip measurement process, the repeatability of the connection between the probe and the calibration piece is the main source of random errors, which includes the depth of contact between the probe and the calibration piece and slight positional offsets. Compared to the TRL calibration method that ignores these random errors, the multi-line TRL calibration algorithm considers the impact of random errors brought by the repeatability of the connection between the probe and the calibration piece, thus achieving higher calibration accuracy. Unlike the TRL calibration method, where one frequency point corresponds to two transmission line standards, namely the straight-through Thru and the transmission line line, the multi-line TRL calibration algorithm corresponds to all transmission line standards at one frequency point, obtaining multiple observed values of the quantity to be determined through certain calculations, and using statistical processing methods to obtain the optimal value.
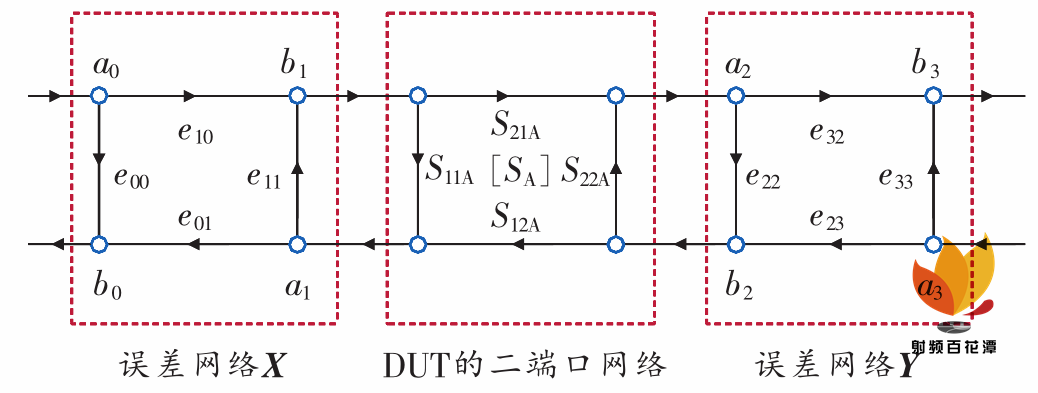
Figure 1 Signal flow diagram of the multi-line TRL calibration algorithm
1.1 Random Error Analysis
The transmission scattering matrix M i of the i-th transmission line standard measured by the VNA is

Where: T i — the actual transmission scattering matrix of calibration piece i;
X, Y — the error network transmission scattering matrix to be determined, referred to as calibration constants;
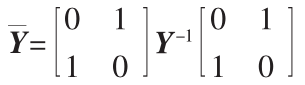 , the overline ” – ” indicates reversing the signal transmission direction.
If the connection between the transmission line standard and the probe is ideal, then the transmission scattering matrix T i of the i-th transmission line standard is

Where: γ — the propagation constant;
l i — the length of the i-th transmission line standard.
In fact, considering random errors such as the repeatability of contact between the probe and the calibration piece, T i is

Where: δ 1i — random error caused by non-ideal conditions at port 1;
δ 2i — random error caused by non-ideal conditions at port 2, both represented in the form of transmission scattering matrices.
Elements in δ 1i, δ 2i are very small, much less than 1.
Given the measurement results of any two transmission line standards, according to equation (1), we can obtain:
 Where:
 If random errors δ 1i, δ 2i do not exist, T ij can be simplified to L ij:
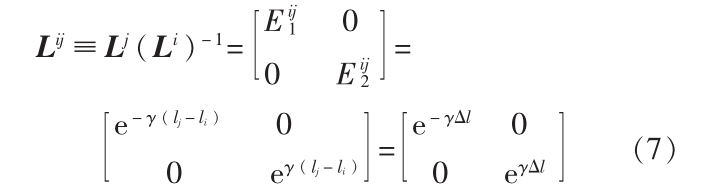
Since L ij is a diagonal matrix, from equation (4), it can be seen that at this time, the solving of the propagation constant and calibration constants is transformed into the problem of the eigenvalues and eigenvectors of the matrix, that is, the eigenvalues of M ij correspond to the diagonal values E ij 1, E ij 2 of T ij, from which the propagation constant can be derived; the eigenvectors of M ij are the column vectors of X, from which the calibration constants can be derived. Conventional TRL calibration solves according to this process.
However, in fact, due to the existence of random errors, the solving of the propagation constant and calibration constants becomes complicated. T ij is no longer a diagonal matrix, and the eigenvalues and eigenvectors of M ij cannot directly solve the propagation constant and calibration constants. Therefore, it is very meaningful to study the influence of these small random errors δ 1i, δ 2i on the eigenvalues and eigenvectors. In the actual calculation process, calculating the eigenvalues and eigenvectors of M ij is relatively easy, and they have a certain relationship with the eigenvalues and eigenvectors of T ij. Assuming V ij, Λ ij are the eigenvectors and eigenvalues of T ij respectively, then:
 Where U ij is the eigenvector of M ij:
From equation (9), it can be seen that M ij and T ij have the same eigenvalues, and their eigenvector relationship is as shown in equation (10). Therefore, the impact of random errors on T ij can be indirectly analyzed by studying their influence on M ij, that is, the influence on the eigenvalues and eigenvectors of M ij.
The first-order linear error equation between T ij and L ij is


Equations (11) and (12) provide a linear analysis of random errors in TRL calibration. The multi-line TRL calibration algorithm solves the linear measurement error equations of the propagation constant and calibration constants through ε ij, and then uses statistical processing methods to reduce the impact of random errors, improving calibration accuracy.
1.2 Linear Measurement Error Equation of Propagation Constant
According to equation (4), the ideal diagonal elements of T ij are M ij, and the eigenvalues of T ij are
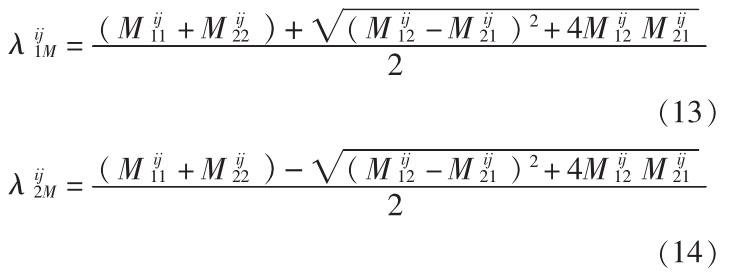 The eigenvalues of T ij are
In fact, considering random errors δ 1i, δ 2i, T ij is no longer a diagonal matrix, equations (13) and (14) are approximately equal to equations (15) and (16). Therefore, the eigenvalues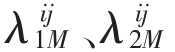 are distributed as
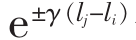 Determining how to judge
 is equal is the key to estimating the propagation constant, especially when the measurement errors caused by different transmission line attenuation or phase differences are much smaller than measurement noise.
Combining equations (13) to (16), we can obtain:
 Where λ ij is defined as
Through further derivation, the key solution for eigenvalue distribution is provided: that is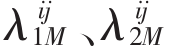 for
for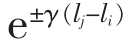 In the case of direct allocation and cross allocation, using equation (18) as the objective function, all possible values of the propagation constant are obtained, and the sum of the relative errors between these values and the estimated propagation constant γ est is taken as the final criterion, with the smaller one being the final distribution scheme.
Analyzing the impact of random errors on the propagation constant γ of the transmission line, quantitatively gives the relationship between the observed values and the estimated propagation constant γ and random errors, and solves the covariance matrix of measurement errors, obtaining:
 Solving the covariance of measurement error Δγ ij:
Where i, m, n represent the sequence number of the calibration piece.
1.3 Linear Measurement Error Equation of Calibration Constants
Analyzing the impact of random errors on the system calibration constants X, Y, quantitatively provides the relationship between the observed values and the estimated calibration constants X, Y and random errors, and solves the covariance matrix of measurement errors.
Assuming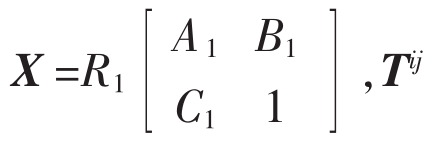 the characteristic vector V ij =
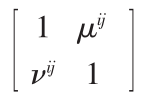 , the eigenvector of M ij
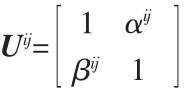 , further theoretical derivation gives:
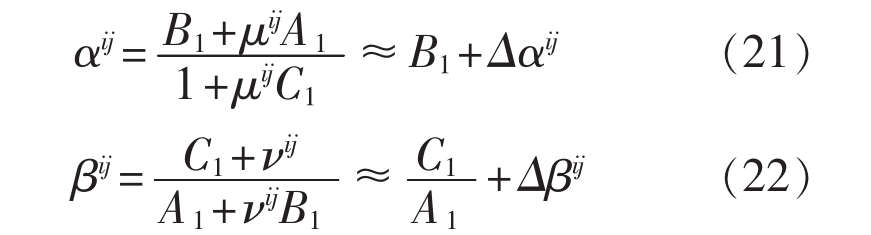 Where:
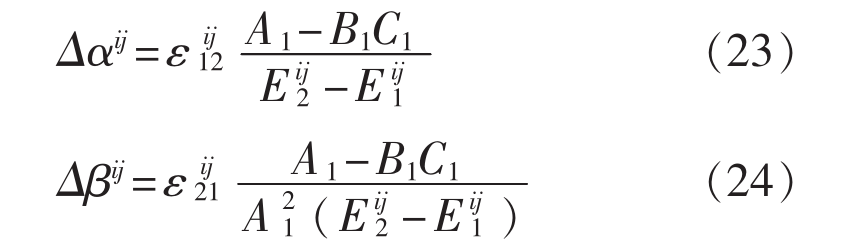 Then solving the covariance of Δα ij, Δβ ij:
In obtaining B 1 and C 1 /A 1, similar to the allocation of eigenvectors, four groups of eigenvectors are obtained from M ij, and the optimal solution is calculated by comparing with the estimated B 1 and C 1 /A 1 to find the smallest difference. Based on the measurement of the multi-line TRL calibration piece, the proportional coefficient R 1 and the value of A 1 can be solved from a pair of short circuits. The process of solving the calibration constant Y is similar to that of X.
1.4 Determination and Statistical Processing of Multiple Independent Measurements
At each frequency point, all transmission line standards are measured, and based on the principle of maximizing effective phase shift, a transmission line is determined as the common transmission line standard. In subsequent calculations, this common transmission line standard and other transmission line standards form N-1 line pairs, and their measurement results are calculated. The selection of the common line ensures that N-1 line pairs correspond to N-1 independent measurements of the quantity to be estimated. Then, each measurement result is statistically processed according to the Guass-Markou theorem, thus obtaining the best estimates of the propagation constant and calibration constants. In the actual calculation process, since the input quantity for selecting the common line is an approximate calculated quantity, it leads to discontinuities in the calculated propagation constant and S parameters in certain frequency bands. This paper has optimized this algorithm to some extent, which will be reported in subsequent articles.
2 Verification of Multi-TRL Algorithm and Development of Calibration Standards
2.1 Calibration Software Development and Algorithm Verification
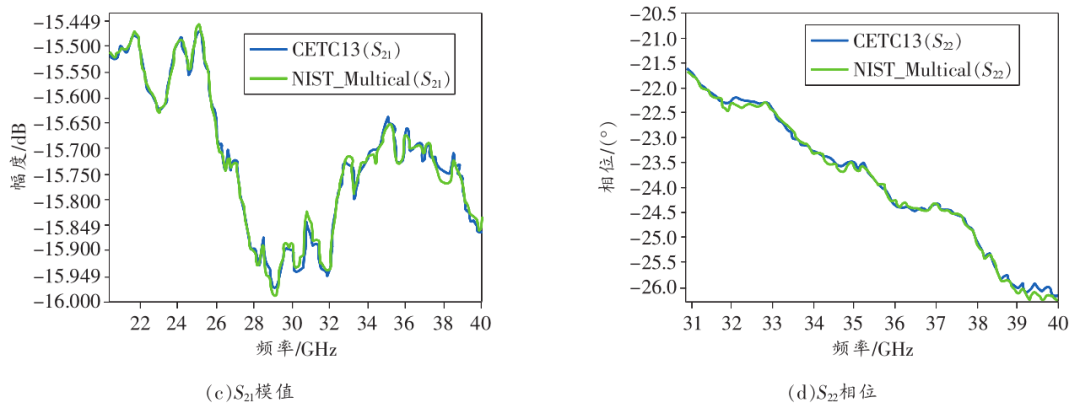
After deriving all formulas for the Multi-TRL algorithm, the corresponding calibration software CETC13 was developed. After inputting the same input quantities (including the original data of the Multi-TRL calibration standard, the definition of calibration standards, and the original data of the measured object) as the NIST_Multical software for comparison, the maximum difference in measurement results is shown in Figure 2 (partially displayed). The calculation results indicate that in the 0.1~40 GHz frequency range, the maximum difference in transmission amplitude is ±0.03dB, and the phase difference is below 0.3°. The maximum difference in reflection amplitude is 0.003, and the phase is below ±0.3°, proving the accuracy of the CETC13 software.
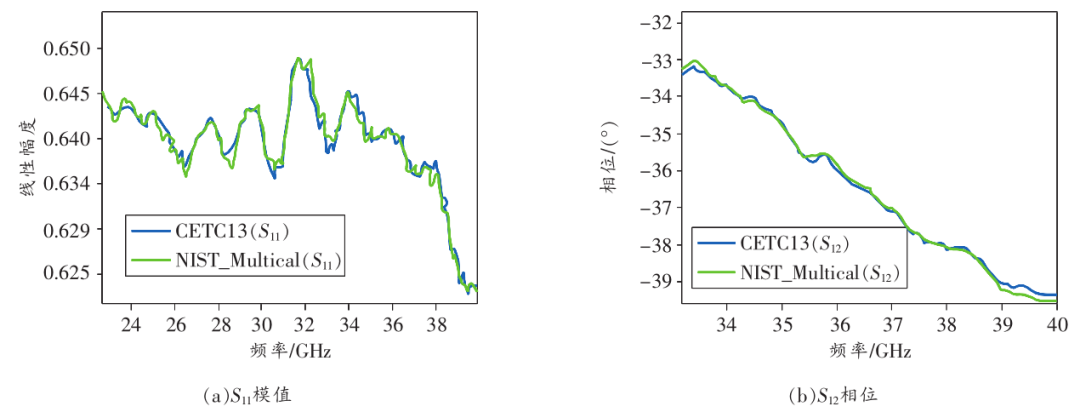
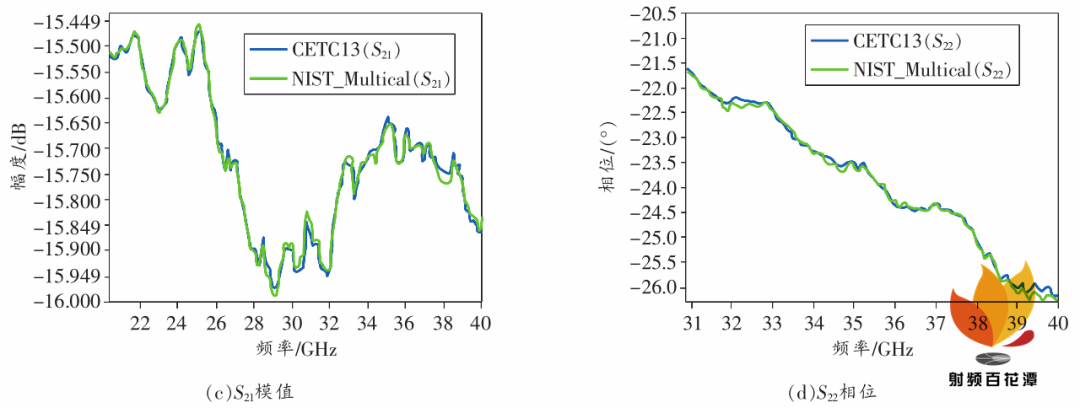
Figure 2 Comparison of CETC13 and NIST_Multical software
2.2 Development of Multi-TRL Calibration Standards
The Multi-TRL calibration standard developed in this paper covers a frequency range of 0.1~40 GHz, with the characteristic impedance of the transmission line designed for the high-frequency band at 50 Ω. It is important to note that the transmission mode on the transmission line should be as single-mode as possible, and to reduce dispersion during transmission, suppress resonance, surface wave modes, and waveguide modes. Due to the serious multimode transmission caused by microstrip transmission lines, the calibration standard adopts the form of coplanar waveguide transmission lines.
A total of multiple versions of the Multi-TRL calibration standard were made. Each version contains 5 transmission line standards with lengths of 610, 1,173, 3,129, 6,224, and 21,000 μm; 2 open standards, 2 short standards, and 2 measured resistors. After calibration, the S 21 measurement results of two of the transmission lines are shown in Figures 3 (a) and (b). The center conductor width of calibration standard 1 is 64μm, the spacing between the conductor and the ground is 40 μm, and the substrate is 100μm GaAs. The transmission line adopts electroplating technology, and then studies were conducted on different substrate thicknesses. Calibration standard 2 optimized the substrate thickness and adjusted the thickness of the transmission line and boundary conditions.
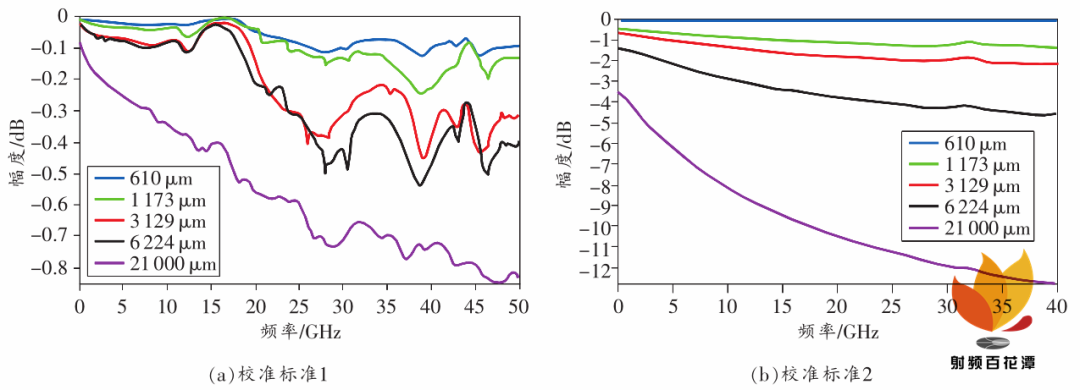
Figure 3 Measurement results of Multi-TRL calibration standardsFrom calibration standard 1, it can be seen that there are significant fluctuations in the transmission line, with severe multimode transmission, accompanied by resonance points and strong coupling points caused by surface waves. Calibration standard 2 increased the substrate thickness, optimized the boundary conditions, and adjusted the thickness of the transmission line, resulting in a very smooth transmission frequency response, effectively suppressing multimode transmission phenomena and resonances.
3 Data Comparison
The on-chip system calibrated with CETC13 calibration software combined with the self-developed calibration standard is referred to as measurement system 1. The on-chip system calibrated with the Multi-TRL calibration standard on the NIST-developed on-chip reference material RM8130 is referred to as system 2. Both systems simultaneously measure the 20 dB attenuator on RM8130, and the results are shown in Figure 4. In the 0.1~40GHz frequency range, the S 21 amplitude differs by 0.05~0.10dB, the phase differs by 0.05°~1.30°, and the S 11 linear amplitude differs by 0.002~0.007.
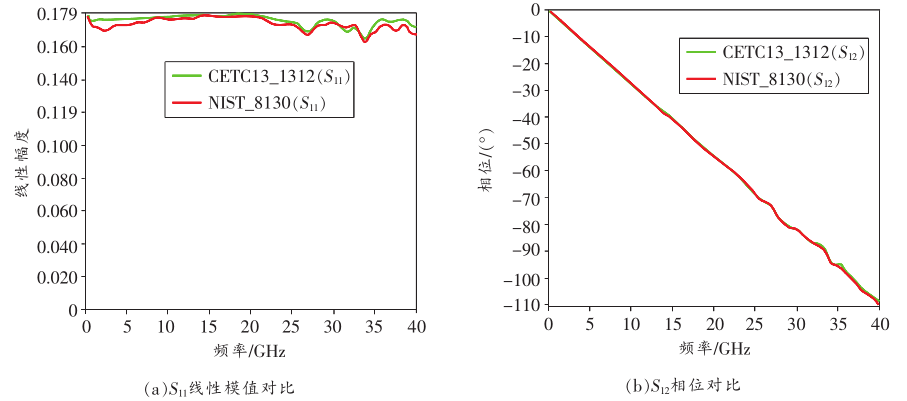
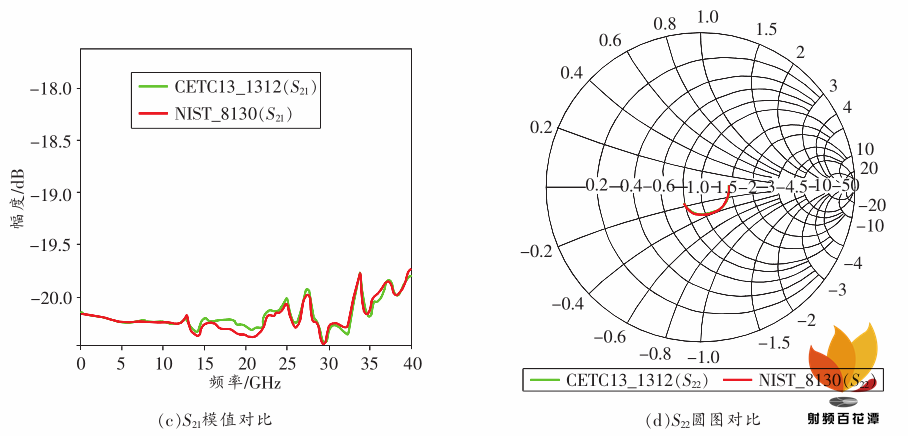
Figure 4 System measurement comparison
The raw data measured by system 1 was evaluated using the NIST uncertainty assessment software Microsoft Uncertainty Framework, with the S 21 expanded uncertainty in the range of 0.1~40GHz being 0.10~0.15dB, meeting the requirements for uncertainty validation.
4 Conclusion
This paper, based on an in-depth study of Multi-TRL theory, established an independent algorithm and developed the Multi-TRL software CETC13, while also producing the Multi-TRL calibration standard 1312 to suppress multimode transmission. The measurement results of the self-developed calibration software combined with the calibration standard compared to NIST show that in the 0.1~40GHz frequency range, the S 21 amplitude differs by 0.05~0.10dB, the phase differs by 0.05°~1.30°, and the S 11 linear amplitude differs by 0.002~0.007. Uncertainty validation indicates that the self-developed software and calibration standards can meet the needs for precise calibration testing of on-chip S parameter measurement systems.
Authors: Wang Yibang, Luan Peng, Sun Jing, Liu Chen, Wu Aihua, Liang Guo
Source: China Testing

Disclaimer:
This account maintains a neutral stance on all statements and viewpoints of original and reprinted articles, and the articles are provided solely for readers’ learning and communication. Copyright of articles, images, etc. belongs to the original authors.
For submissions/recruitment/promotion/advertising, please add WeChat: 15989459034