The oscilloscope is the most common instrument for electronic engineers, and many people compare it to the “eyes” of an engineer, which is enough to illustrate how important oscilloscopes are to engineers.
How is the signal displayed on the oscilloscope screen? On the oscilloscope, the signal is transmitted through a series of resistors and capacitors inside the probe. It then enters the oscilloscope, where the signal goes through an analog input signal modulation module. Depending on the size of the signal, it will be amplified or reduced accordingly to fall within the dynamic range of the analog-to-digital converter (ADC). The analog signal is converted into digital data (1s and 0s) in the ADC module. Meanwhile, the trigger module compares the signal with the specified trigger conditions. The trigger conditions inform the time base module when to capture the digital data and save it into the circular acquisition memory. The digital signal processing module (DSP) analyzes the digital data, reconstructs it into a waveform, and displays it on the screen.
For all oscilloscopes, once the signal is displayed on the oscilloscope, the next step is to perform the corresponding measurements. Oscilloscopes now have extremely rich built-in measurement functions, allowing engineers to quickly analyze the amplitude and time parameters of waveforms. Examples of these basic measurements include:
1. Measuring Analog Signals
Using an oscilloscope (Oscilloscope) can measure several important metrics of analog signals. Here are some common signal characteristics that oscilloscopes can measure:
-
Amplitude: Indicates the peak size of the signal. The oscilloscope can visually display the amplitude of the signal.
-
-
Frequency: Indicates the periodicity of the signal. By measuring the period or pulse width of the signal, the frequency can be determined.
-
Period: Indicates the time of one complete cycle of the signal.
-
Phase: Indicates the offset of the signal waveform relative to the reference signal. Phase is usually expressed in terms of angle or time delay.
-
Peak-to-Peak Value: Indicates the difference between the peak value and the valley value of the signal.
-
RMS Value: Indicates the effective value of the signal, equivalent to the DC value of the signal.
-
Harmonic Analysis: The oscilloscope can help analyze the harmonic components of the signal, displaying the fundamental wave and various harmonic orders in the signal.
-
Phase Difference: Used to measure the relative phase between two signals.
-
Waveform Shape Analysis: The oscilloscope can help analyze the shape of the signal waveform, detecting whether there is distortion or unusual waveforms.
-
Gain: The oscilloscope can help you measure the voltage gain of an amplifier circuit. By comparing the amplitude of the input signal and the output signal, you can calculate the voltage gain.
-
-
Frequency Response: The oscilloscope can be used to observe the response of an amplifier circuit at different frequencies. By changing the frequency of the input signal and observing the output, you can understand the bandwidth and frequency characteristics of the amplifier circuit.
-
Phase Response: The oscilloscope can help you measure the phase response of an amplifier circuit. This is very important for understanding the time delay of signals in the circuit.
-
-
Distortion Analysis: The oscilloscope can be used to detect signal distortion, such as clipping, shear, and cross distortion. This is helpful for determining the linear performance and accuracy of the amplifier circuit.
-
Cutoff Frequency: By changing the frequency of the input signal, you can use the oscilloscope to observe the behavior of the amplifier circuit near the cutoff frequency. This is particularly important for filtering amplifier circuits.
-
Stability Analysis: The oscilloscope can help you observe the stability of a circuit, especially for feedback circuits. You can check whether the output is stable, avoiding oscillations or overshoots caused by instability.
-
Noise Analysis: The oscilloscope can be used to detect noise in the amplifier circuit. This is very important for high-sensitivity applications and low-noise circuit design.
-
-
Overload Detection: The oscilloscope can be used to observe whether the amplifier circuit experiences overload when the input signal is large. This is helpful to ensure that the circuit can handle signals of various input amplitudes.
-
Slew Rate: By observing the fastest rise time and fastest fall time of the output signal, you can evaluate the rapid response performance of the circuit.
2. Measuring Digital Signals (This section is excerpted from the “Signal Integrity” public account)
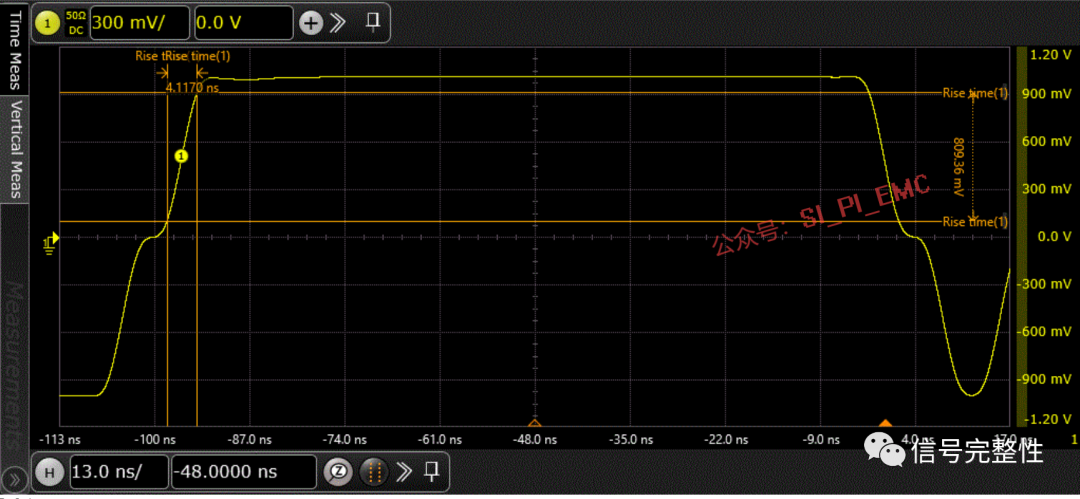
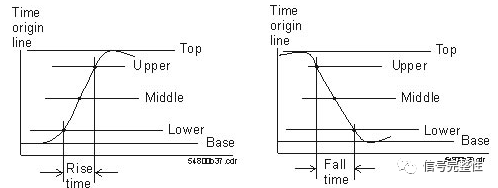
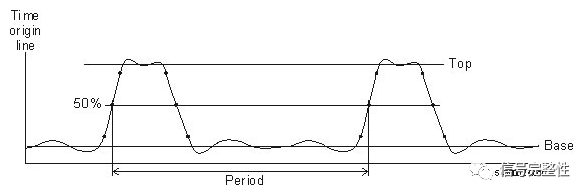
Rise Time: The rise time is the time at the upper threshold minus the time at the lower threshold of the edge you are measuring. The fall time is similar, i.e., the time at the lower threshold minus the time at the upper threshold of the edge you are measuring.
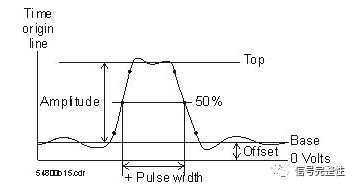
Pulse Width: The pulse width is the time from the middle threshold of the first rising edge to the middle threshold of the next falling edge.
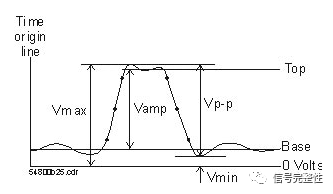
Amplitude and Other Voltage Measurements: This is the measurement of the amplitude displayed by the waveform. Typically, you can also measure peak-to-peak voltage, maximum voltage, minimum voltage, and average voltage.
Period/ Frequency: The period is defined as the time between two consecutive crossing points of the middle threshold voltage. Frequency is defined as 1/period.
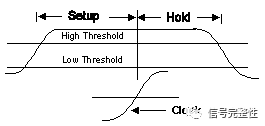
Setup and Hold Time: Setup time is the minimum time that data needs to remain stable before the clock edge arrives. Hold time is the minimum time that data needs to remain stable after the clock triggering event.
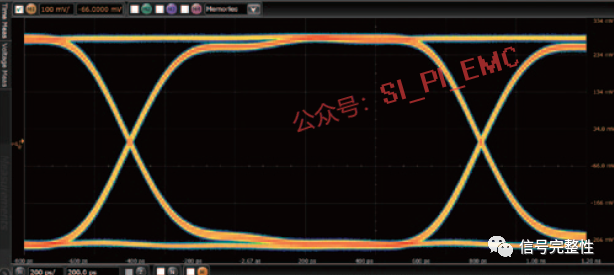
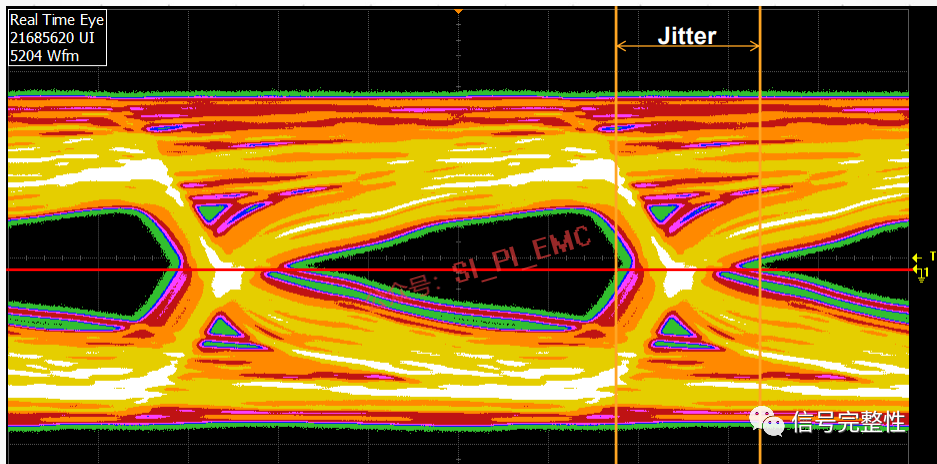
Eye Diagram: The eye diagram is simply the superimposition of a series of pulse signals (000, 001, 010, 011, 100, 101, 110, 111) received at the receiving end on a high-speed oscilloscope to form an eye diagram. If an eye diagram template is added, it can quickly assess whether the signal meets bus or system requirements.
There are many other measurements on the oscilloscope, such as duty cycle, offset, noise, jitter, and so on. Here, only some basic measurement concepts are provided.
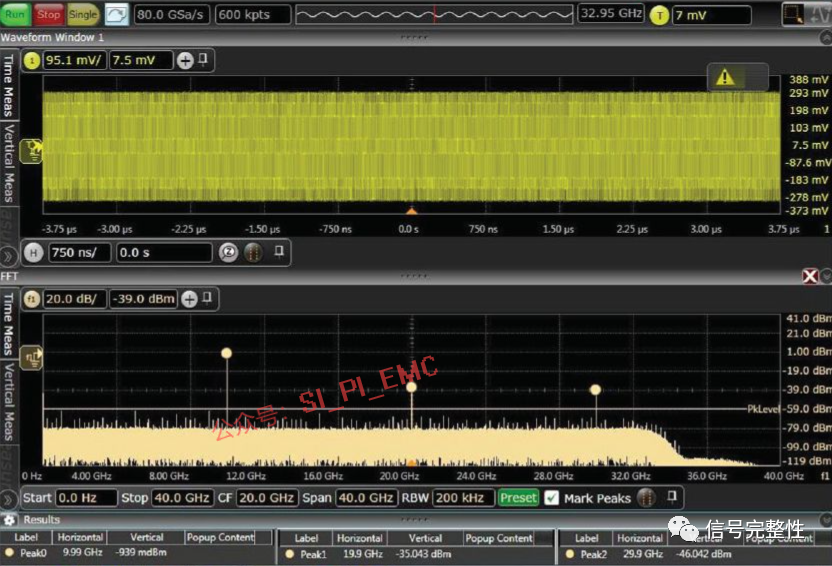
Traditionally, the parameters measured by oscilloscopes have been in the time domain, but with technological advancements, oscilloscopes have also diversified. Some oscilloscopes can also measure frequency domain parameters, especially during power integrity and EMC analysis, where time-domain signals are often converted into frequency-domain curves for analysis. Observing what frequency band has issues allows for targeted solutions.
3. Power Testing
Ripple and Noise Testing
The ripple of a switching power supply refers to the AC component superimposed on the output voltage of the switching power supply, with a frequency consistent with the switching frequency. Its cause is the ripple current of the switching power supply acting on the ESR of the capacitor. Noise generally refers to the AC component superimposed on the output voltage across the entire bandwidth.
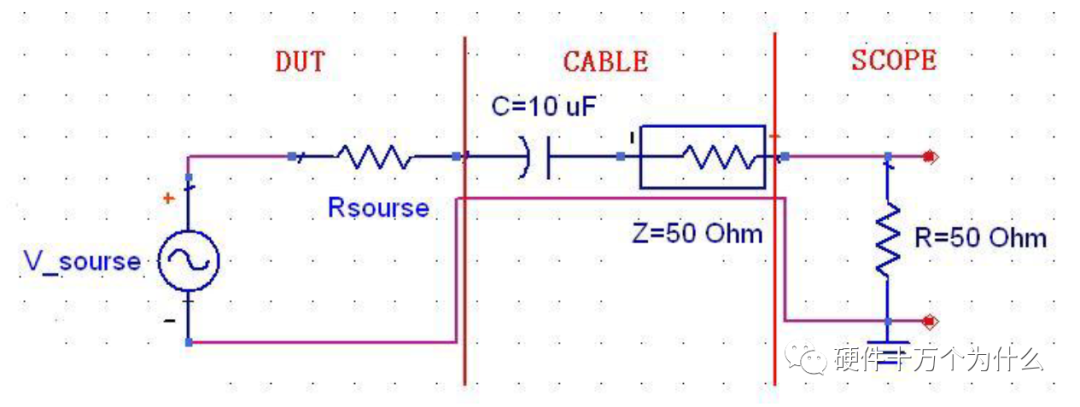
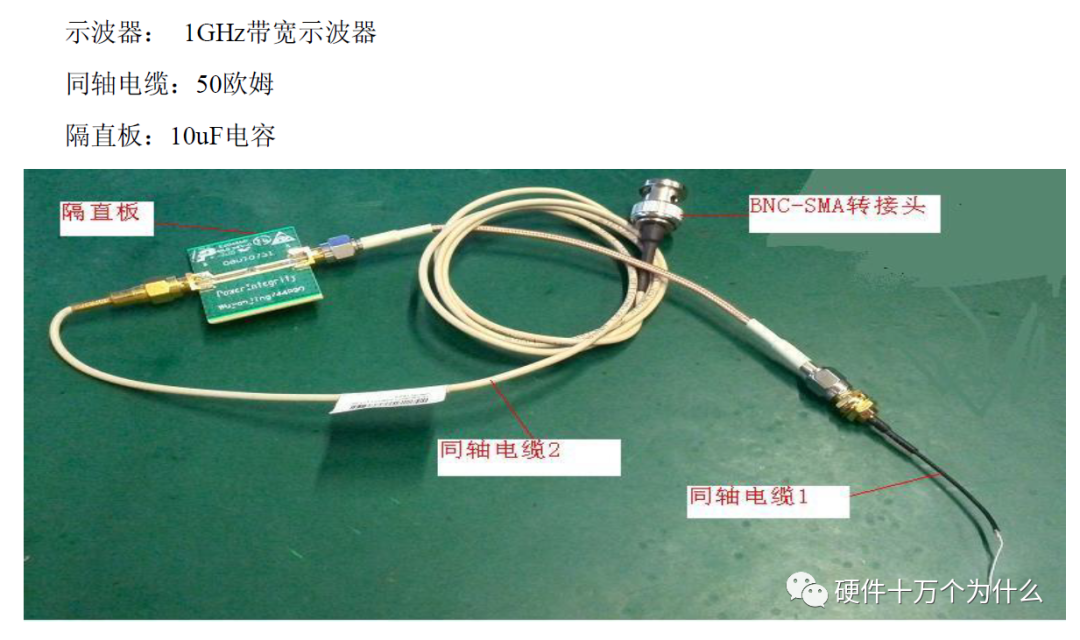
To measure ripple and noise, a decoupling board + coaxial cable is needed, and the capacitance of the decoupling board should be determined based on the switching frequency.
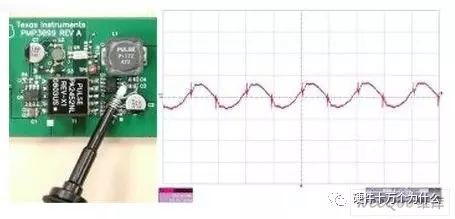
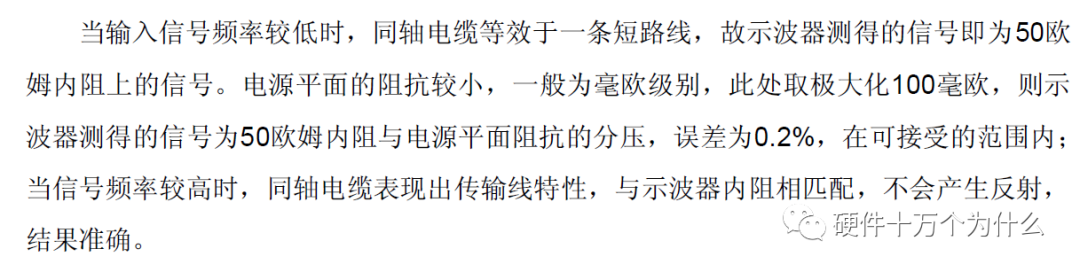
Ripple Measurement: Use a coaxial cable to lead the output from the power module to the decoupling board, and then connect it to the oscilloscope via another coaxial cable. Set the oscilloscope impedance to 50 ohms, AC coupling, and bandwidth limited to 20MHz, then perform measurement and reading. The measured waveform is generally approximately triangular.
Noise Measurement: Disable the bandwidth limit of the oscilloscope while keeping the other configurations the same, then perform measurement and reading.
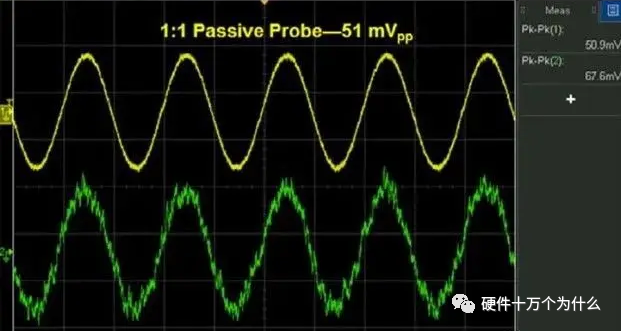
When testing ripple, we hope to measure accurately and do not want interference from other frequency bands to lead to abnormal test data. Therefore, when testing ripple with a coaxial cable or probe, the handling of the ground line is particularly critical, otherwise unnecessary noise may be introduced through the ground line.
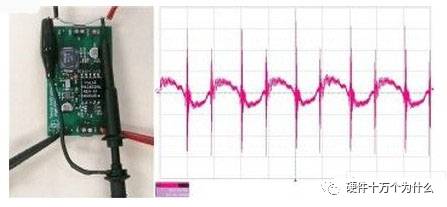
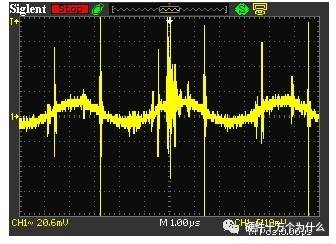
In the example shown in the figure, the tester made two mistakes. His first mistake was using an oscilloscope probe with a long grounding lead; his second mistake was placing the loop formed by the probe and the grounding lead near the power transformer and switching elements; his final mistake was allowing excess inductance between the oscilloscope probe and the output capacitor. This issue manifests as high-frequency pickup in the ripple waveform. In the power supply, there are many high-speed, large-signal voltage and current waveforms that can easily couple with the probe, including coupling from the magnetic field of the power transformer, coupling from the electric field of the switching node, and common-mode currents generated by the interwinding capacitance of the transformer.
The power ripple index of the DC/DC module is a very important parameter. A clean power supply is the prerequisite for the stable operation of digital circuits and an important guarantee for the parameters of analog devices. To determine the quality of the power supply, it is necessary to measure the output ripple of the DC/DC module. However, many people measure ripple values that easily exceed hundreds of mV, even several hundred mV, far exceeding the maximum ripple value provided in the device manual, mainly due to incorrect measurement methods.
Correct Measurement Method
1) Limit the oscilloscope bandwidth to 20MHz (most mid-range oscilloscopes are limited to 20MHz, while high-end products also offer a 200MHz bandwidth limit option) to avoid high-frequency noise from digital circuits affecting ripple measurement, ensuring measurement accuracy as much as possible.
2) Set the coupling method to AC coupling for convenient measurement (to observe ripple in finer detail, without caring about the DC level).
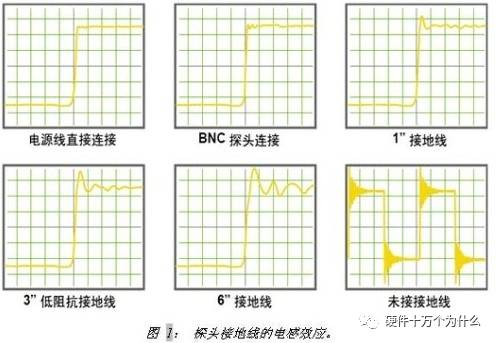
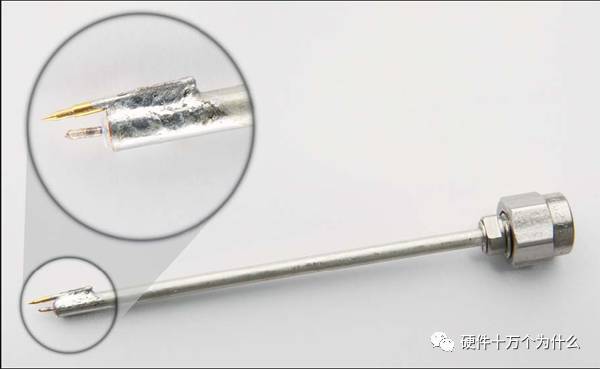
3) Ensure that the grounding of the probe is as short as possible (the main reason for measuring ripple exceeding hundreds of mV is the long grounding wire). Use the original short test pins that come with the probe as much as possible. If there are no test short pins, you can remove the grounding wire and shell of the probe, expose the probe’s ground shell, and make a custom grounding wire wrapped around the probe’s ground shell, ensuring the grounding wire length is less than 1cm.
4) The oscilloscope ground should be floating, only grounding the probe ground with the reference point of the test signal, and not grounding with the test device in any other way, as this will introduce significant ground noise into the ripple measurement. For example, when the oscilloscope shares a power strip with other instruments, the switches of other instruments may introduce noise interference through the ground line.
Long ground lines lead to significantly incorrect test results.
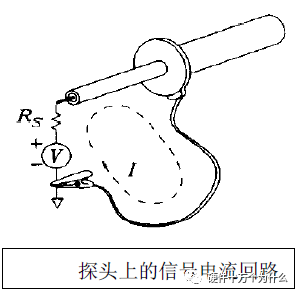
The distance between the probe’s GND and the two detection points is also very important. When the two points are far apart, a lot of EMI noise radiates into the signal loop of the probe (as shown in the figure below), causing the waveform observed by the oscilloscope to include other signal components, resulting in erroneous test results. Therefore, it is important to minimize the distance between the probe’s signal and ground detection points, reducing the loop area.
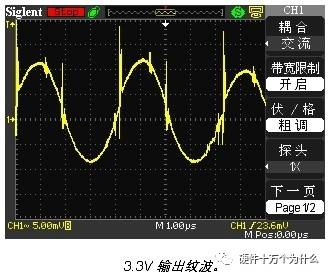
In isolated power supplies, a large amount of common-mode current flows through the grounding connection point of the probe. This creates a voltage drop between the power supply grounding connection point and the oscilloscope grounding connection point, which manifests as ripple. To prevent this issue, we need to pay special attention to the common-mode filtering of the power supply design. Additionally, wrapping the oscilloscope leads around a ferrite core also helps minimize this current. This forms a common-mode inductor that reduces measurement errors caused by common-mode currents without affecting differential voltage measurements. The figure below shows the ripple voltage of the same circuit using the improved measurement method. In this way, high-frequency peaks are genuinely eliminated.
1. If conditions allow, use the configuration of a decoupling board + coaxial cable, as coaxial cables can effectively suppress radiation in space.
2. If measuring solely with the oscilloscope, keep the ground clip as short as possible and wrap it around the probe, minimizing the loop; if conditions allow, wrap the oscilloscope lead around a ferrite core.
3. It is best to measure directly at the output pins of the power module.
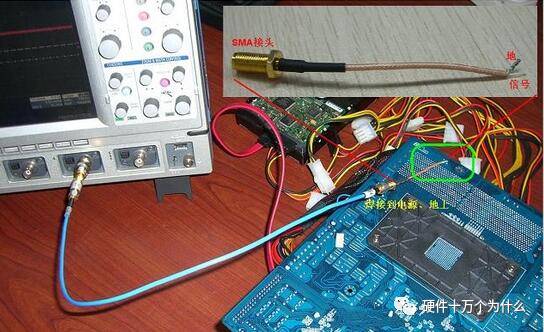
Using coaxial cables
Power ripple should be tested using coaxial cables.
The results of coaxial cable testing are more accurate and less affected by human factors (soldering onto a single board yields more stable results); the downside is that testing requires soldering, which can be time-consuming if there are many test points, and improper operation can damage the board.
The working principle diagram of coaxial cable testing is as follows:
Test Point Selection
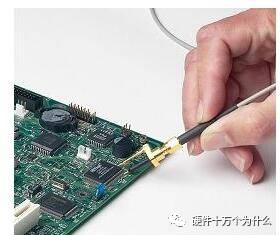
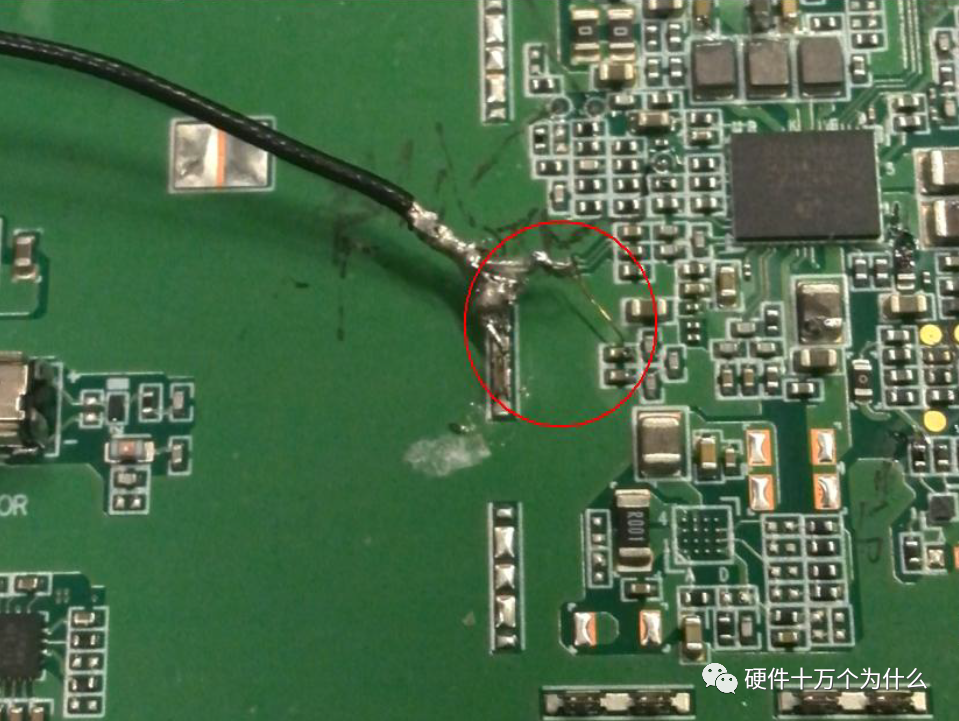
The soldering location should be selected near the filtering capacitor of the object being tested (i.e., as close to the chip pins as possible; if conditions allow, prioritize testing the capacitor on the back side, as close to the chip pins as possible to get a more accurate load condition). If there are empty solder pads, they can also be selected.
When testing, try to select small capacitors as test points; the capacitors currently used, especially BGA decoupling capacitors, are quite small, generally 0201. For convenience in testing, you can solder an enameled wire no longer than 0.5cm onto the cable, and the ground wire can be connected to the nearest ground.
If the power pins of the same network are scattered, generally try to select points close to the load and farther away from the power source. If the same network is dispersed around the chip, at least two points far from the power source should be selected for testing.
Oscilloscope Settings
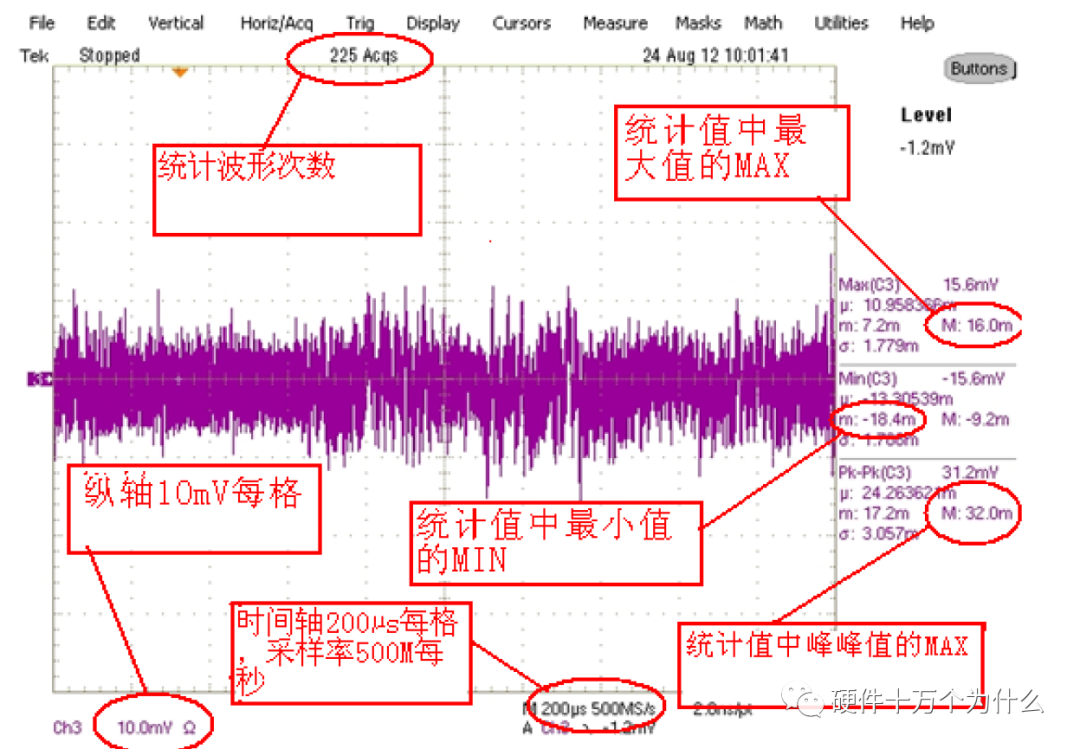
Interpretation of Test Items:
Test Item MAX: The maximum value in the current screen waveform.
Test Item MIN: The minimum value in the current screen waveform.
Test Item PK-PK: The peak-to-peak value in the current screen waveform.
Each test item in the figure has five values: the first value is the current screen value, the second value μ is the statistical average value from RUN to STOP, the third value m is the statistical minimum value from RUN to STOP, the fourth value M is the statistical maximum value from RUN to STOP, and the fifth value σ is the standard deviation, with Acqs representing the number of statistics.
Read the values of ripple MAX, MIN, and PK-PK (MAX PK-PK records the maximum value, MIN records the minimum value).
In the figure above, the PK-PK value of noise is 32mV, the MAX value is 16mV, and the MIN value is -18.4mV.
Power Loop Testing
In reality, feedback loops often play a role in stabilizing the static operating point of the circuit, so we cannot simply break the loop to measure loop gain. When the feedback loop is broken, the circuit will directly saturate due to input offset and other reasons, making it impossible to perform any meaningful measurements.
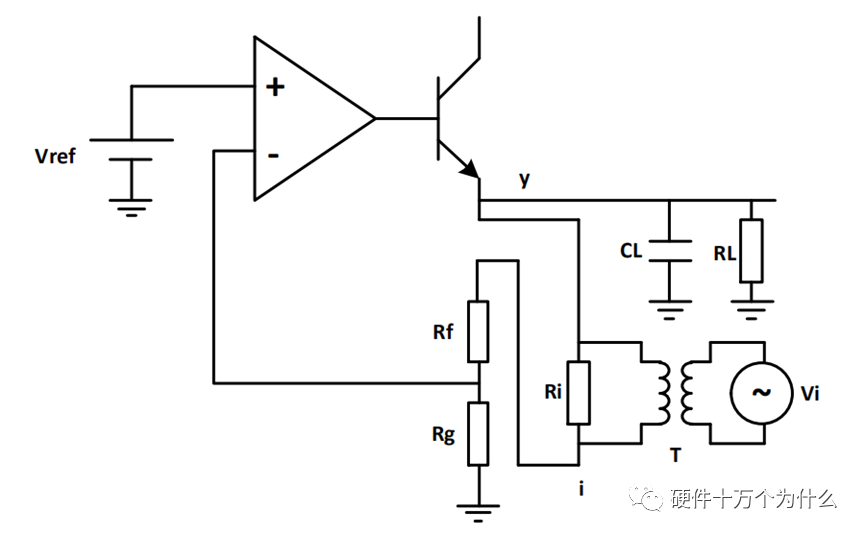
To overcome this issue, we must perform measurements under closed-loop conditions. One feasible method is loop injection. The figure below illustrates a typical loop injection method. To minimize errors as much as possible, we have special requirements for selecting the injection point, generally requiring the impedance looking in from one end of the injection point to be much greater than the impedance looking in from the other end. An ideal injection point is between the output and feedback network, and other injection points, such as between the error amplifier and power transistor, are also feasible.
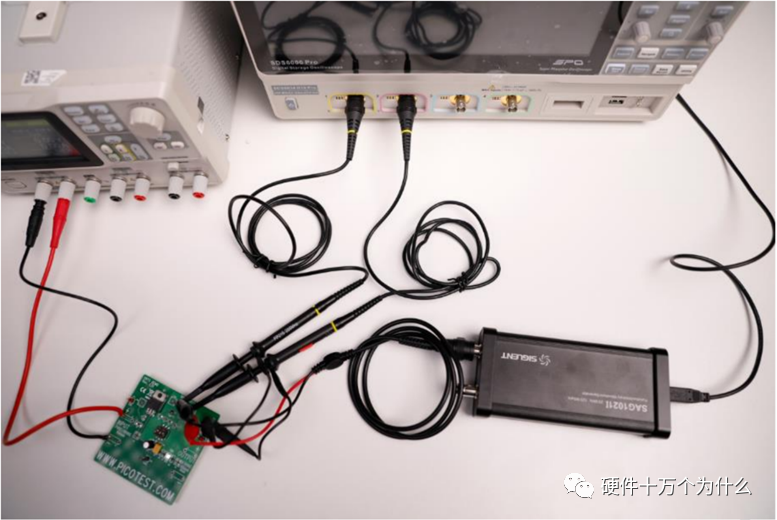
To maintain the closed loop, we insert a very small resistor at the injection point instead of breaking the loop at the injection point. The injection signal will be injected into the loop through this injection resistor. The value of this injection resistor should be small enough, usually much smaller than the equivalent impedance of the feedback network, so that the impact of the injection resistor on the feedback loop can be neglected. Picotest suggests using a 4.99Ω injection resistor when using the J2100A transformer or directly using the Siglent SAG1021I . A slightly larger injection resistor is also acceptable. On the other hand, because the injection resistor and injection transformer are in parallel, a smaller injection resistor can lower the lower frequency limit of the transformer, which is very useful when measuring extremely low frequencies. In principle, the injected signal should not affect the static operating point of the loop. To solve the problem of common grounding between the signal source and the device under test, it is often necessary to use an injection transformer or directly use an isolated signal source.
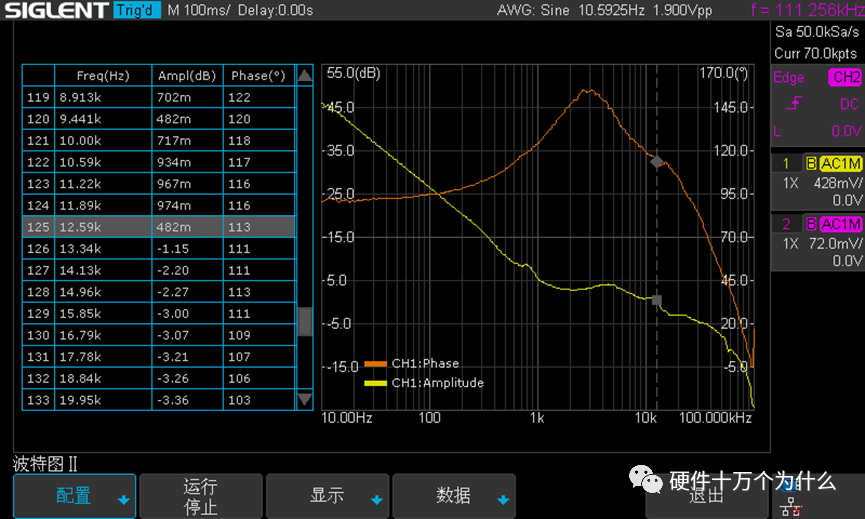
Test Result Analysis
1A Load: 0 gain, crossover frequency around 1.4k, phase margin around 99°, power supply system stable.
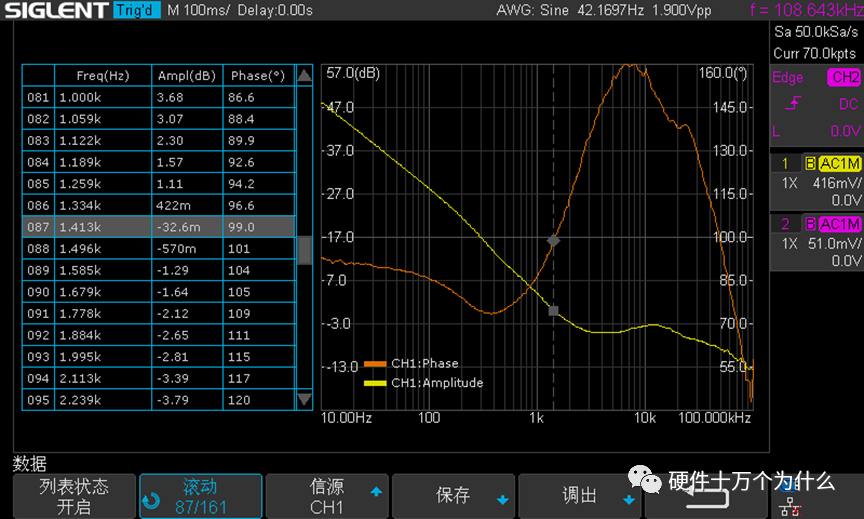
5A Load: 0 gain, crossover frequency around 12.6k, phase margin around 113°, power supply system stable.
The role and working principle of the oscilloscope probe
Usage and principles of the oscilloscope
Oscilloscope probes
Usage and principles of the oscilloscope
Oscilloscopes can also test “power loop stability”
Principles of the oscilloscope and the six basic principles of capturing signals
How are oscilloscope probes compensated and calibrated?
Factors to consider when choosing an oscilloscope
The significance of the oscilloscope’s low intrinsic noise for high-speed eye diagram testing
Summary of oscilloscope knowledge
Seven common mistakes to avoid when measuring with an oscilloscope