May 2020

Introduction to the Equipment
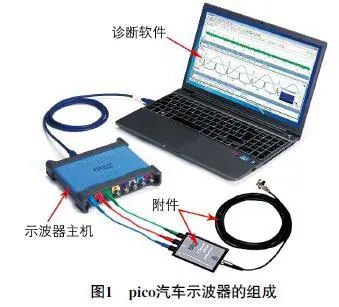
The pico automotive oscilloscope perfectly combines hardware and software, making it one of the most advanced automotive fault diagnostic devices available today. As shown in Figure 1, it mainly consists of the oscilloscope host (such as pico scope 4425, pico scope 4823, etc.), diagnostic software (pico scope 6 automotive and pico diagnostics), and related accessories (various test leads, probes, sensors, etc.). It can be used to collect and analyze various signals from vehicles, helping automotive repair technicians improve diagnostic efficiency.
Skill 1: Measuring Various Signal Waveforms
It can measure various voltage, current, and pressure signals as they change over time, and display them on the pico scope 6 automotive diagnostic software. Below are some signal waveforms that are frequently measured during automotive fault diagnosis.
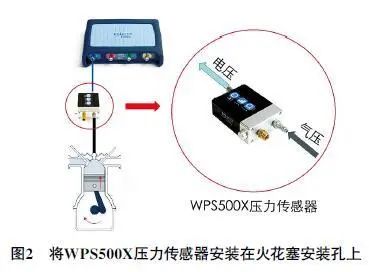
(1) Pressure waveforms, such as cylinder pressure, fuel pressure, vacuum tube pressure, exhaust pulsation, intake pulsation, and crankcase pulsation. The accessory used to measure pressure waveforms is the WPS500X pressure sensor. For example, installing the WPS500X pressure sensor in the spark plug hole (Figure 2) can measure the cylinder pressure waveform (Figure 3), and installing it at the end of the exhaust pipe (Figure 4) can measure the exhaust pulsation waveform (Figure 5).
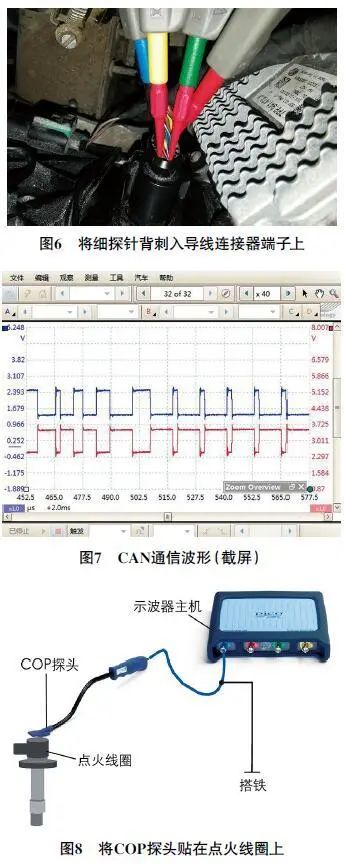
(2) Voltage waveforms, such as component power supply, sensor signals, bus signals, fuel injection signals, and ignition signals. The accessories used to measure voltage waveforms include test leads, fine probes, and COP probes. For example, inserting the fine probe of the test lead into the terminal of the wire connector (Figure 6) can measure the voltage signal at the terminal “online.” If the terminal is a CAN bus terminal, the waveform measured will be the CAN bus waveform (Figure 7); placing the COP probe on the ignition coil (Figure 8) can measure the COP ignition waveform (Figure 9).

(3) Current waveforms, such as the working current of starters, motors, and electromagnetic valves. The accessory used to measure current waveforms is the current clamp; simply clamp the current clamp around the wire (Figure 10) to measure the current in that wire. Figure 11 shows the starter current waveform measured during a relative compression test.


Skill 2: Measuring Signal Combination Waveforms
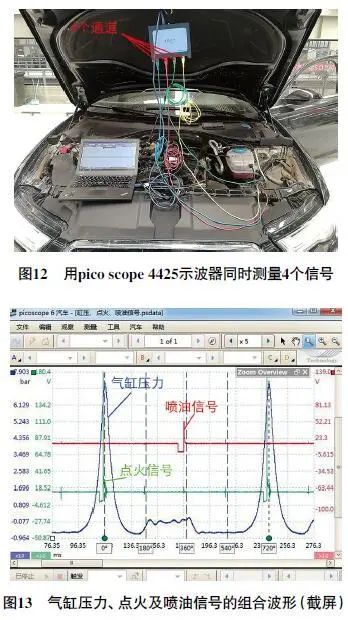
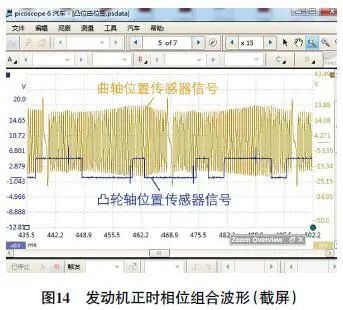
The oscilloscope channels refer to the number of signals that the oscilloscope can measure simultaneously. A 2-channel oscilloscope can measure up to 2 signals simultaneously, while a 4-channel oscilloscope can measure up to 4 signals simultaneously, and so on. For example, the pico scope 4425 oscilloscope (Figure 12) is a 4-channel oscilloscope that can measure 4 signals simultaneously. Measuring multiple signal waveforms (i.e., signal combination waveforms) allows for fault analysis from different angles and helps understand the relationships between related signals. For instance, by analyzing the combination waveform of cylinder pressure, ignition, and fuel injection signals (Figure 13), one can determine whether the ignition and fuel injection timing is correct; by analyzing the engine timing phase combination waveform (Figure 14), one can judge whether the engine valve timing is correct.
Skill 3: Powerful Software Analysis Functions
The various signal waveforms collected using the pico automotive oscilloscope can be analyzed with pico diagnostics software, which has many functions such as rulers, math channels, serial decoding, etc., facilitating comprehensive analysis of various signal waveforms by repair personnel. Below are the key functions of the angle ruler and math channel.
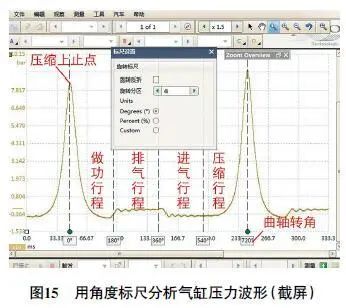
(1) The angle ruler can correlate the signal waveform with the mechanical movement of the engine for analysis, which is crucial for diagnosing engine faults. For a 4-stroke engine (intake stroke, compression stroke, power stroke, and exhaust stroke), the crankshaft completes one working cycle after rotating 2 turns, i.e., 720°, with each stroke corresponding to 180° of crankshaft rotation. The waveform shown in Figure 15 is the cylinder pressure waveform of a certain cylinder (since measuring the cylinder pressure waveform requires removing the spark plug of that cylinder and installing the WPS500X pressure sensor in the spark plug hole, the mixture in that cylinder does not ignite and work, thus the crankshaft drives the piston up and down), displayed on the pico scope 6 automotive diagnostic software. During the engine’s 4 strokes, when the piston is at the top dead center of compression, the pressure in the cylinder is at its maximum, hence the peaks of the cylinder pressure waveform correspond to the top dead center position. As the piston moves from one top dead center position to the next, it completes one working cycle, corresponding to 720° of crankshaft rotation. Therefore, marking the angle ruler between two consecutive peaks of cylinder pressure as 720° of crankshaft rotation and dividing it into 4 intervals, each corresponding to 180° of crankshaft rotation, facilitates the analysis of the cylinder pressure waveform for each stroke. The changes in cylinder pressure for each stroke are related to the position of the piston and the states of the intake and exhaust valves, so using the angle ruler to analyze the cylinder pressure waveform can indicate whether the opening and closing times of the intake and exhaust valves are correct. The opening and closing times of the intake and exhaust valves are determined by the engine valve timing, so analyzing the cylinder pressure waveform with the angle ruler can also help judge whether the engine valve timing is correct.
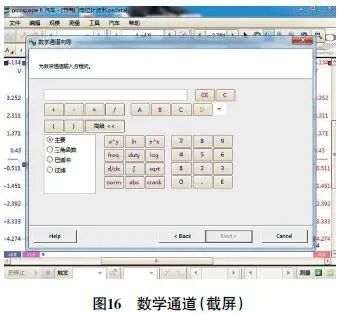
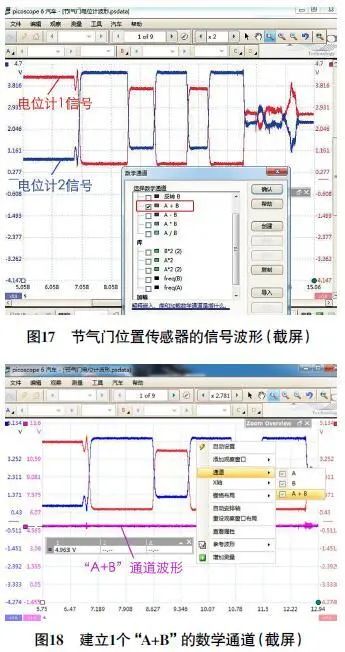
(2) Using the math channel (Figure 16), one can analyze not only some data of a single signal waveform (such as duty cycle, frequency, etc.) but also the relationships between multiple signal waveforms. Figure 17 shows the signal waveform of the throttle position sensor, where the red waveform is the signal waveform of potentiometer 1 (channel B), and the blue waveform is the signal waveform of potentiometer 2 (channel A). Under normal circumstances, the sum of these two potentiometer signals is about 5 V and relatively stable. By using the math channel to create an “A+B” channel (Figure 18, where the purple waveform is the “A+B” channel waveform), it can be observed that the sum of the two potentiometer signals is indeed about 5 V and relatively stable. If the sum of the voltages is not 5 V at a certain moment and fluctuates significantly, it indicates that there is an error in the relationship between the two potentiometer signals, possibly due to an abnormality in one of the potentiometer signals.
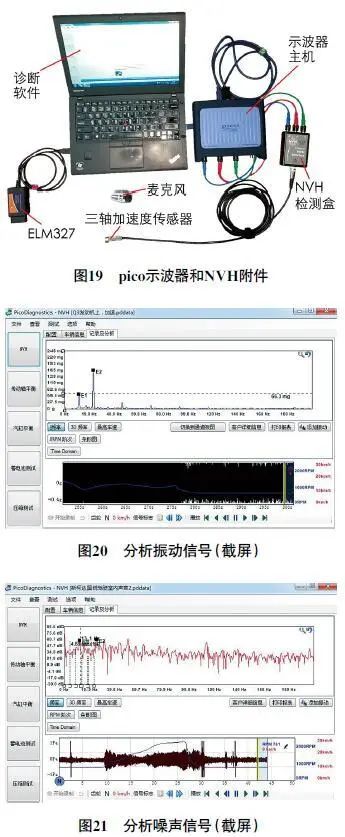
Skill 4: NVH Diagnosis
Noise and vibration faults are challenging issues in automotive faults. Most automotive repair technicians can only analyze faults through physical perception, which is subjective and related to individual sensitivity, making it difficult to pinpoint the sources of noise and vibration. Currently, using the pico oscilloscope combined with NVH accessories to diagnose vehicle noise and vibration faults is a more scientific diagnostic method. As shown in Figure 19, NVH accessories mainly include NVH detection boxes, microphones, and tri-axial accelerometers. The microphone is used to collect noise signals, while the tri-axial accelerometer is used to collect vibration signals. The collected noise and vibration signals are analyzed using pico diagnostics software (Figures 20 and 21), facilitating accurate fault source localization.