The ‘Lifesaver’ of Industrial Communication! How the Naisun Automation Profibus Fiber Converter Ensures Stable Remote I/O Connections
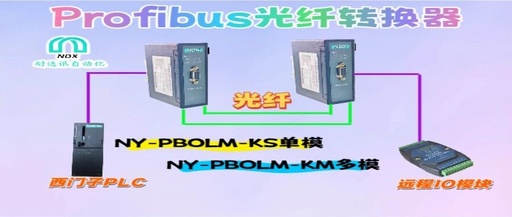
In industrial settings, have you ever encountered the dilemma where remoteI/O modules are just a hundred meters away, yet due to electromagnetic interference, the data fluctuates? When production lines are too long, frequent packet loss occurs with copper cables, leading to downtime losses of tens of thousands? Don’t worry, today we will unveil theNaisun AutomationProfibus … Read more