I’m not sure how everyone prints debugging information during microcontroller development, but most likely, it’s done through serial debugging. In most cases, a serial port is reserved for debugging during board design and coding.
But what if you haven’t reserved a serial port during actual development? Actually, our downloader can be used as a debugging printer; it’s just that many people are unaware of this feature. Today, I will explain how to use the JLink debugger to print information.
1. JLink Emulator Debugger
There are various downloaders available, but I only use JLink, which is compact and portable. For microcontroller developers, the most commonly used downloaders are JLink and ST-Link. These two have similar functions; JLink is from SEGGER, and ST-Link is from ST, which only supports ST series chips. I prefer the JLink downloader for debugging because it is small, has only four wires, and is extremely convenient to use. YYDS!
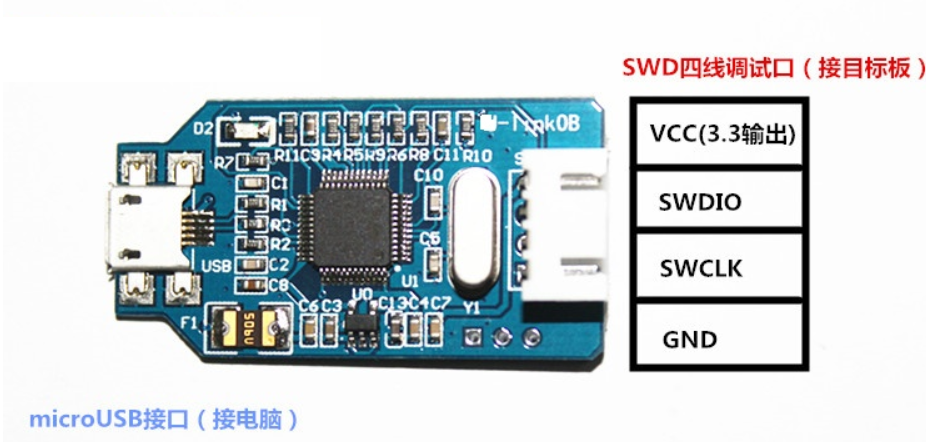
2. Install JLink Driver
Download link: https://www.segger.com/downloads/jlink/. After purchasing the JLink driver, the seller generally provides the driver program. Once the driver is installed, you can start downloading debugging programs.
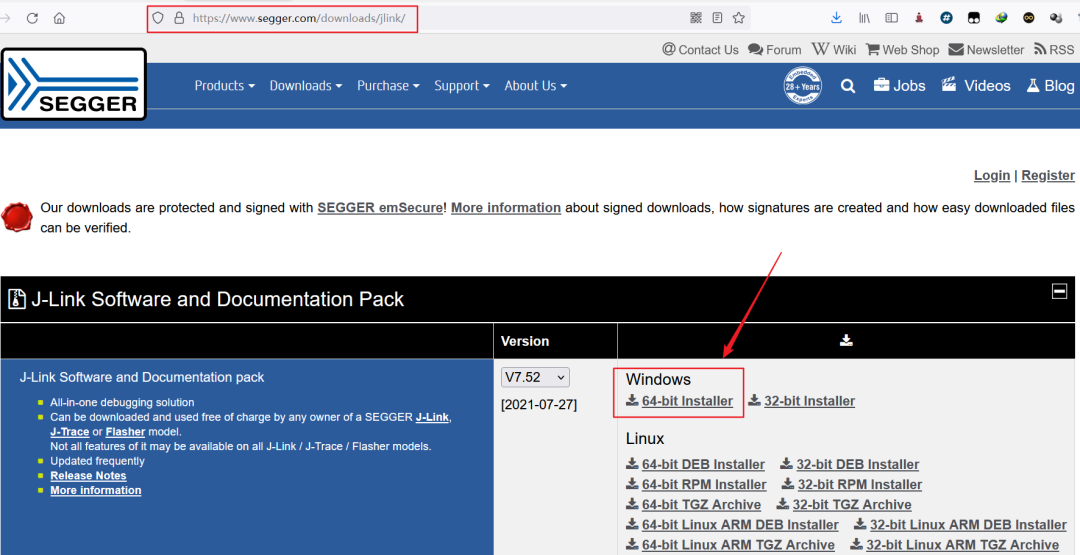
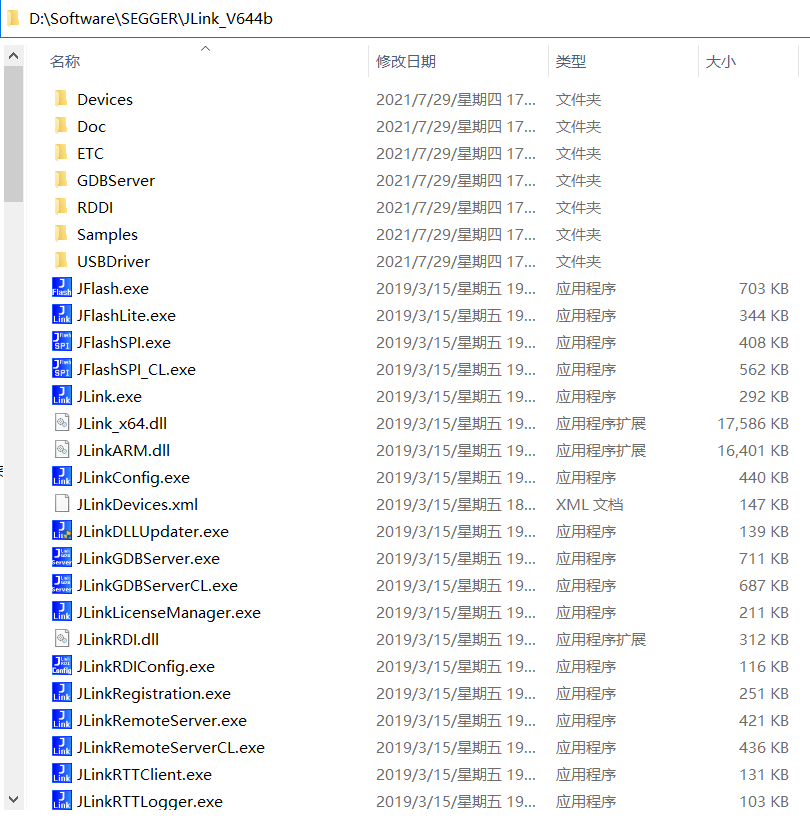
Of course, to use the JLink RTT function (Real Time Transfer, not the RT-Thread operating system ), you need to download the complete JLink package from the official website. The latest version is V7.52, but other versions are also acceptable. Once downloaded, just install it directly. After installation, you will see the following content in your installation directory:
3. Porting RTT
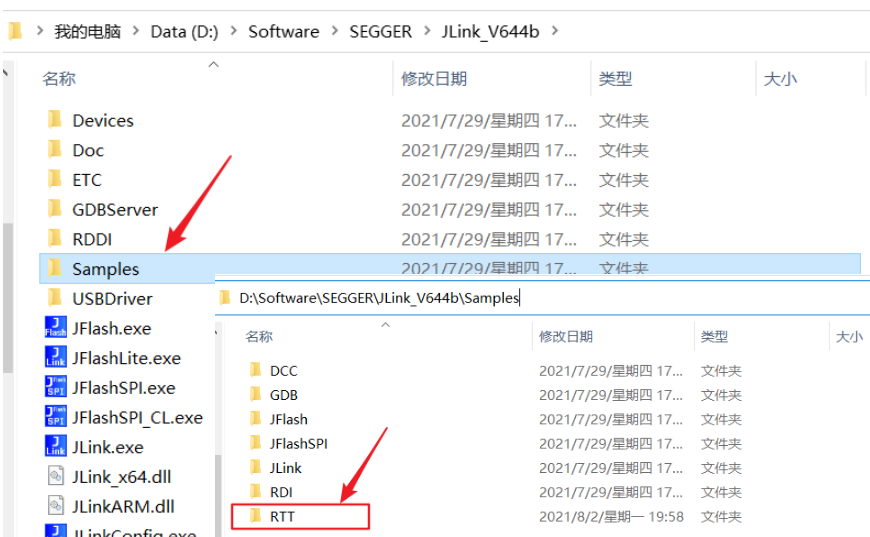
Once the installation is complete, it’s easy. The RTT source package is located in the directory of the JLINK driver we just installed. My directory is:<span>D:\Software\SEGGER\JLink_V644b\Samples\RTT</span>
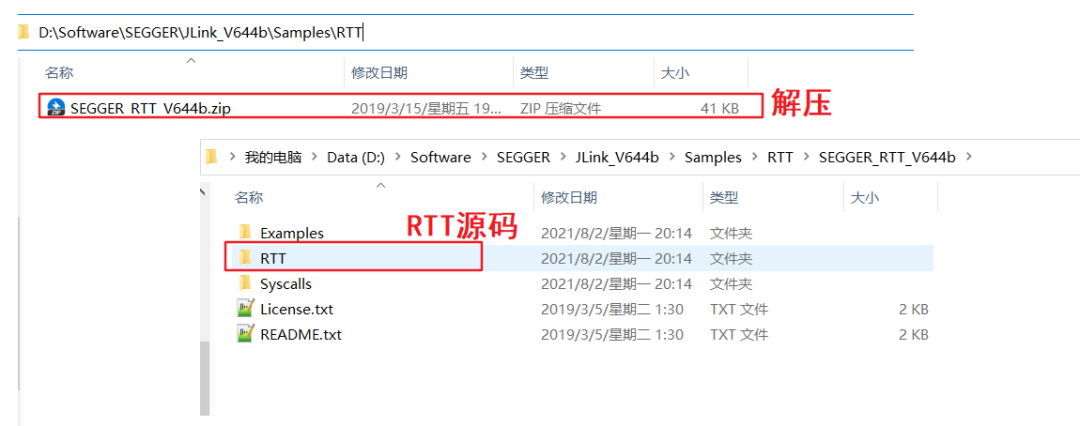
After extraction, the specific directory is:<span>D:\Software\SEGGER\JLink_V644b\Samples\RTT\SEGGER_RTT_V644b\RTT</span>
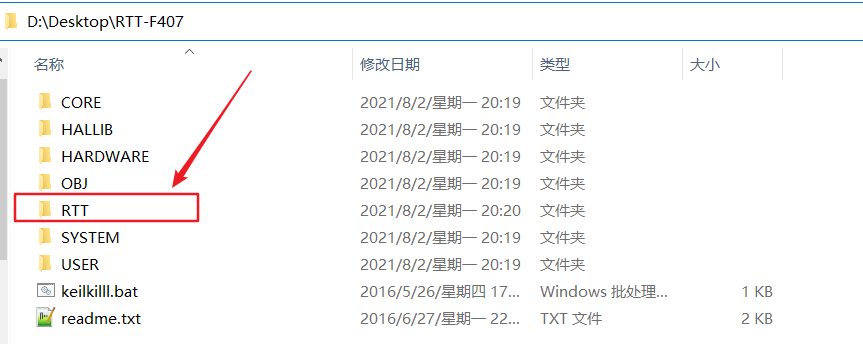
Then copy this RTT folder into the project folder where you are writing your program.
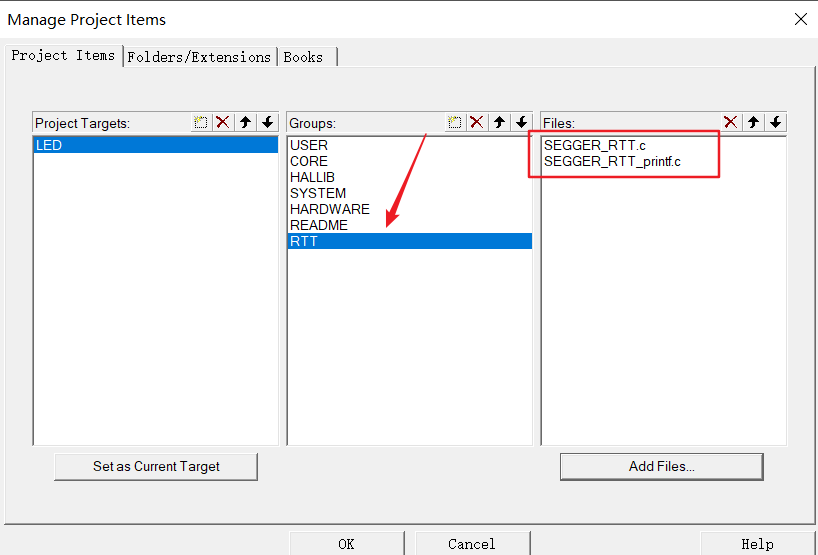
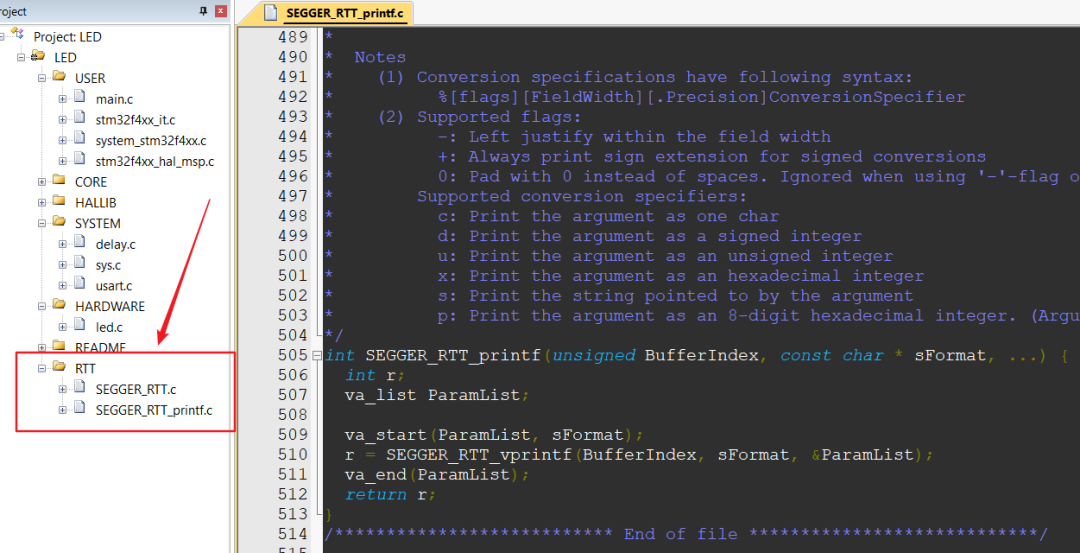
Next, create a new group named<span>RTT</span> in your project and add the two <span>.c</span> files from the <span>RTT</span> folder.
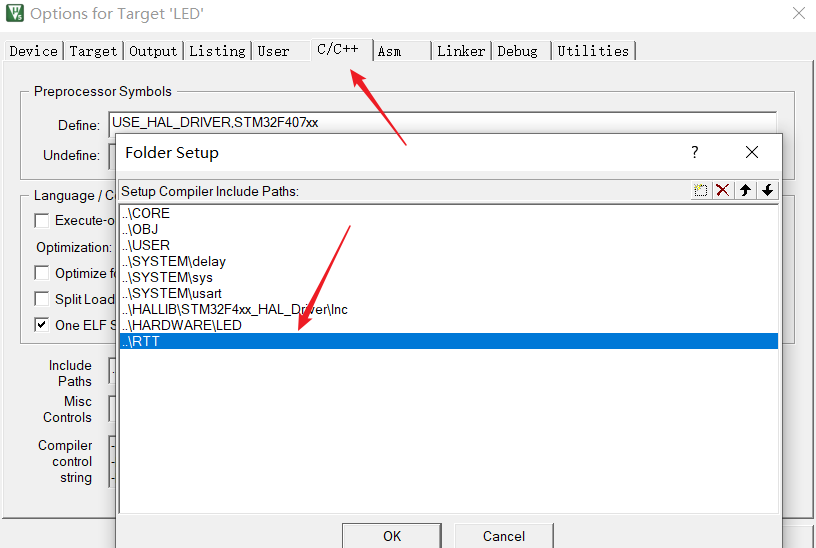
Of course, remember to add the header file path for <span>RTT</span>.
At this point, the porting is basically successful. Isn’t it simple? You just need to add the RTT source code to the project without modifying anything else.
4. RTT Print Output
Next, you can print the output.
#include "sys.h"
#include "delay.h"
#include "usart.h"
#include "led.h"
#include "SEGGER_RTT.h"

int main(void)
{
    HAL_Init();                     // Initialize HAL library
    Stm32_Clock_Init(336,8,2,7);   // Set clock to 168Mhz
 delay_init(168);                // Initialize delay function
 LED_Init();      // Initialize LED

 while(1)
 {
         SEGGER_RTT_printf(0,"zhiguoxin666\r\n");
 }
}
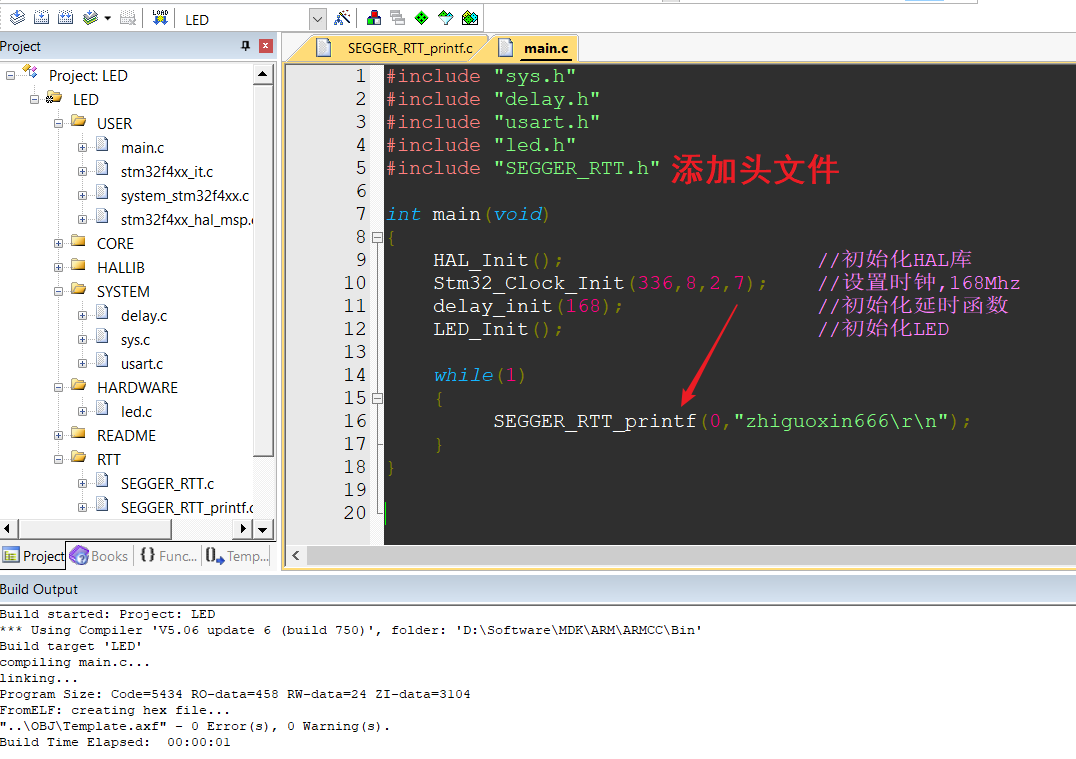
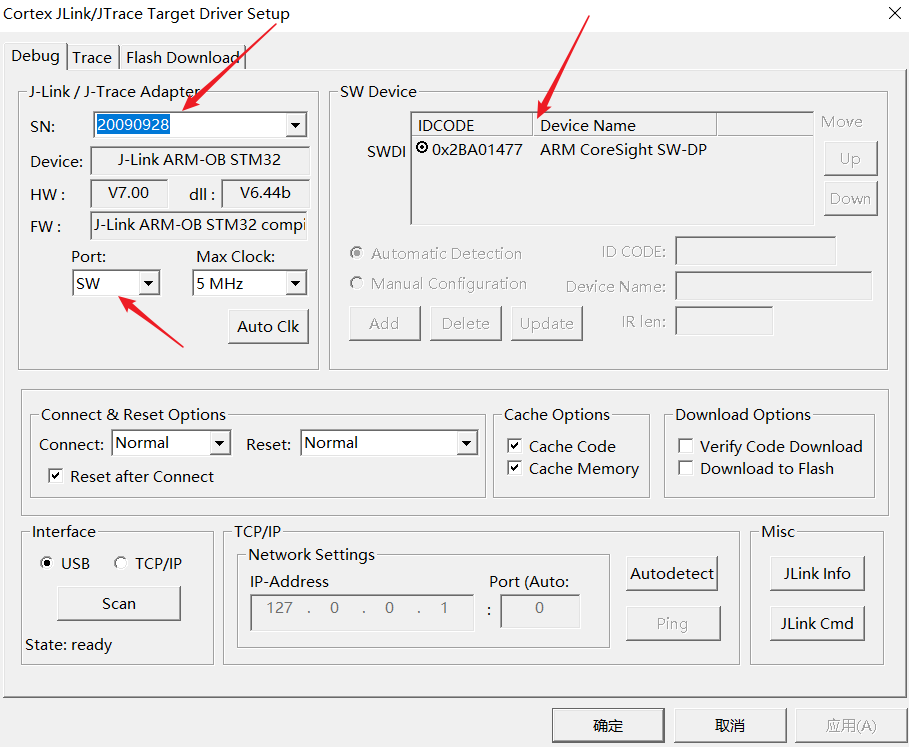
After compiling without errors, connect the downloader properly.
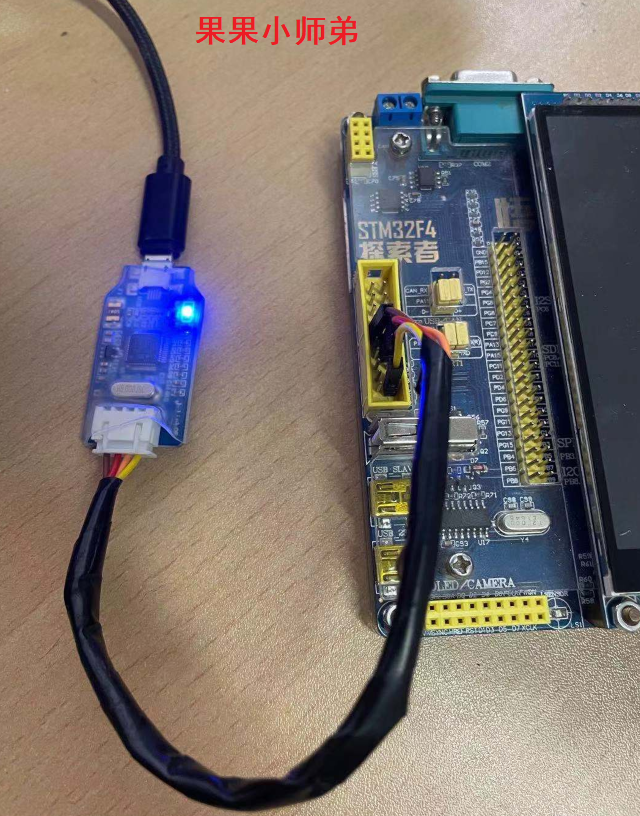
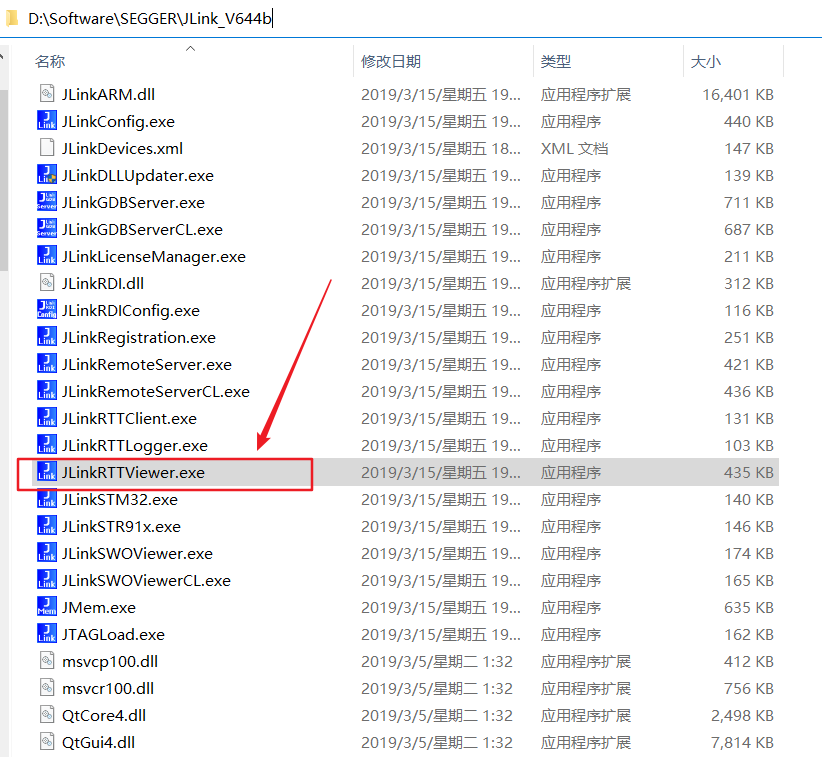
Then open <span>JLinkRTTViewer.exe</span> in the JLink installation directory.
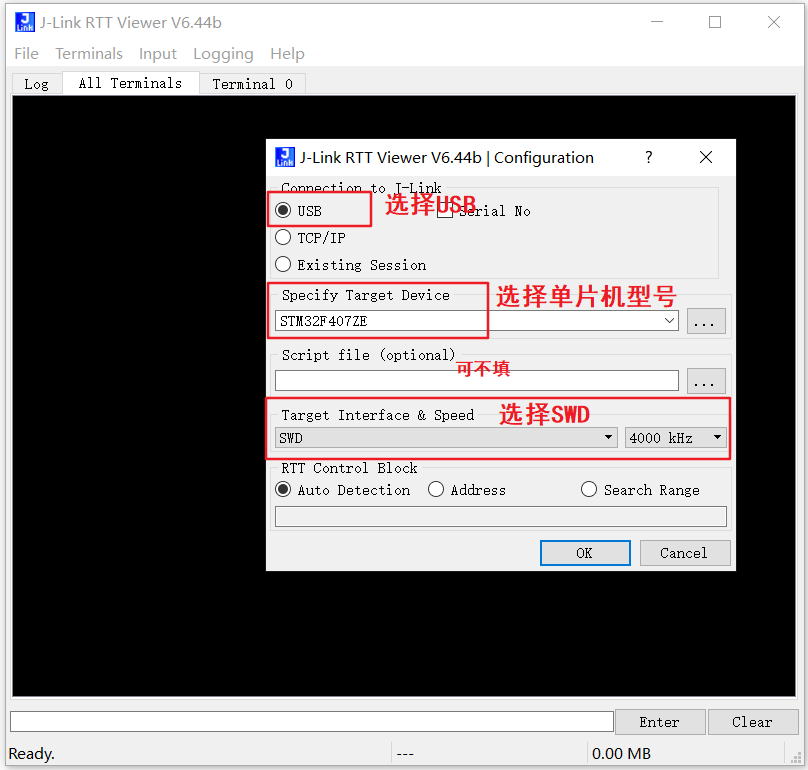
Configure as follows
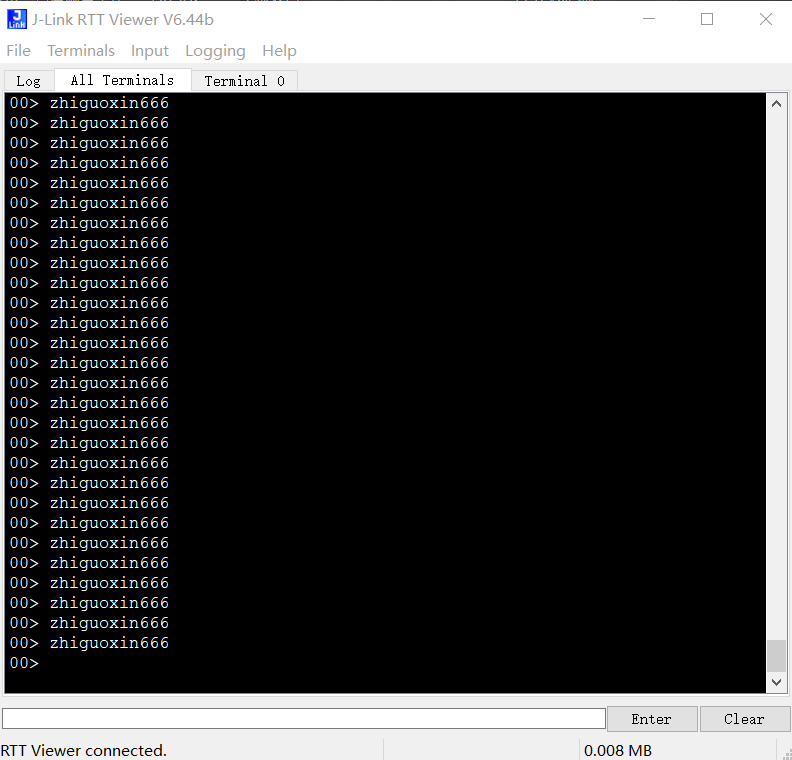
After downloading the code to the microcontroller, you can see that it prints perfectly.
5. RTT Usage Tips
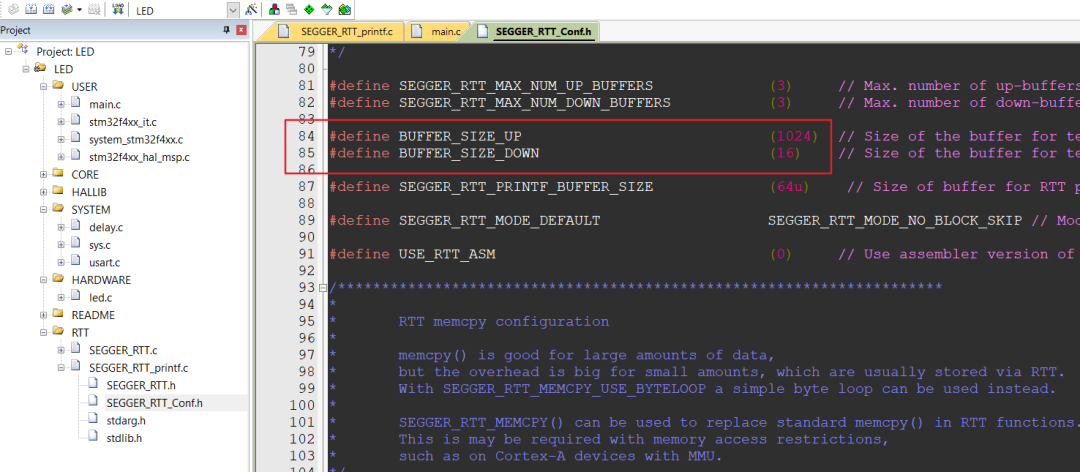
1. RTT Buffer Size
Sometimes we find that our information cannot be printed completely, possibly due to insufficient buffer size. The default buffer size is 1K bytes; if that’s not enough, you can increase it a bit.
2. Using Multiple Virtual Ports
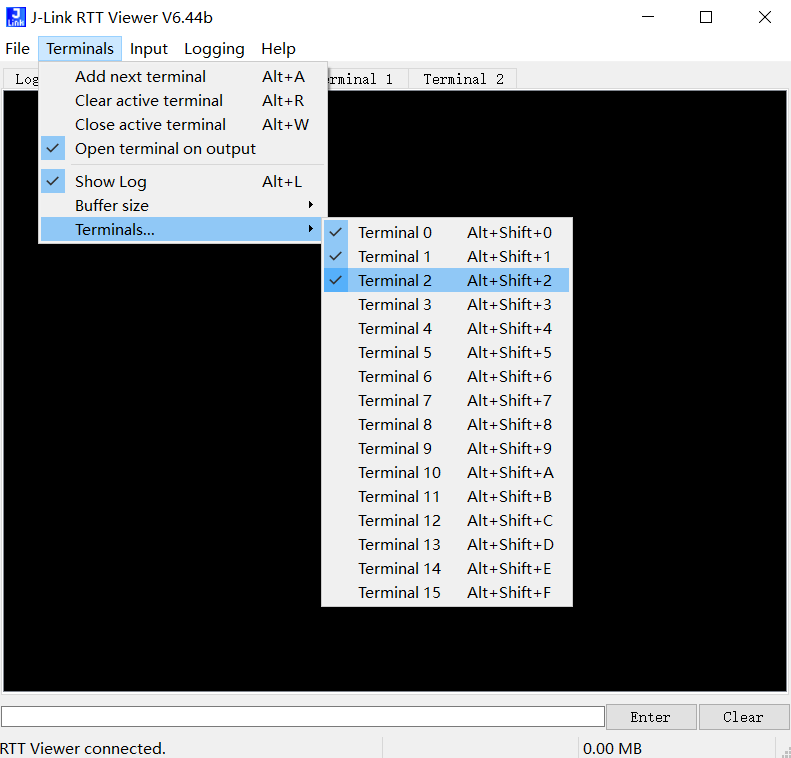
RTT supports printing information to different virtual ports. Here’s how to do it.
First, open three virtual ports in the RTT Viewer software:
Write the code
while(1)
{
 SEGGER_RTT_SetTerminal(0);
 SEGGER_RTT_printf(0,"zhiguoxin666,SEGGER RTT Terminal 0!\r\n");
 SEGGER_RTT_SetTerminal(1);
 SEGGER_RTT_printf(0,"zhiguoxin666,SEGGER RTT Terminal 1!\r\n");
 SEGGER_RTT_SetTerminal(2);
 SEGGER_RTT_printf(0,"zhiguoxin666,SEGGER RTT Terminal 2!\r\n");
 delay_ms(1000);
}
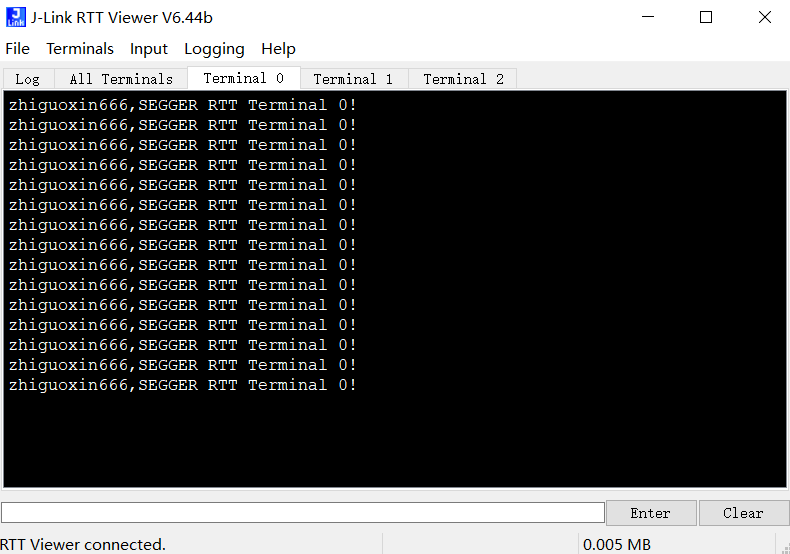
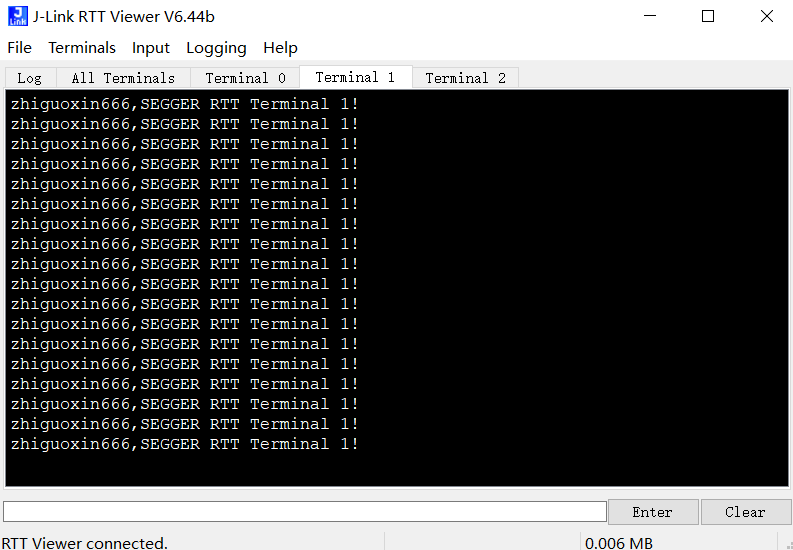
Compile, link, download, and observe the phenomenon:
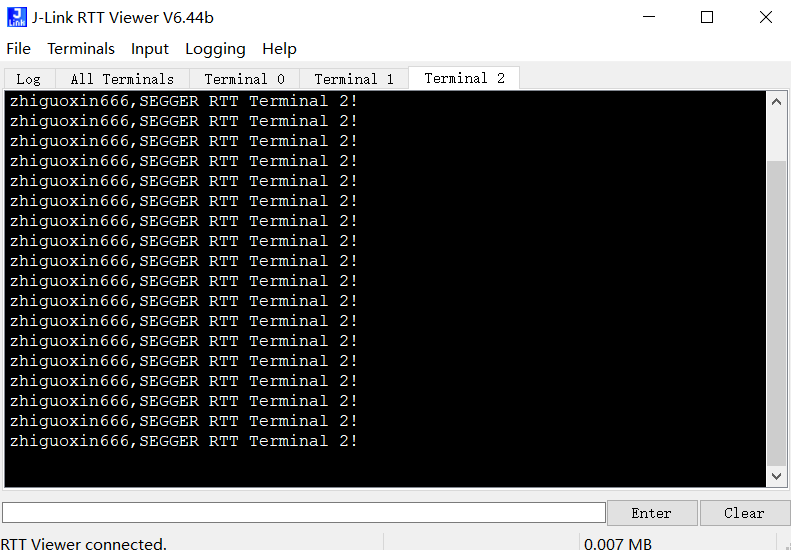
3. Change Print Character Color
RTT supports displaying characters in different colors.
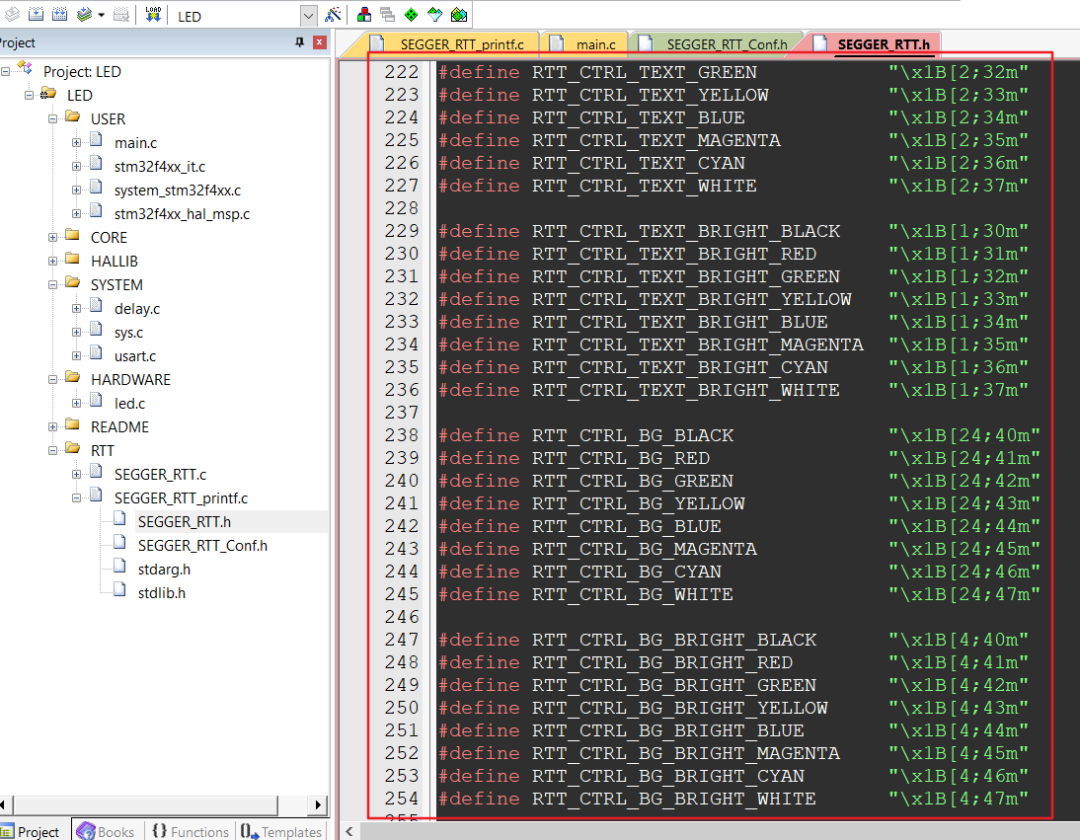
To use this, simply add the corresponding color macro definition before the string.
while(1)
{
 SEGGER_RTT_SetTerminal(0);
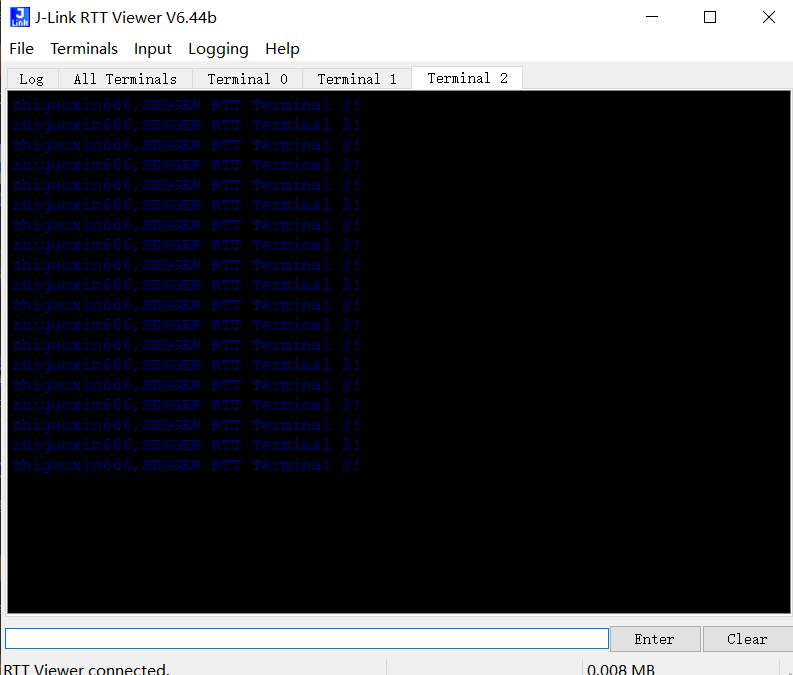
 SEGGER_RTT_printf(0,RTT_CTRL_TEXT_RED"zhiguoxin666,SEGGER RTT Terminal 0!\r\n");
 SEGGER_RTT_SetTerminal(1);
 SEGGER_RTT_printf(0,RTT_CTRL_TEXT_GREEN"zhiguoxin666,SEGGER RTT Terminal 1!\r\n");
 SEGGER_RTT_SetTerminal(2);
 SEGGER_RTT_printf(0,RTT_CTRL_TEXT_BLUE"zhiguoxin666,SEGGER RTT Terminal 2!\r\n");
 delay_ms(1000);
}
Compile, link, download, and observe the phenomenon:
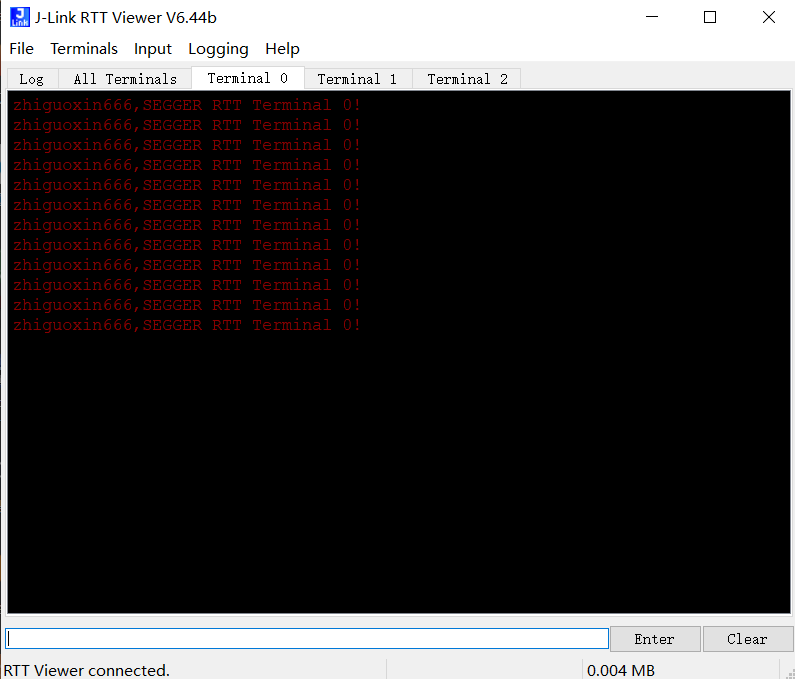
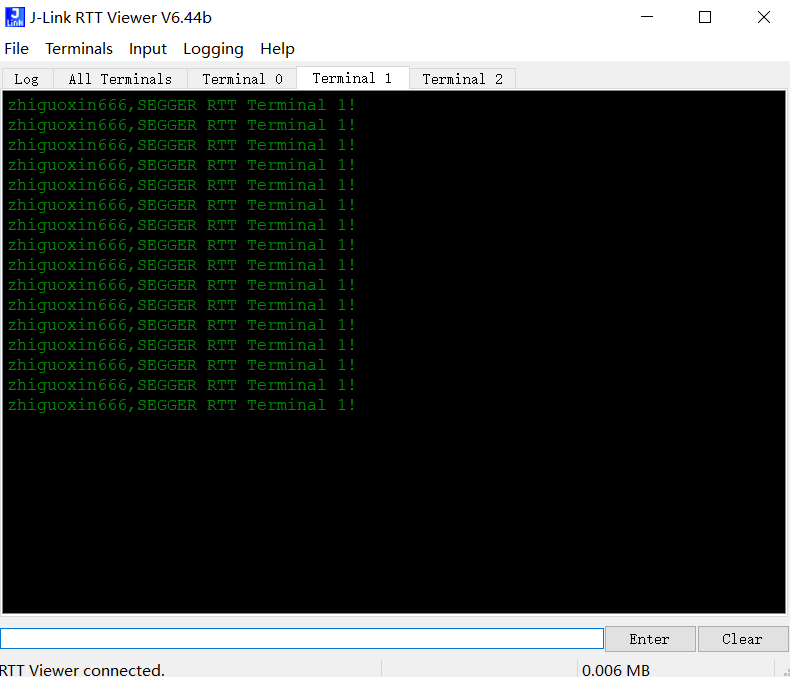
4. Use printf Redirection
There are many places in the project where printf is used. If you can directly modify printf to redirect to the RTT component, it would be very convenient. The method is to directly use the API provided by RTT to implement fputc.
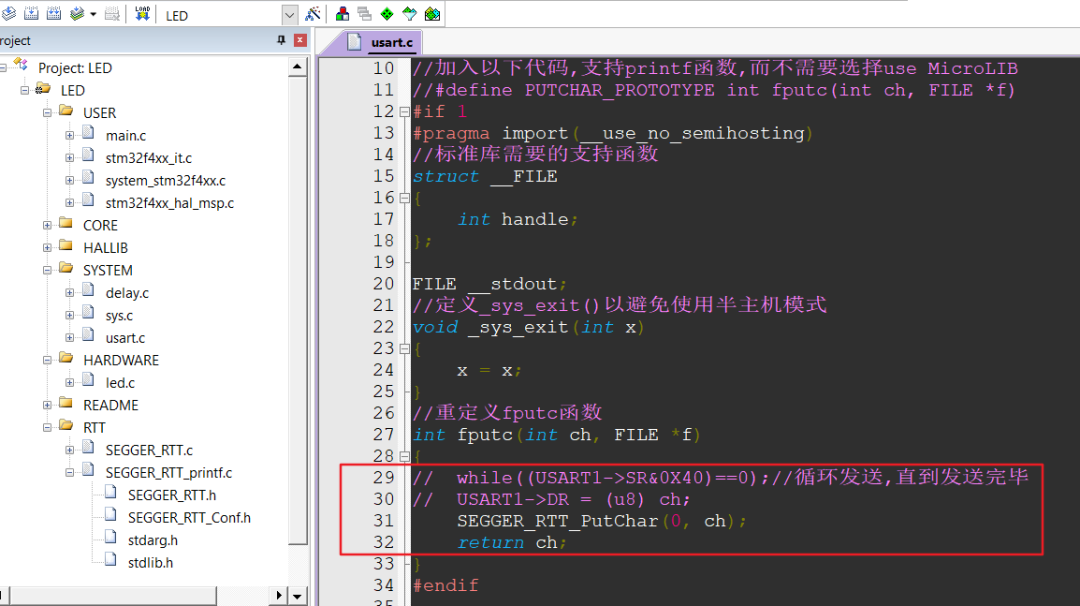
Redefine the fputc function
// Redefine fputc function
int fputc(int ch, FILE *f)
{
    SEGGER_RTT_PutChar(0, ch);
 return ch;
}
Replace the previous code:
while(1)
{
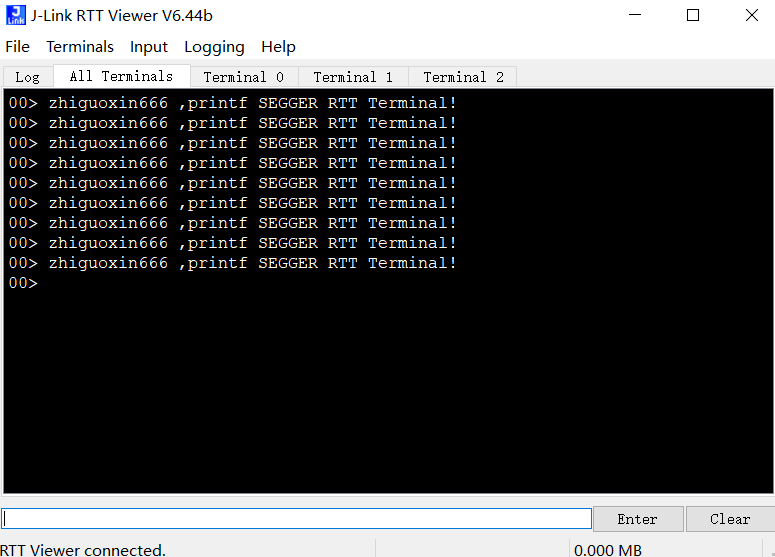
 printf("zhiguoxin666 ,printf SEGGER RTT Terminal!\r\n");
 delay_ms(1000);
}
Compile, link, download
Conclusion: RTT and USART each have their advantages. You should choose according to different situations. If you encounter a display project without a reserved serial port for debugging print information, you can use this method. Of course, there are many methods for debugging print; this is just one of them. If you have better methods, feel free to leave a comment!


Recommended Reading
Hardcore | Why Diodes Are Not Suitable for Series and Parallel Connections?Hardcore | Detailed Explanation of Relay Working PrinciplesHardcore | Understanding the Difference Between Isolated and Non-Isolated Power SuppliesHardcore | Analysis of Internal Circuits of Switching Power Supply Chips
Add WeChat and reply “Join Group”
We will add you to the technical exchange group!
Domestic Chips | Automotive Electronics | IoT | New Energy | Power Supply | Industry | Embedded…..
Reply with any keywords or technical terms in the public account, such as problem keywords, technical terms, bug code, etc., to easily obtain relevant professional technical content feedback. Go try it!
If you want to see our articles regularly, you can enter our homepage, click the three small dots in the upper right corner of the screen, and click “Set as Favorite”.
Welcome to scan and follow