When debugging microcontroller programs, serial port printing is a very common method. Sometimes, when the hardware does not reserve a serial port, other methods need to be used for printing and debugging.
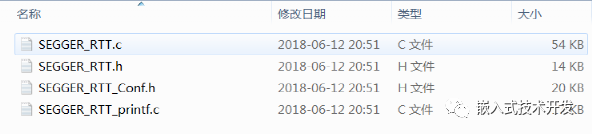
Jlink SEGGER RTT is a very useful method that only requires the Jlink’s SWD or JTAG interface to achieve printf-like functionality, and the usage is quite simple. First, download the RTT code from the Jlink official website, or you can find it in the MDK installation directory. Add these four files to your project and include the SEGGER_RTT.h file in your main program.
To use it, first initialize:
Then you can use
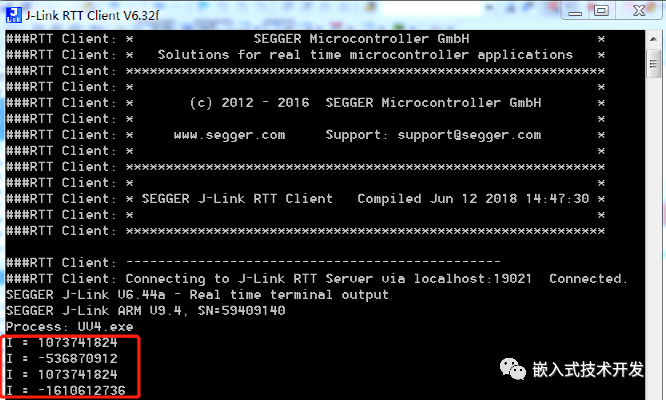
SEGGER_RTT_printf(0,"I = %d\r\n",i);
to print debugging information. Open the J-Link RTT Client in the Jlink installation directory to see the debugging information.
SEGGER RTT also supports some other functions, such as input detection, for those interested to explore.
J-Scope is another debugging tool software released by SEGGER, which can analyze data in real-time and display it graphically while the target MCU is running. It does not require SWO or any additional pins on the target but uses the available standard debug port. J-Scope can display the values of multiple variables in a manner similar to an oscilloscope. The installer can be downloaded from the SEGGER official website. It is best to upgrade Jlink to the latest version before use.
SEGGER official website: https://www.segger.com/
Here is a simple example:
First, create a new empty project, add a piece of code, compile it, and download it to the microcontroller to run.
while (1){ i += 0.01; if(i >= 100) { i = 0; } sin_buf = sin(i); cos_buf = cos(i);}
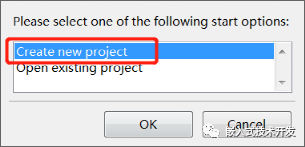
After installing J-Scope, open the software and select to create a new project.
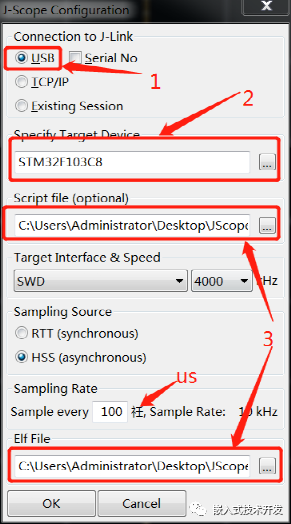
Then configure the interfaces, as shown below:
3) Select the axf file generated by the MDK project.
4) Choose SWD or JTAG for the interface type based on your actual situation.
5) The sampling source can default to HSS.
6) The character “衽” in the image is actually garbled; it should be us.
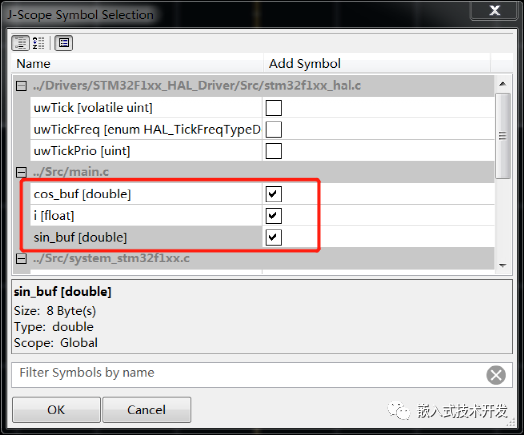
Click OK, then select the variables you want to view:
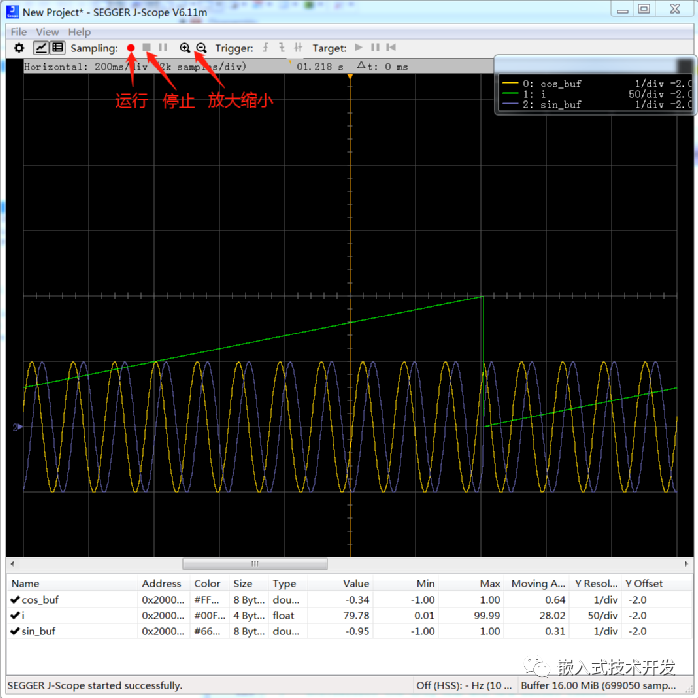
After clicking OK, then click the run button; after the program starts running, you can see the waveforms of the corresponding variables. You can also pause, stop, and zoom in and out of the waveform.
This software also has data import and export functions, and those interested can explore it themselves.
Feel free to follow the WeChat public account “Embedded Technology Development”; you can leave messages for communication in the background. If you find this public account helpful, feel free to recommend and share it with others.