
Abstract
The analysis of sound signals has wide applications in fields such as speech recognition, music processing, and acoustic research. This article implements time-domain and frequency-domain analysis of sound signals based on Matlab, along with statistical analysis of the signals. By processing a segment of audio signal, this article demonstrates how to extract and analyze the features of sound signals, providing a foundation for subsequent signal processing tasks.
Theory
Sound signals are typical non-stationary signals, whose characteristics change over time. To comprehensively understand the nature of sound signals, it is often necessary to conduct joint analysis in both time and frequency domains. Time-domain analysis includes observing the amplitude of the signal as it varies over time, such as in a waveform; while frequency-domain analysis extracts the frequency components of the signal through Fourier Transform (FFT), displaying its energy distribution at different frequencies. Additionally, statistical analysis of the signal (such as mean, variance, power spectral density, etc.) can further quantify the characteristics of the signal, providing a basis for pattern recognition and feature extraction. This article utilizes Matlab to perform the aforementioned analyses and explores their application prospects.
Experimental Results
This article selects a segment of audio signal and conducts a detailed analysis using Matlab. The experimental steps and results are as follows:
- Time-domain analysis: A waveform of the signal was plotted, visually demonstrating how the amplitude of the sound signal changes over time. By observing the waveform, the main rhythm and transient features of the sound signal can be identified.
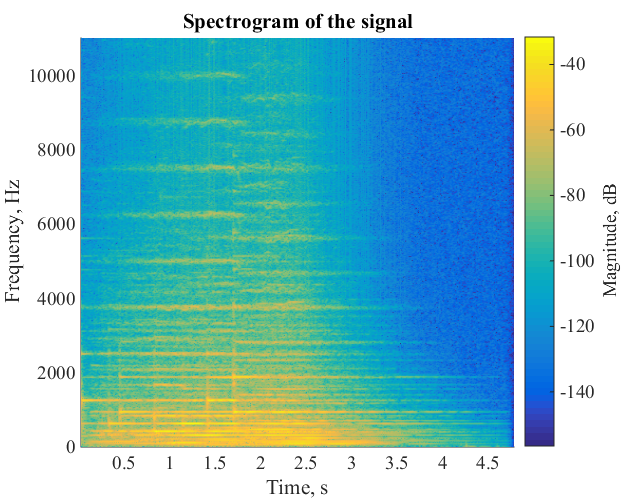
- Frequency-domain analysis: The sound signal underwent Fast Fourier Transform (FFT), generating a spectrum plot. The results displayed the main frequency components of the signal and their corresponding energy distribution, aiding in the understanding of the pitch and timbre of the sound signal.
- Statistical analysis of the signal: The mean, variance, and power spectral density of the signal were calculated, providing strong support for the classification and recognition of the signal.
Through these analyses, this article demonstrates how to comprehensively perform time, frequency, and statistical analysis of sound signals using Matlab, indicating that this method can effectively extract key features of sound signals.
Sample Code
% Read audio file
audio, fs = audioread('track.wav');

% Time-domain analysis - Plot waveform
t = (0:length(audio)-1)/fs;
figure;
plot(t, audio);
title('Time Domain Waveform of Sound Signal');
xlabel('Time (seconds)');
ylabel('Amplitude');

% Frequency-domain analysis - Calculate and plot spectrum
n = length(audio);
f = (0:n-1)*(fs/n)/1000; % Frequency vector in kHz
audio_fft = abs(fft(audio));
figure;
plot(f, audio_fft);
title('Frequency Spectrum of Sound Signal');
xlabel('Frequency (kHz)');
ylabel('Amplitude');

% Statistical analysis of the signal - Calculate statistics
mean_audio = mean(audio); % Calculate mean
var_audio = var(audio); % Calculate variance
psd_audio = pwelch(audio); % Calculate power spectral density
disp(['Signal Mean: ', num2str(mean_audio)]);
disp(['Signal Variance: ', num2str(var_audio)]);
figure;
plot(10*log10(psd_audio));
title('Power Spectral Density of Sound Signal');
xlabel('Frequency (Hz)');
ylabel('Power/Frequency (dB/Hz)');
References
[1] D. Manolakis, V. Ingle. Applied Digital Signal Processing. Cambridge: Cambridge University Press, 2011.
[2] J. Benesty, M. Sondhi, Y. Huang. Springer Handbook of Speech Processing. Berlin, Springer, 2008.
[3] Хр. Живомиров, Д. Пламенова. Investigation of Some Parameters of Audio Signals. National Conference with M.U. “Acoustics 2012”, October 12, 2012, Varna / Journal of Acoustics, ISSN: 1312-4897, Vol. 14, No. 14, pp. 89-95, 2012.