Introduction
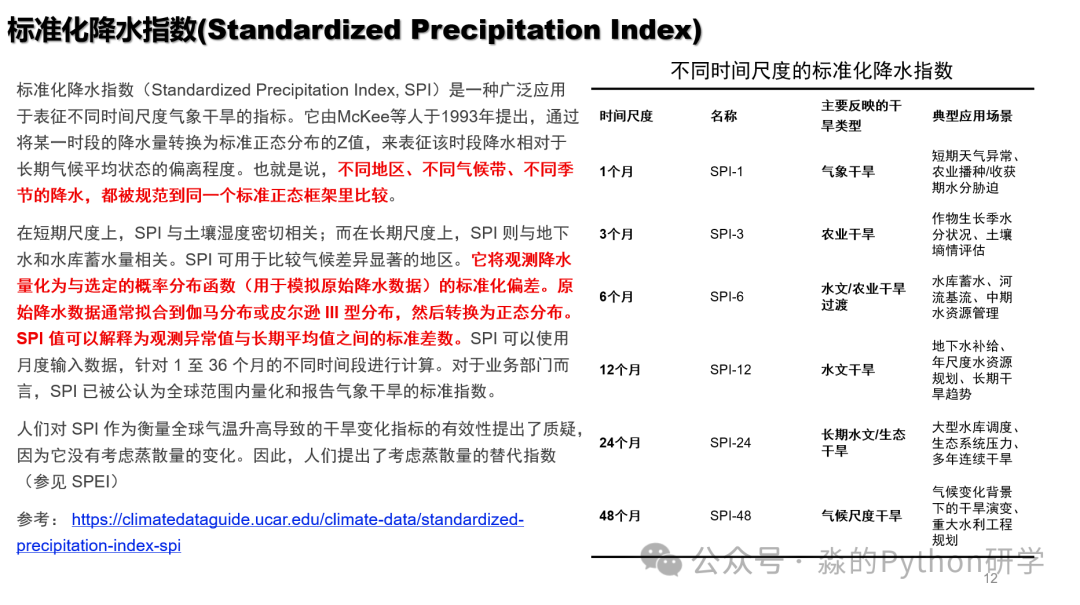
In the context of intensified climate change and frequent extreme droughts, how can we scientifically and objectively measure “how dry it is”? The answer from meteorologists is: the Standardized Precipitation Index (SPI). It does not depend on region, season, or units, providing a unified scale to inform you— the current level of precipitation anomaly compared to historical levels.
This article introduces the principles and case studies of SPI calculation.
What is SPI?
✅ SPI = Standardized Precipitation Index✅ Proposed by McKee et al. in 1993, it is now the globally recommended drought index by the World Meteorological Organization (WMO).
Core idea:
“It’s not about how much rain has fallen, but how that rain compares to historical levels in the local context.”
Calculation Principles in 3 Steps
1️⃣ Accumulated PrecipitationChoose a time scale (e.g., 1 month, 3 months, 6 months) and calculate the total precipitation for that period.👉 SPI-1: reflects meteorological drought; SPI-3: reflects agricultural drought; SPI-6/12: reflects hydrological drought.
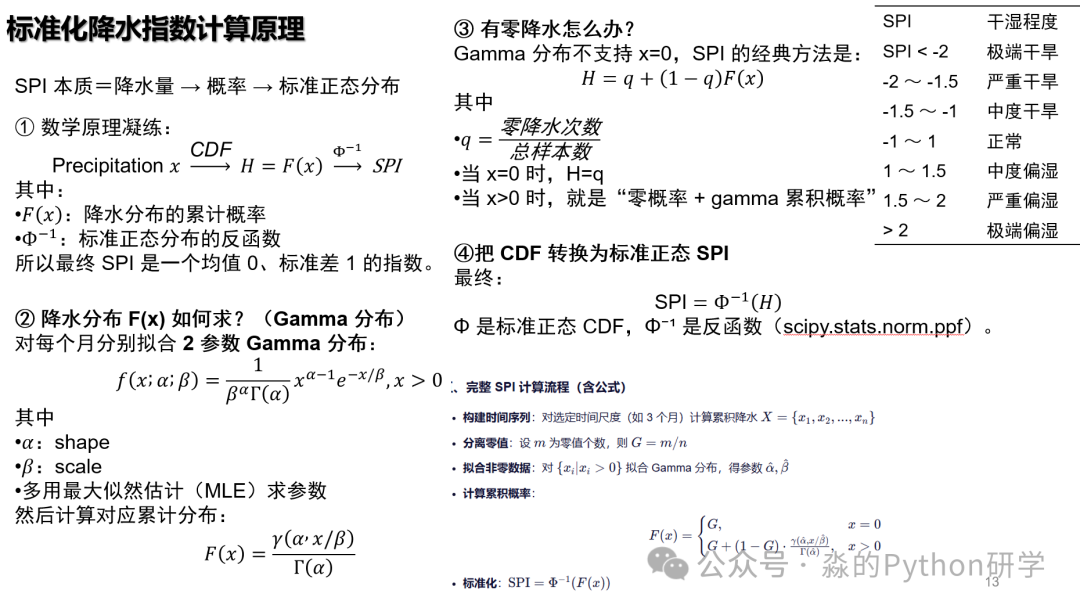
2️⃣ Fit Probability DistributionDue to the natural right skew of precipitation (many zero values and few heavy rains), use Gamma distribution (Pearson Type III can also be used) to fit historical precipitation data (grouped by calendar month!).
3️⃣ Standardization TransformationConvert the cumulative probability to Z values using the inverse of the standard normal distribution:
SPI=Φ−1(F(x))
✅ The result follows N(0,1): mean is 0, standard deviation is 1.
✅ The most commonly used standard time scales
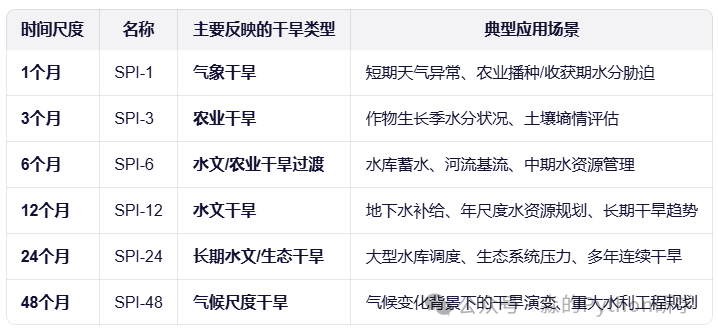
📌 WMO (2012) official recommendations: SPI-1, SPI-3, SPI-6, SPI-12 are core monitoring scales.
🌍 Preferences in different regions/fields
1. Agricultural Sector
Focus: SPI-1, SPI-3
Reason: Crops are sensitive to short-term moisture deficits, such as during critical growth stages like corn tasseling and rice tillering.
2. Water Resource Management
Focus: SPI-6, SPI-12
Reason: Reservoir scheduling and water supply security need to consider cumulative effects over six months to a year.
3. Meteorological Business Warnings
Focus: SPI-1, SPI-3
For example, the “Meteorological Drought Monitoring Bulletin” published by the National Climate Center of China usually includes SPI-1 and SPI-3.
How to Interpret SPI Values?
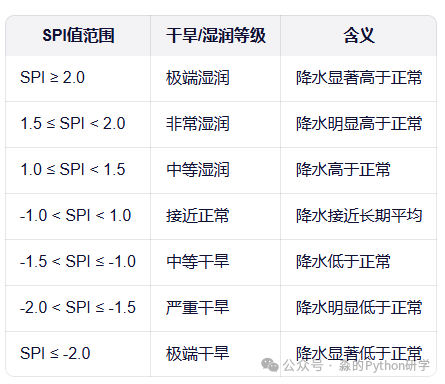
PPT
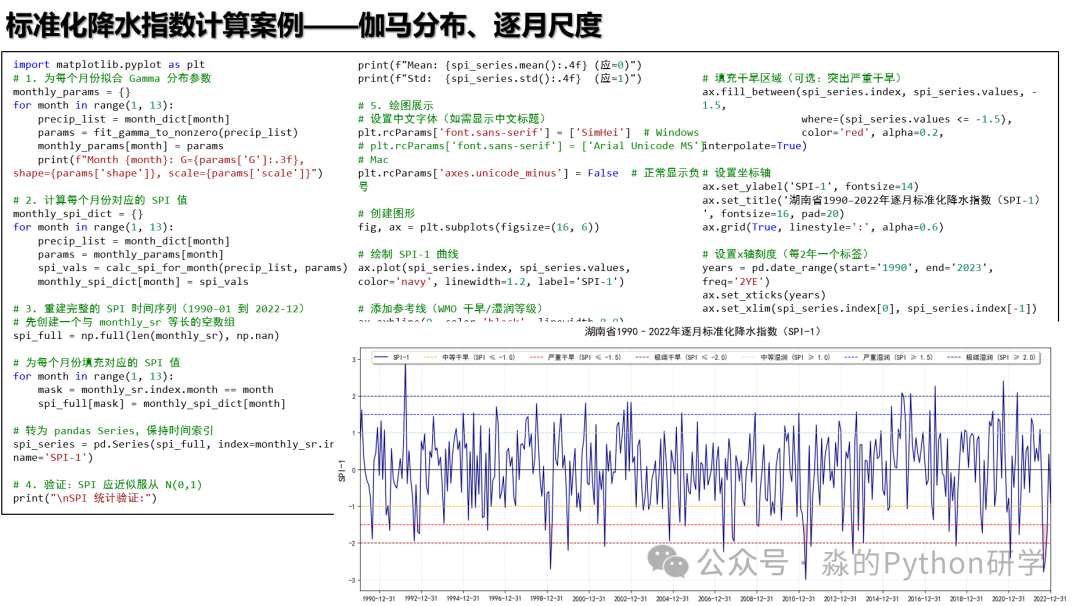
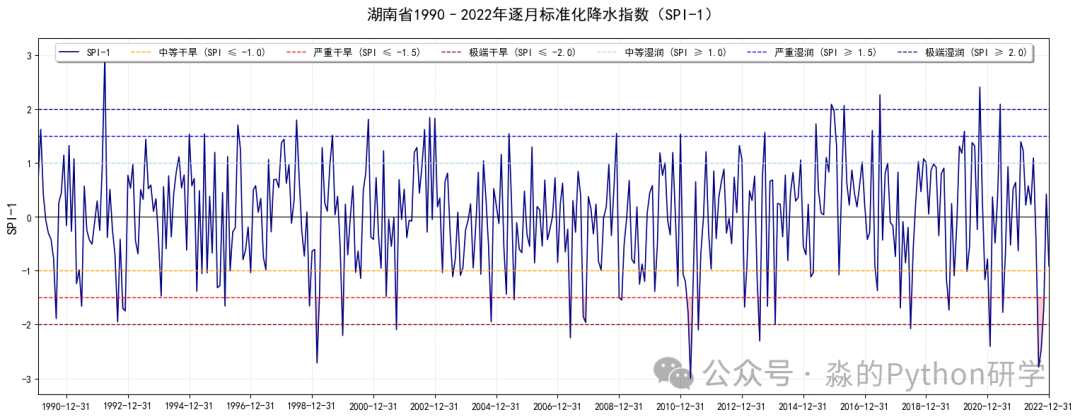
Using monthly calculated SPI
Using quarterly (3 months, with the last month as the timestamp) calculated SPI
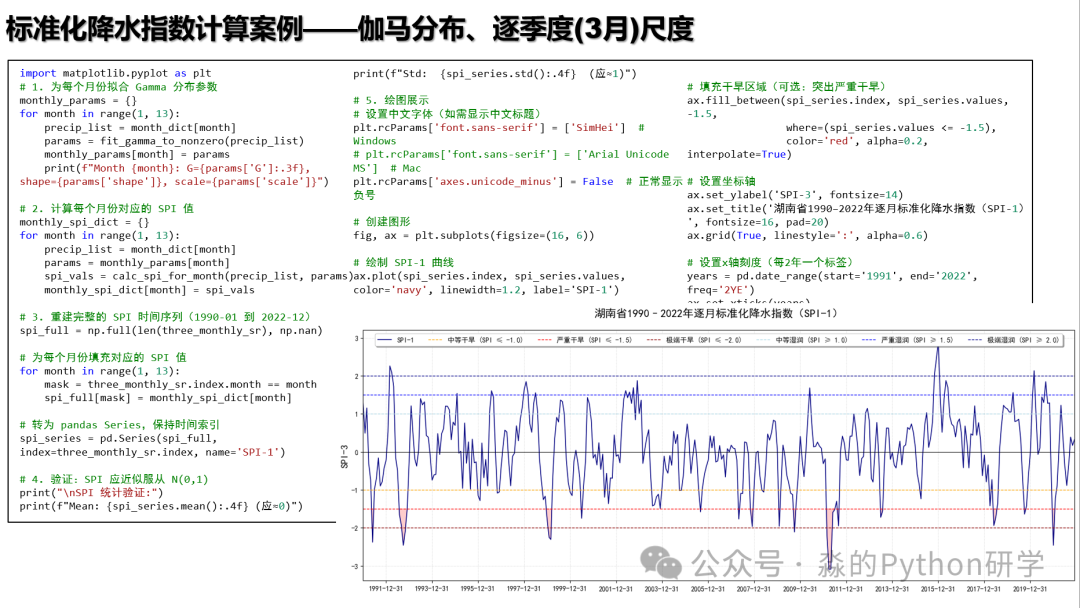
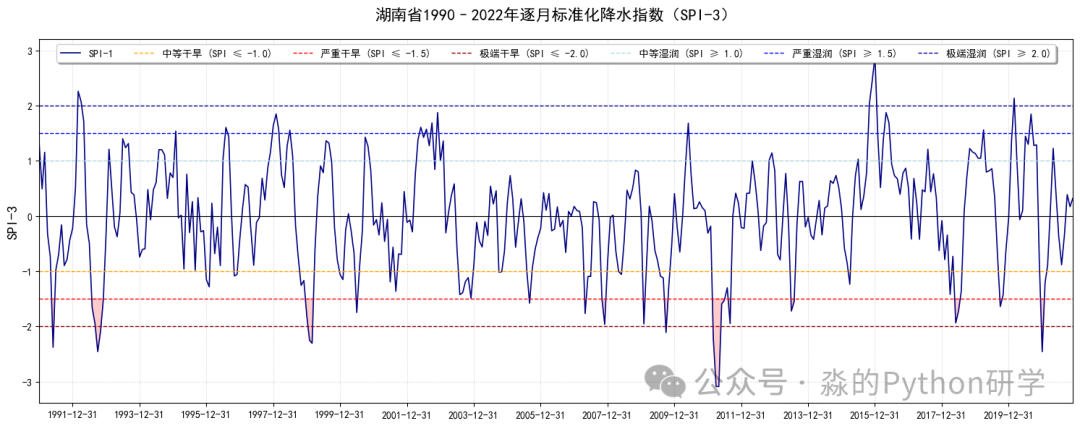
It can be seen that using different time scales results in significant differences in SPI calculations, reflecting the very important concept of “scale” in the geosciences.