 Original Linkhttps://doi.org/10.1016/j.foodres.2025.116501AbstractThe rapid identification of coffee varieties and origins is crucial for ensuring quality control and authenticity in the coffee industry. This study explores the use of an affordable multichannel spectral sensor AS7265X (410 – 940 nm), combined with machine learning techniques, to achieve rapid, non-destructive, and accurate classification of coffee varieties and origins. Spectral data were collected under three LED configurations: the original 18 spectral bands and two additional configurations using the LED emitters to configure the data into 24 and 30 spectral features, respectively. The coffee samples included two varieties, Arabica and Robusta, from four different origins in Indonesia: Arabica Flores (AF), Arabica Gayo (AG), Robusta Dampit (RD), and Robusta Temanggung (RT). Four machine learning algorithms were employed: Linear Discriminant Analysis (LDA), Artificial Neural Networks (ANN), Random Forest (RF), and Support Vector Machines (SVM), with hyperparameter tuning performed through cross-validation techniques. Additionally, physicochemical analyses were randomly conducted on each coffee bean sample, and Principal Component Analysis (PCA) was performed as an exploratory analysis of the data. Our results indicate that using Linear Discriminant Analysis (LDA) for the identification of coffee varieties with 24 and 30 spectral features achieved an accuracy of 100%. For origin identification, the highest validation accuracy of 0.917 was achieved using 24 original spectral features through LDA. Furthermore, data preprocessing methods were applied, and their impact on classification performance was evaluated. However, none of these methods improved classification performance. These results highlight the effectiveness of combining the AS7265X sensor with LDA for reliable and rapid coffee variety identification. Moreover, this approach provides a promising and cost-effective solution for coffee origin identification, contributing to enhanced quality control processes in the coffee industry.
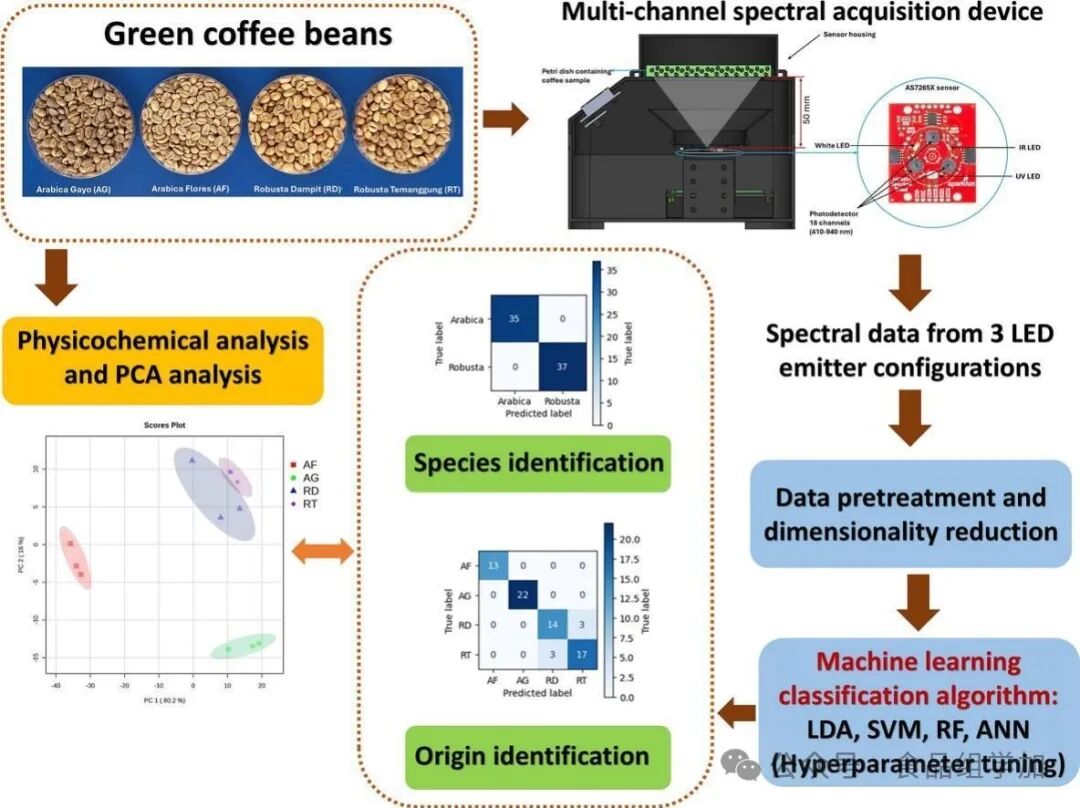 Research BackgroundGlobal agricultural product trade brings numerous risks within the supply chain. Stakeholders in the supply chain can easily mix raw coffee beans from different origins. Quan et al. (2023) explain that the geographical index of raw coffee beans is crucial for enhancing the added value and quality of products within the supply chain. To maintain quality, prevent fraud, and ensure consumer confidence, it is necessary to quickly and accurately identify coffee varieties and their geographical origins. Traditional methods for identifying coffee varieties and geographical origins are time-consuming and inefficient. However, chemical methods and sensory tests are costly and require specialized personnel. Therefore, there is a need for a more efficient, rapid, and reliable method for assessing raw coffee beans. Developing a non-destructive testing method for detecting the authenticity of agricultural products is a breakthrough, allowing stakeholders in the supply chain to utilize this method simply, quickly, and economically, moving towards what is known as Industry 4.0 (Brasil et al., 2022).Some researchers have developed various methods to authenticate coffee beans, such as detecting chemical composition, DNA barcoding, isotope analysis, gas chromatography, and nuclear magnetic resonance. However, these methods are costly and time-consuming. Spectroscopic techniques offer a promising solution to this problem. Spectroscopy is a non-destructive analytical technique that can detect various chemical compounds in a sample based on the reflectance or absorbance of light at specific wavelengths. Near-infrared spectroscopy has become one of the most attractive and widely used methods over the past 50 years. Various spectroscopic techniques have been used to identify and authenticate coffee based on variety, origin, and post-harvest processing types. A study on the authentication of Arabica green coffee beans based on cherry processing methods indicates that portable fluorescence spectroscopy combined with chemometric analysis has great potential. Ultraviolet-visible spectroscopy (UV-VIS) combined with Partial Least Squares Discriminant Analysis (PLS-DA) can accurately identify the types and geographical origins of Vietnamese green coffee beans. Another study also utilized UV-VIS spectroscopy to accurately identify green coffee beans from Brazil’s Cerrado Mineiro. Near-infrared (NIR) spectroscopy combined with chemometric techniques has successfully distinguished coffee samples based on production state, plant variety, quality grade, and geographical indication. Both benchtop and portable near-infrared spectrometers have shown considerable effectiveness in identifying certified geographical origin of Canefora coffee. NIR spectroscopy combined with PLS-DA can accurately identify the geographical and genetic origins of Arabica coffee. UV-VIS and NIR spectroscopy can reliably distinguish between Arabica and Robusta green coffee beans. NIR spectroscopy can identify the origin, variety, and roasting time of Mexican coffee, similar to traditional analytical methods. NIR spectroscopy combined with chemometrics can classify Brazilian specialty coffee with high precision. These spectroscopic methods, especially near-infrared spectroscopy, provide a rapid, objective, and reliable alternative for certification and quality assessment in the coffee industry.According to the literature, no studies have been found that utilize low-cost multichannel spectral sensors (such as the 18-channel visible-near-infrared (AS7265X), 6-channel visible (AS7262), 6-channel near-infrared (AS7263), or 11-channel visible-near-infrared (AS7341)) to identify coffee varieties and their geographical origins. Therefore, this study aims to develop a method using an affordable multispectral sensor (AS7265X) combined with machine learning to rapidly determine the coffee varieties and origins in Indonesia. The choice of AS7265X is due to its wide spectral range, which can capture a more comprehensive spectral feature set. When combined with machine learning, this method is expected to become a high-performance, accurate, and cost-effective tool for identifying coffee varieties and origins.Research Methods1. Coffee Bean Samples2. Physicochemical Property Analysis3. Multichannel Spectral Acquisition System4. Spectral Data Acquisition5. Data Preprocessing6. Classification of Coffee Varieties and Origins Using Machine Learning7. Model Development and Evaluation8. Statistical AnalysisResults and Discussion1. Characteristics of Green Coffee BeansIt can be observed that there are differences in color, approximate composition, and pH values among different coffee samples. The observed parameter differences can be attributed to the unique growth conditions, processing methods, and genetic differences of the coffee varieties.To gain a more comprehensive understanding of the characteristics of the coffee samples, Principal Component Analysis (PCA) was conducted. PCA, as an exploratory data analysis method, is simple to implement and is commonly used to identify unsupervised patterns (Kamal & Karoui, 2015), thus chosen as a multivariate analysis tool. The PCA score plot is a valuable tool for visualizing the similarities and differences between coffee samples (AF, AG, RD, and RT) based on certain physicochemical parameters. According to Figure 5, PCA can distinguish coffee samples from different origins based on physicochemical data. Principal Component 1 (80.2%) explains most of the variance in the data. This large proportion indicates that most of the differences between samples are reflected along this main axis (Principal Component 1). Principal Component 2 (16.0%) explains a smaller but still significant portion of the variance. Principal Component 1 and Principal Component 2 together contribute to 96.2% of the data variance. AF is located in the negative region of Principal Component 1 and is close to zero on Principal Component 2. This indicates that AF has unique characteristics that are significantly different from the other three groups along the main variation axis (Principal Component 1). AG is located in the positive region of PC1 and the negative region of PC2. AG is clearly separated from AF and has moderate separation from RD and RT, indicating that it has distinct characteristics primarily along the PC1 direction. RD is located in the positive regions of both PC1 and PC2. RD is separated from AF and AG, indicating differences in both PC1 and PC2 directions, but is relatively closer to RT. This proximity suggests that RT and RD have more similar characteristics than AF and AG. The distinctions observed in the PCA plot of coffee varieties indicate that each coffee has its unique characteristics. Therefore, spectral analysis related to their physicochemical properties can be utilized, namely using visible-near-infrared spectroscopy. Visible-near-infrared spectroscopy can perform rapid, non-destructive analysis of coffee samples. Measurements can be completed within seconds to minutes, making it suitable for high-throughput environments. This provides a promising method for the rapid classification of these coffee varieties based on their unique characteristics.
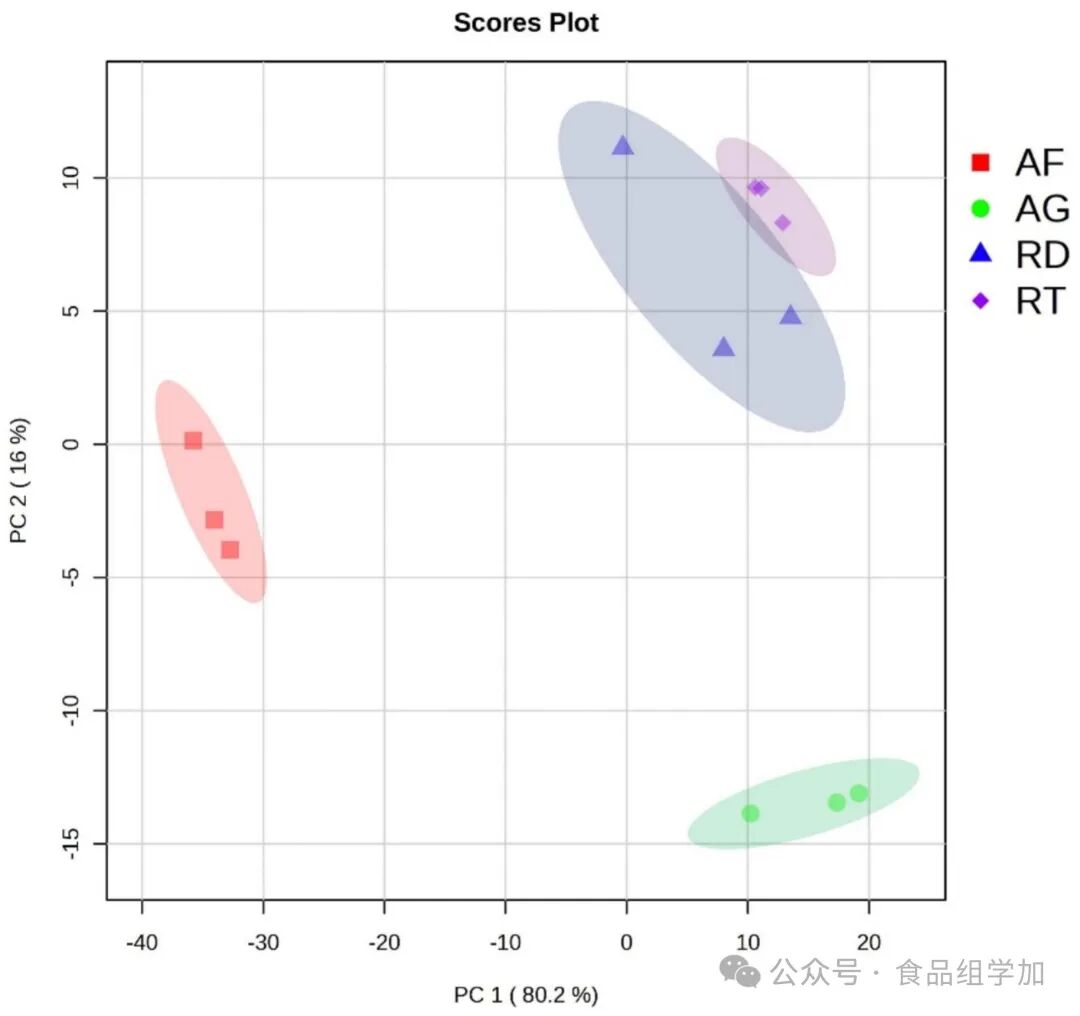 Figure 5. Principal Component Analysis of the Physicochemical Characteristics of Green Coffee Beans2. Classification of Coffee VarietiesTable 4 presents the machine learning performance of coffee variety classification based on the spectral features of the AS7265X sensor after hyperparameter tuning. Additionally, the confusion matrix comparison results for all scenarios are shown in Figure 6. Overall, it can be seen that the coffee variety identification performance based on the spectral features of the AS7265X sensor combined with machine learning is outstanding, with training accuracy ranging from 0.994 to 1, while validation accuracy ranges from 0.958 to 1. The results indicate that all algorithms performed exceptionally well, with only slight differences in the number of input spectral features and the algorithms used.
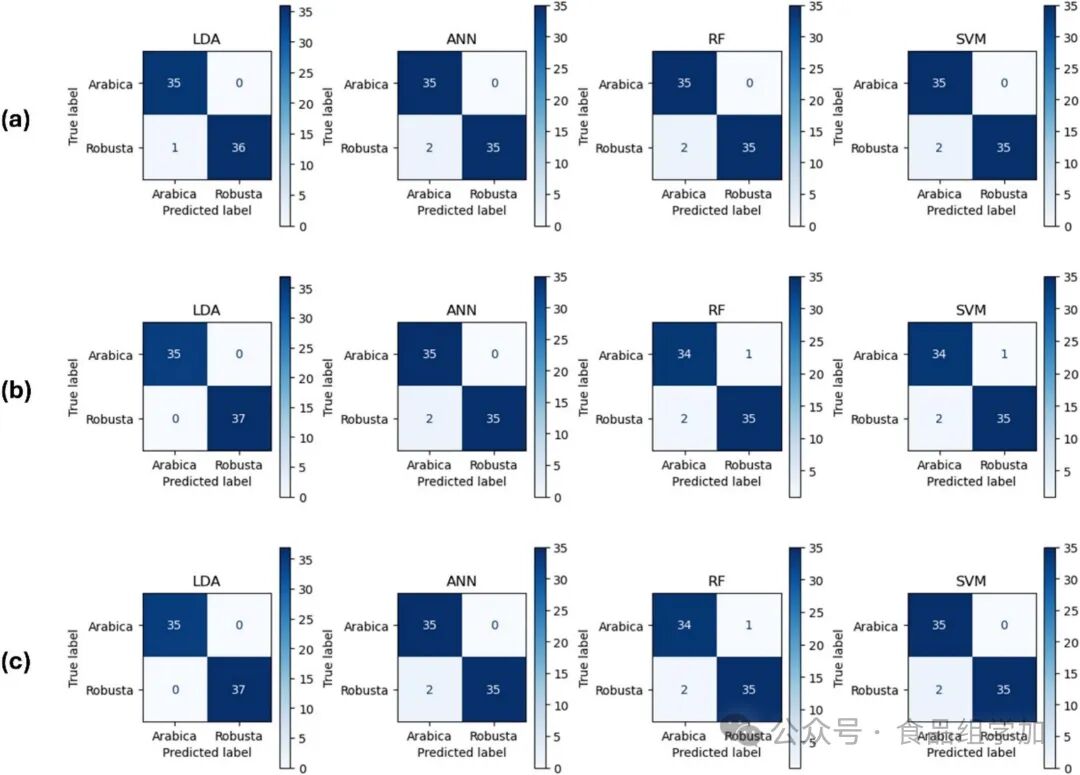 Figure 6. Comparison of Confusion Matrices for Coffee Variety Identification in Different Scenarios: (a) Using 18 Input Spectral Data, (b) Using 24 Input Spectral Data, (c) Using 30 Input Spectral Data.Using 18 spectral features, Linear Discriminant Analysis (LDA) achieved a high training accuracy of 0.994 and a validation accuracy of 0.986. The precision, recall, and F1 values for both the training and validation sets corresponded with the accuracy values. According to the confusion matrix in Figure 6, one Robusta coffee sample was predicted as Arabica coffee, while all Arabica coffee samples were perfectly predicted. The Artificial Neural Network (ANN), Random Forest (RF), and Support Vector Machine (SVM) algorithms performed similarly, achieving a perfect accuracy of 1.0 in training, but their validation accuracy dropped to 0.972 (lower than LDA). Based on the research findings, Linear Discriminant Analysis (LDA) outperformed and was more stable across all spectral channels, achieving full scores in validation and training with 24 and 30 channels, respectively. Due to its robustness and efficiency, LDA is a very reliable choice for identifying coffee varieties. This indicates that LDA can quickly and accurately identify different coffee varieties in practical applications. The Artificial Neural Network (ANN), Random Forest (RF), and Support Vector Machine (SVM) performed excellently in training. However, their validation accuracy was lower, ranging from 0.958 to 0.972, indicating potential overfitting and suggesting that these algorithms may require further improvement or more validation data to achieve results similar to LDA. The superior performance of LDA is attributed to the fact that certain feature data for each category follow a Gaussian distribution with the same covariance matrix (Qu & Pei, 2024). The results of the Gaussian distribution analysis are provided as supplementary material (Table S1), where 47% – 60% of the feature data for each category meet this distribution criterion. From this analysis, it is also revealed that the decline in classification performance in the modeling scenario with 30 spectral features is due to the last 6 additional spectral data not following a Gaussian distribution, which undoubtedly reduces the classification performance of LDA and other algorithms. Furthermore, another criterion that makes LDA robust and prevents overfitting is that the number of features (dimensions) is not too high compared to the sample size. This phenomenon of LDA outperforming other algorithms has also been observed in previous studies (Jongyingcharoen et al., 2024; Sitorus and Lapcharoensuk, 2024b). In the study by Sitorus and Lapcharoensuk (2024b), spectral data from Micro-NIR showed that LDA outperformed other algorithms, achieving 100% accuracy on both training and testing data, while other algorithms such as Artificial Neural Networks (ANN) were significantly lower. Another study reported that combining 10 principal components with LDA outperformed Artificial Neural Networks (ANN), k-Nearest Neighbors (kNN), and Support Vector Machines (SVM) (Jongyingcharoen et al., 2024). Based on these findings, it indicates that complex algorithms such as Artificial Neural Networks (ANN) or Support Vector Machines (SVM) are not always superior to simpler algorithms like Linear Discriminant Analysis (LDA). Therefore, it is important to test and compare the performance of each algorithm in various classification and regression cases.These research results indicate that using only 24 reflectance combination features within the wavelength range of 410 to 940 nm can achieve 100% accuracy, whereas previous studies required the use of a UV-visible spectrophotometer with 501 variables and Partial Least Squares Discriminant Analysis (PLS-DA) chemometrics to reach this accuracy (Quan et al., 2023). The success of this classification aligns with the hypothesis, as literature indicates that peaks in the range of 900 to 940 nm are related to the second overtone C-H stretching vibrations, which are associated with fat content (Cruz-Tirado et al., 2023). This is supported by the physicochemical data (Figure 5), which shows significant differences in lipid content between Arabica and Robusta coffee beans. Based on this result, using this multispectral sensor can be more cost-effective and simplify data processing (with minimal variables). Additionally, the advantage of this sensor lies in its ease of implementation and prototyping, as it can be directly integrated with microcontrollers like Arduino or microcomputers like Raspberry Pi.3. Identification of Coffee Bean OriginsConclusion and RecommendationsThis study demonstrates the feasibility of using the low-cost AS7265X multichannel spectral sensor combined with the LDA algorithm for coffee variety and origin identification, with lower operational costs compared to existing technologies. Assuming the model is embedded in the device, the total time required to identify coffee from sample preparation, data acquisition, data processing to result presentation is less than 30 seconds. By utilizing 24 reflectance spectral features configured with 3 LEDs (ultraviolet, visible, near-infrared) and capturing data in the wavelength range of 410 to 940 nm, the LDA model can distinguish between bean-like Arabica and Robusta varieties with 100% accuracy, while for origin identification, even without any spectral data preprocessing, the accuracy reached 0.917. This finding provides valuable insights into the reliability of these spectral features (410 to 940 nm) in predicting coffee varieties and origins. These results are supported by clear evidence of differences in the physical (L*, a*, b*, C*, hue angle) and chemical properties (moisture, protein, ash, fat, carbohydrates, pH) of the coffee samples, which have been confirmed through destructive testing. However, the narrow spectral range of the sensor (410 – 940 nm) and limited resolution restrict its ability to capture subtle spectral features, which is inferior compared to laboratory-grade instruments. Therefore, developing a spectral sensor with a broader spectral range corresponding to specific chemical bonds in coffee could enhance the recognition of key features. Combining this sensor with chemical fingerprinting techniques would provide a more comprehensive approach to coffee classification, enabling more precise and reliable identification of coffee varieties and origins. The practical application of this research is an important aspect to consider. In the future, it may be possible to integrate the best-performing machine learning models into the acquisition devices themselves. This could be achieved through embedded machine learning systems or web/mobile-based platforms, simplifying the entire process and making it more applicable in practice. To this end, it is crucial to consider environmental factors (such as temperature, humidity, and light) as additional feature variables in the machine learning models to improve their accuracy and robustness in practical applications. Furthermore, while our samples covered the major coffee-growing regions in Indonesia, we acknowledge the limitation of not covering all possible origins. Future research could extend this framework to other regions or geographical indications to further validate the findings of this study. In summary, this research outlines a sustainable and high-potential coffee identification solution that can enhance quality control, certification, and traceability in coffee processing, thereby improving the coffee market.
 This public account’s articles are for academic exchange only. “Original” indicates original translation, and the quality is limited. It does not represent this platform’s claim to copyright over the text. If there is any infringement, please contact the backend for modification or deletion. We sincerely apologize for any omissions in the literature interpretation; please contact us promptly (WeChat ID: food0729), and we will make corrections or reissue the article as soon as possible. Thank you for your understanding!We welcome all teachers and students to engage in discussions on the forefront of food science and technology, submit articles, reprint, collaborate, etc. Please add WeChat: food0729.