1. First, define the independent variable x and set the domain for x;
2. Then define the function y, y = f(x);
3. Finally, call the plotting command, such as the plot command: plot(x,y), where x represents the X coordinate values and y represents the Y coordinate values.
Next, let’s plot a simple linear function y = x, with x values ranging from -100 to 100, incrementing by 10.
In MATLAB, create a script file and input the following code:
x = [-100:10:100];
y = x;
plot(x, y)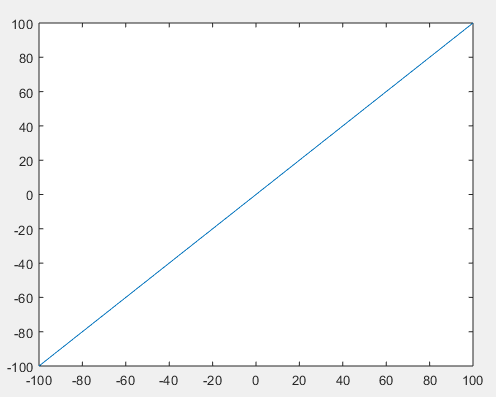
Now let’s try plotting a simple nonlinear function y = x2, first setting the range of x values from -200 to 200, with an increment of 40.
In MATLAB, create a script file and input the following code:
x = [-200:40:200];
y = x.^2;
plot(x, y)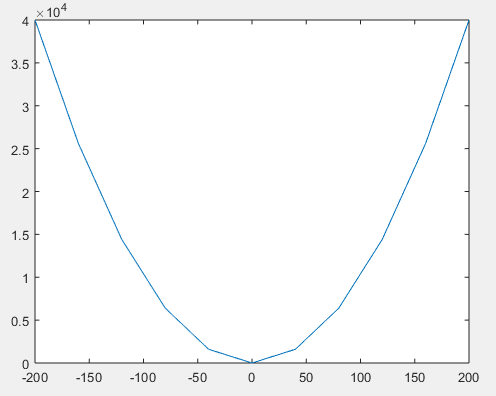
x = [-200:10:200];
y = x.^2;
plot(x, y)
1. xlabel and ylabel commands will produce labels along the x-axis and y-axis.
2. title command will create a title for the graph.
3. grid command allows you to generate grid lines on the graph.
4. legend command will display labels on the graph.
Detailed Example:
In MATLAB, create a script file and input the following code for the trigonometric function y = sin(x):
x = [-pi*10:0.05:pi*10];
y = sin(x);
plot(x, y), xlabel('x'), ylabel('Sin(x)'), title('Wave'),
grid on,legend('Sin(x)')
Click the “Run” button, and MATLAB will execute it and display the following curve:
Example: plot(x,y,’gx:’) % The third parameter gx: indicates g for green, x for x-shaped markers, and : for dotted lines.
Detailed Example:
In MATLAB, create a script file and input the following code:
x=-pi*5:pi/5:pi*5
y1=cos(x)
y2=sin(x)
plot(x,y1,'m*:',x,y2,'gp--')
Click the “Run” button, and MATLAB will execute it and display the following curve:
Specific Example:
In MATLAB, create a script file and input the following code:
x = [-20: 0.05: 20];
y=2*exp(-0.5*x).*sin(2*pi*x);
plot(x, y), axis([-10 10 -1.5 1.5])
In MATLAB, create a script file and input the following code:
x = 0:.1:2*pi;y = exp(-0.2*x).*sin(0.5*x);
[zz,yy,xx] = cylinder(y);
xx = xx*2*pi;
surf(xx,yy,zz)
Click the “Run” button, and MATLAB will execute it and display the following graph:
If students wish to delve deeper into MATLAB plotting techniques, they can follow the series of courses by the Extreme Value Academy on Matlab From Beginner to Algorithm Practice【Series Course】, taught by Dong Chenhui, the author of the bestselling book “MATLAB From Beginner to Master”, which has received rave reviews!
Long press to recognize and view the detailed course introduction
Sign up now for a discount of 150 yuan!
Long press to add Teacher Guo’s WeChat to receive a coupon