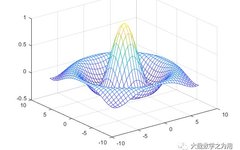
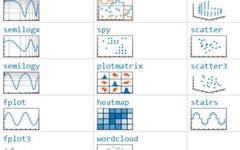
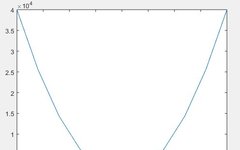
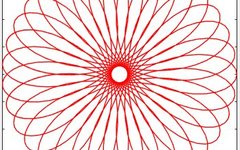
Matlab | Plotting Function Graphs
Welcome to click “The Beauty of Algorithms and Programming” ↑ to follow us! This article was first published on WeChat public account: “The Beauty of Algorithms and Programming”, welcome to follow us for timely updates on more articles in this series. Welcome to join the team circle! Face-to-face with the author! Click directly! 1. Common … Read more