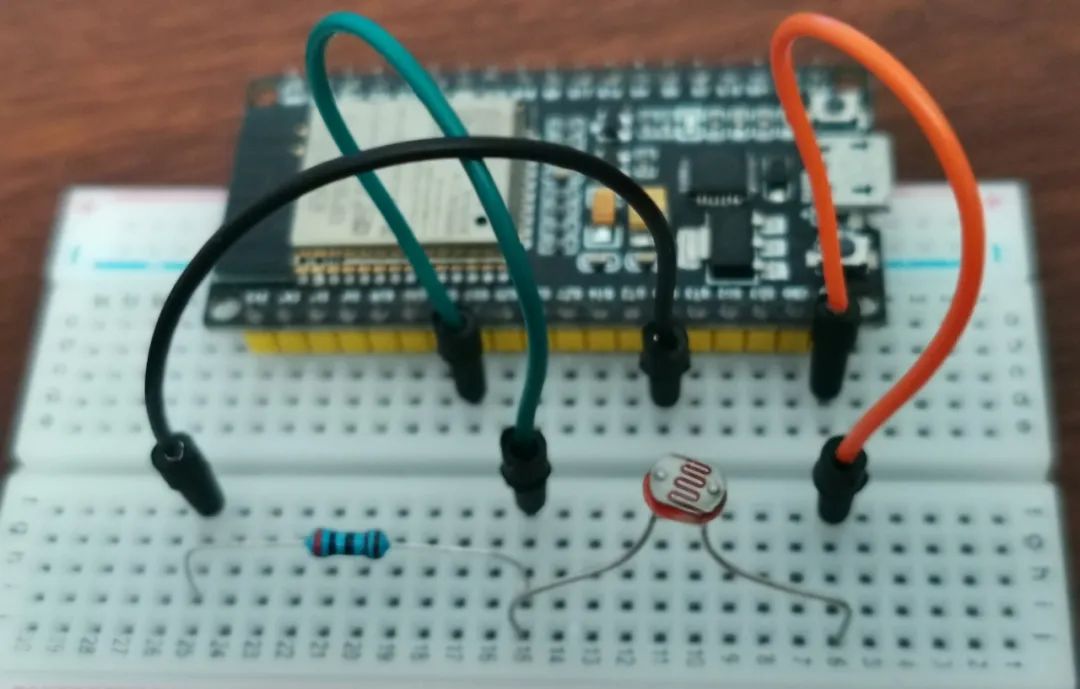
Experimental Scene and Circuit Connection
Recently, I found online that a teacher published a paper in a journal, using the voltammetry method to measure the resistance of a photoresistor while measuring light intensity with a light sensor, then plotting the relationship curve of photoresistor resistance and light intensity in a spreadsheet.
The steps are cumbersome and time-consuming.
Physics Insights
Improvement and Application Exploration of Arduino-based Photoresistor Experiments
The author, immersed in Bluetooth experimental research with ESP32 and Phyphox for a long time, believes that using the combination of ESP32 and Phyphox can complete the exploration of the “relationship between photoresistor resistance and light intensity” in just a few minutes.
Following the basic idea of a series circuit, I built an experimental circuit to measure the resistance of the photoresistor, using the 5V power supply from the ESP32. I connected the photoresistor in series with a 2000-ohm voltage divider resistor. The ESP32 detects voltage and current data, calculates the resistance of the photoresistor using the basic principles of series circuits, and sends the instantaneous value of the photoresistor to the Phyphox mobile experimental program loaded on a smartphone via Bluetooth.
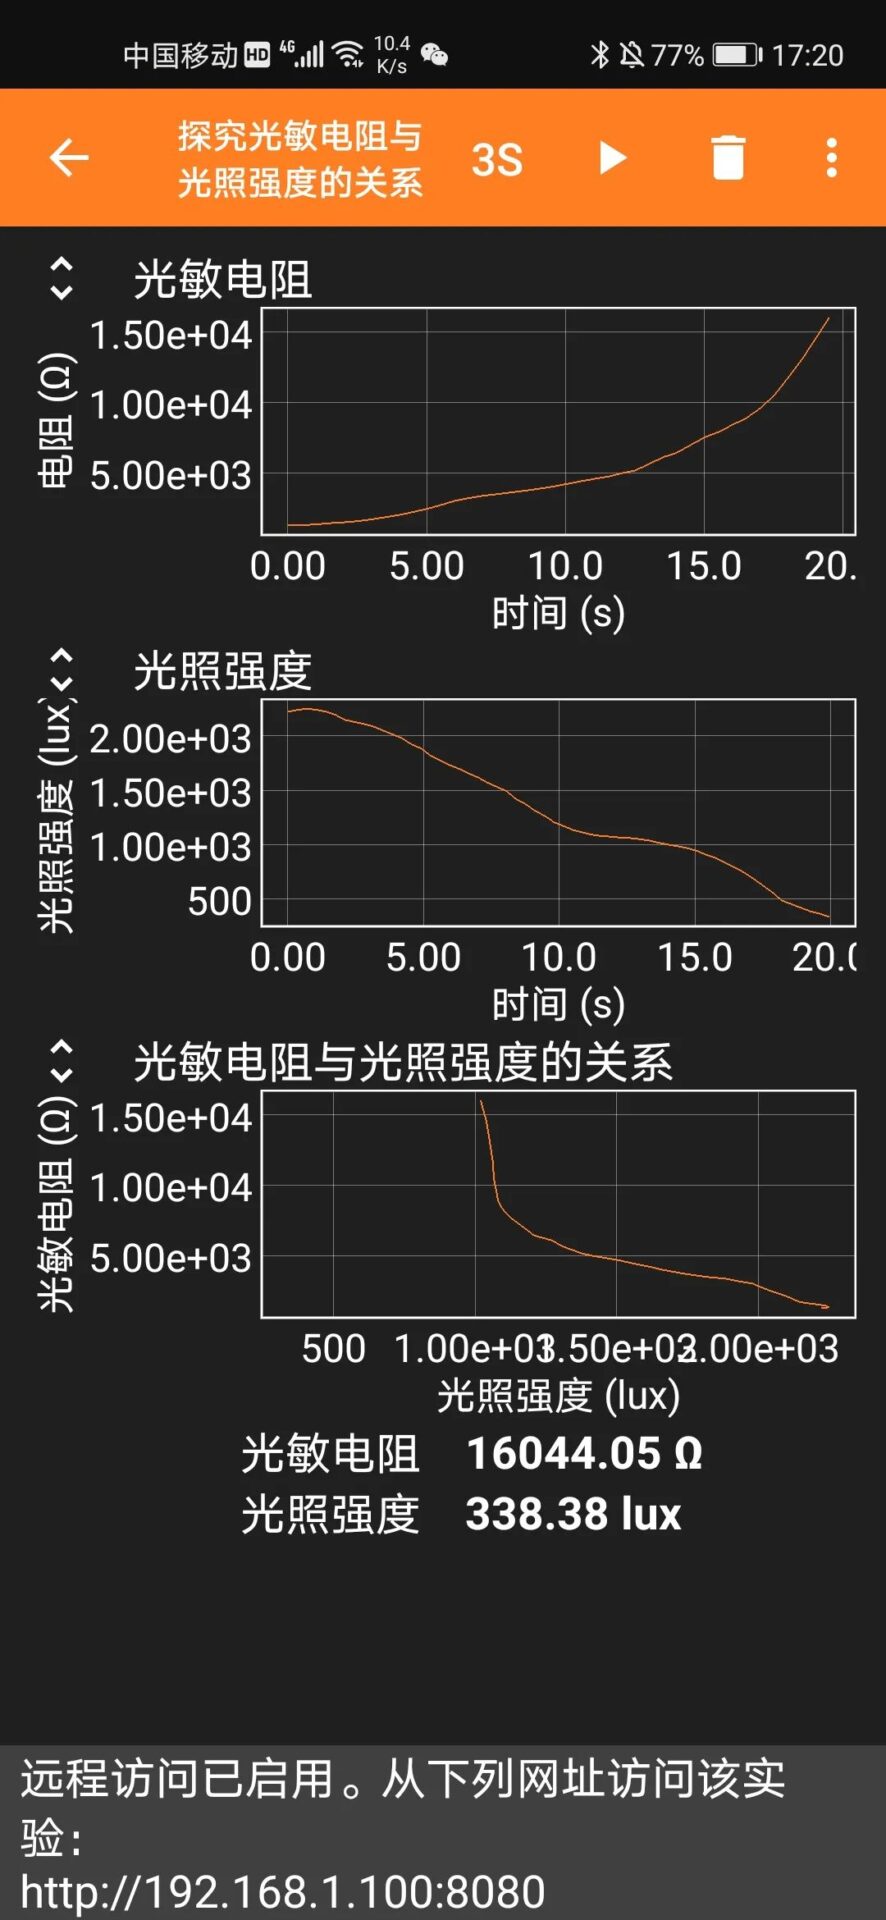
Mobile Experiment
Phyphox corresponds the instantaneous value of the photoresistor received via Bluetooth to the y-axis, and the light intensity data transmitted from the smartphone to the x-axis, automatically plotting the relationship graph between photoresistor resistance and light intensity on the smartphone screen.
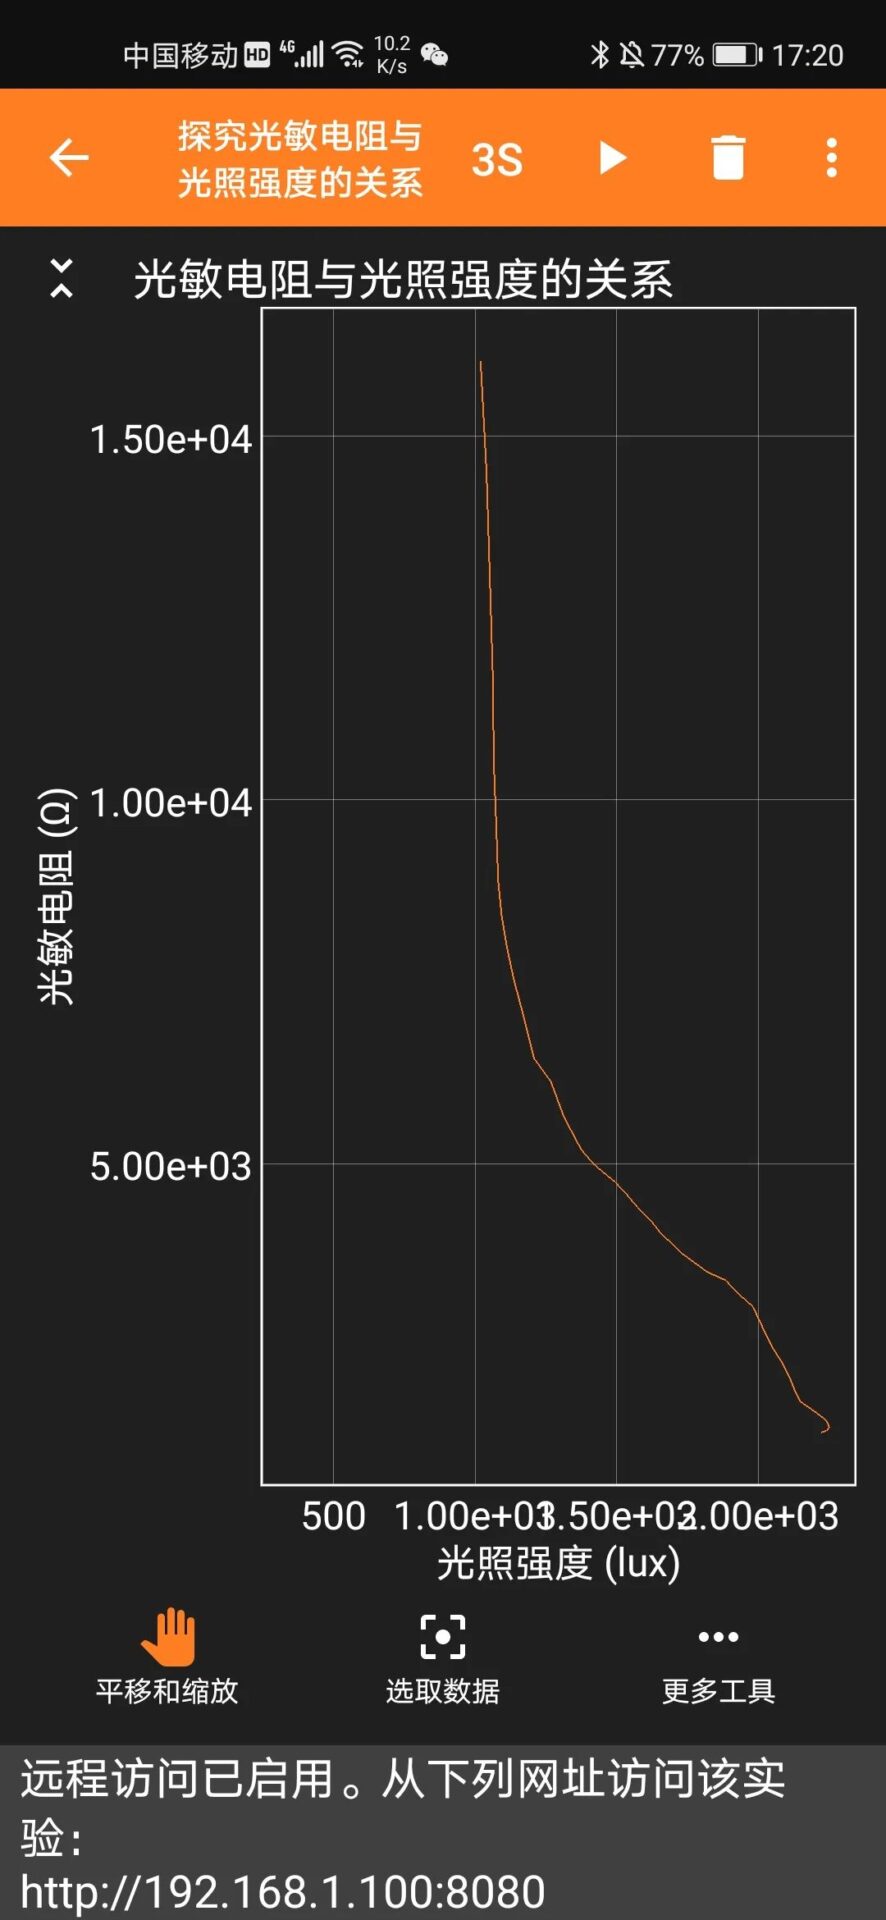
Graph of the Relationship Between Photoresistor Resistance and Light Intensity
In this experiment, due to light-blocking operations, it was inconvenient to control the smartphone. To solve this problem, I enabled remote control, using the browser on a laptop to remotely control the smartphone and monitor the experiment process in real time.
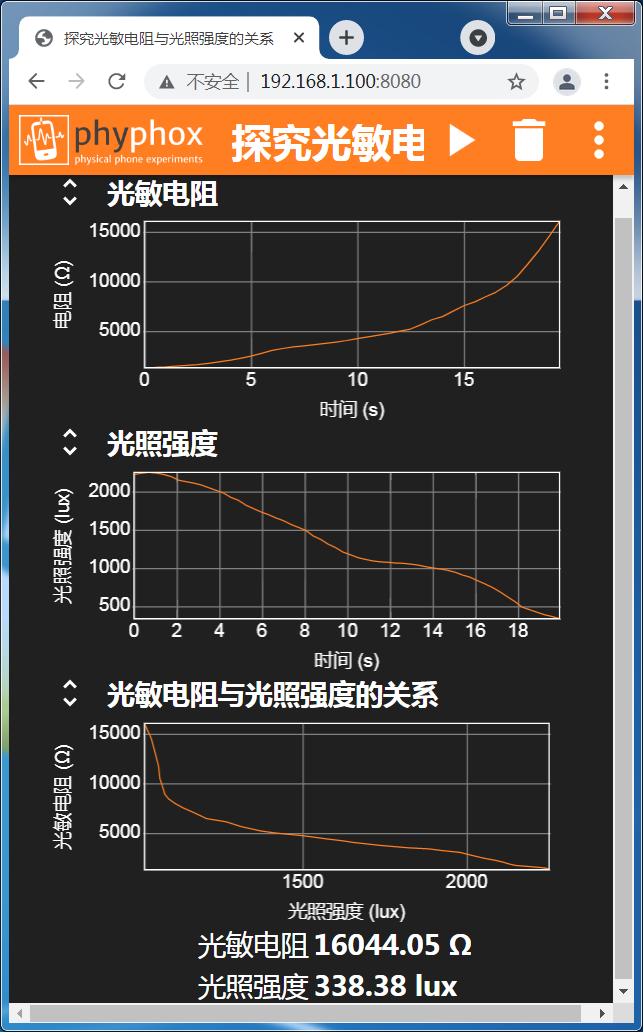
Remote Control via Laptop Browser
It should be noted that many experiments found that if the frequency of the light sensor and Bluetooth data transmission do not match, the relationship graph between photoresistor resistance and light intensity cannot be plotted and displayed correctly. I set the frequency of both the light sensor and Bluetooth data transmission to 2 Hz, which ultimately solved this problem.