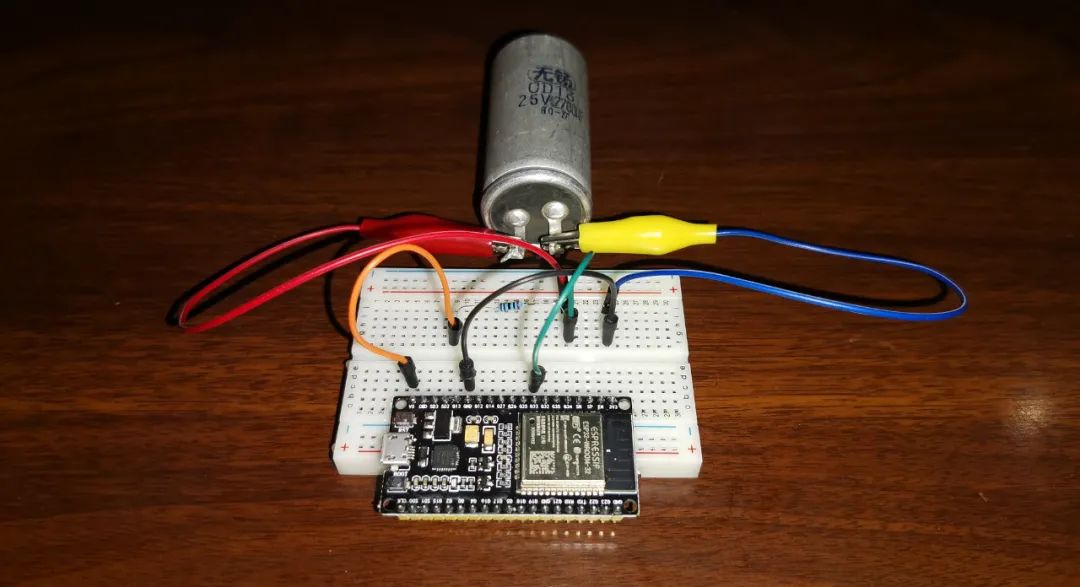
Experimental Scene
1 Introduction
Since learning Bluetooth communication with ESP32 and Phyphox during the National Day holiday in 2020, the author has been eager to solve the visualization problem of the relationship between capacitor voltage and charge, attempting to derive the charge amount by integrating the charging current, and then depict the charge-voltage relationship graph.
The ideal is beautiful, but reality is harsh. No matter how much debugging is done, the desired proportional relationship graph cannot be obtained, which is quite frustrating.
On the first day of the Lunar New Year, the author restructured this experiment, using a 2200 microfarad capacitor as the research object, with a series limiting resistor of 2000 ohms, and charged using the built-in 5V power supply of the ESP32, achieving very ideal results.
2 Design Idea
During the experiment, the voltage of the capacitor is measured using pin IO33, and then the current through the limiting resistor is calculated using Ohm’s law; the obtained voltage and current data are sent via Bluetooth to the smartphone equipped with Phyphox; Phyphox performs integration on the current to obtain the charge amount; finally, the charge-voltage curve of the capacitor is depicted in Phyphox.
3 ESP32 Programming
/*
Depict the characteristic curve of the capacitor.
*/
#include <phyphoxBle.h>
int Pin1 = 33;// Read capacitor voltage
float Ic = 0;// Capacitor current
float Vc = 0;// Capacitor voltage
float R = 2000.0; // Fixed resistance
void setup()
{
PhyphoxBLE::start(“Phyphox Bluetooth Experiment”);
PhyphoxBleExperiment plotPhotoResistor;
plotPhotoResistor.setTitle(“Depiction of Capacitor q-u Curve”);
plotPhotoResistor.setCategory(“Phyphox Bluetooth Experiment”);
plotPhotoResistor.setDescription(“Zhang Huaihua, Jiaozuo No. 11 Middle School, this experiment uses a fixed resistor R in series with the capacitor C to measure the voltage and current of the capacitor, integrate the charge, and depict the capacitor’s q-u curve.”);
//View
PhyphoxBleExperiment::View firstView;
firstView.setLabel(“MyView”); // Create a “view”
//Graph
PhyphoxBleExperiment::Graph firstGraph;
firstGraph.setLabel(“Capacitor’s q-u Curve”);
firstGraph.setUnitX(“V”);
firstGraph.setUnitY(“C”);
firstGraph.setLabelX(“Voltage”);
firstGraph.setLabelY(“Charge”);
firstGraph.setChannel(1,2);// Enable the 1st and 2nd Bluetooth channels
firstView.addElement(firstGraph);
plotPhotoResistor.addView(firstView);
PhyphoxBLE::addExperiment(plotPhotoResistor);
}
void loop()
{
float Vc = analogRead(Pin1) * 5.0 / 1024.0 / 4.0;// Read the voltage across the capacitor
if (Vc != 0.0)
{
Ic = (5.0 – Vc) / R;// Calculate the internal current of the capacitor
PhyphoxBLE::write(Vc,Ic);// Send voltage and current data via Bluetooth
};
delay(10);
PhyphoxBLE::poll();
}
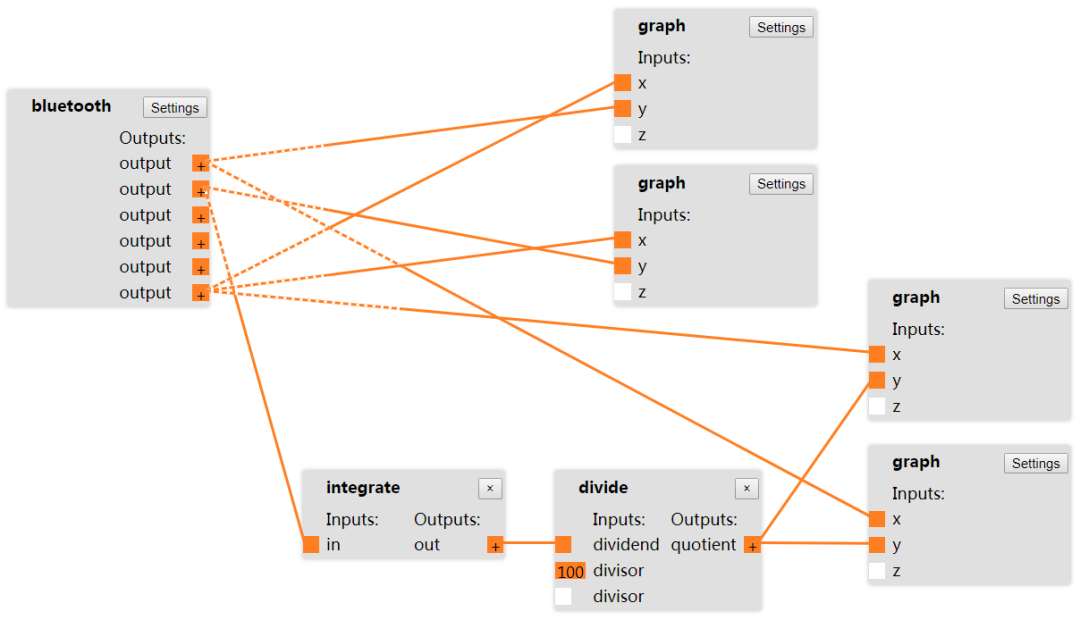
4 Phyphox Experiment Programming
In this experiment, the ESP32 measures and sends a set of voltage and current data every 10 milliseconds, while Phyphox integrates the current, accumulating the current value every 0.01 seconds, and dividing the accumulated value by the sampling frequency of 100Hz to obtain the charge amount entering the capacitor.
Add the experiment in Phyphox via QR code. Scanning the QR code below will load this experiment onto your phone.

Phyphox Experiment Loading QR Code
5 Data Analysis
Once the circuit is successfully built, normal experimental operations will allow Phyphox to automatically draw the relevant function relationship graphs.
In this experiment, the voltage-time relationship graph, current-time relationship graph, charge-time relationship graph, and charge-voltage relationship graph are sequentially plotted.
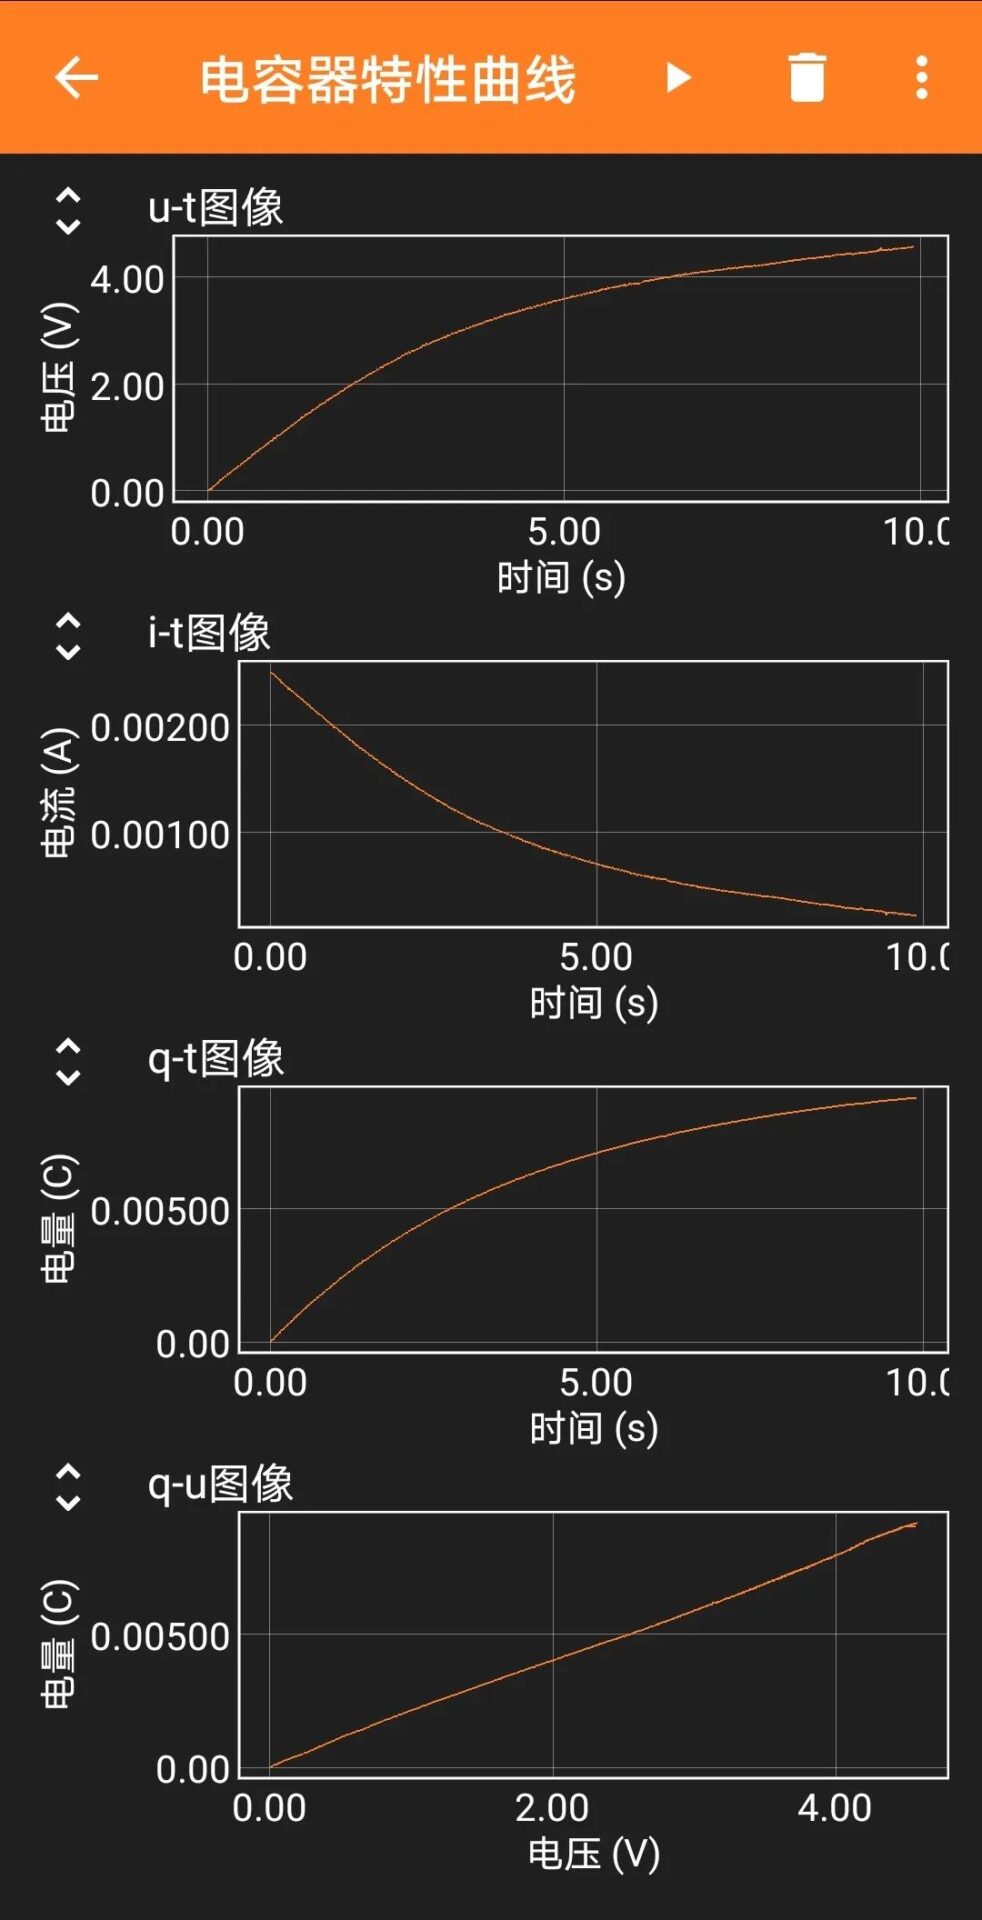
Experimental Images
By closely observing the voltage-time relationship graph and the charge-time relationship graph, it can be found that the variation patterns of charge and voltage over time are very similar.
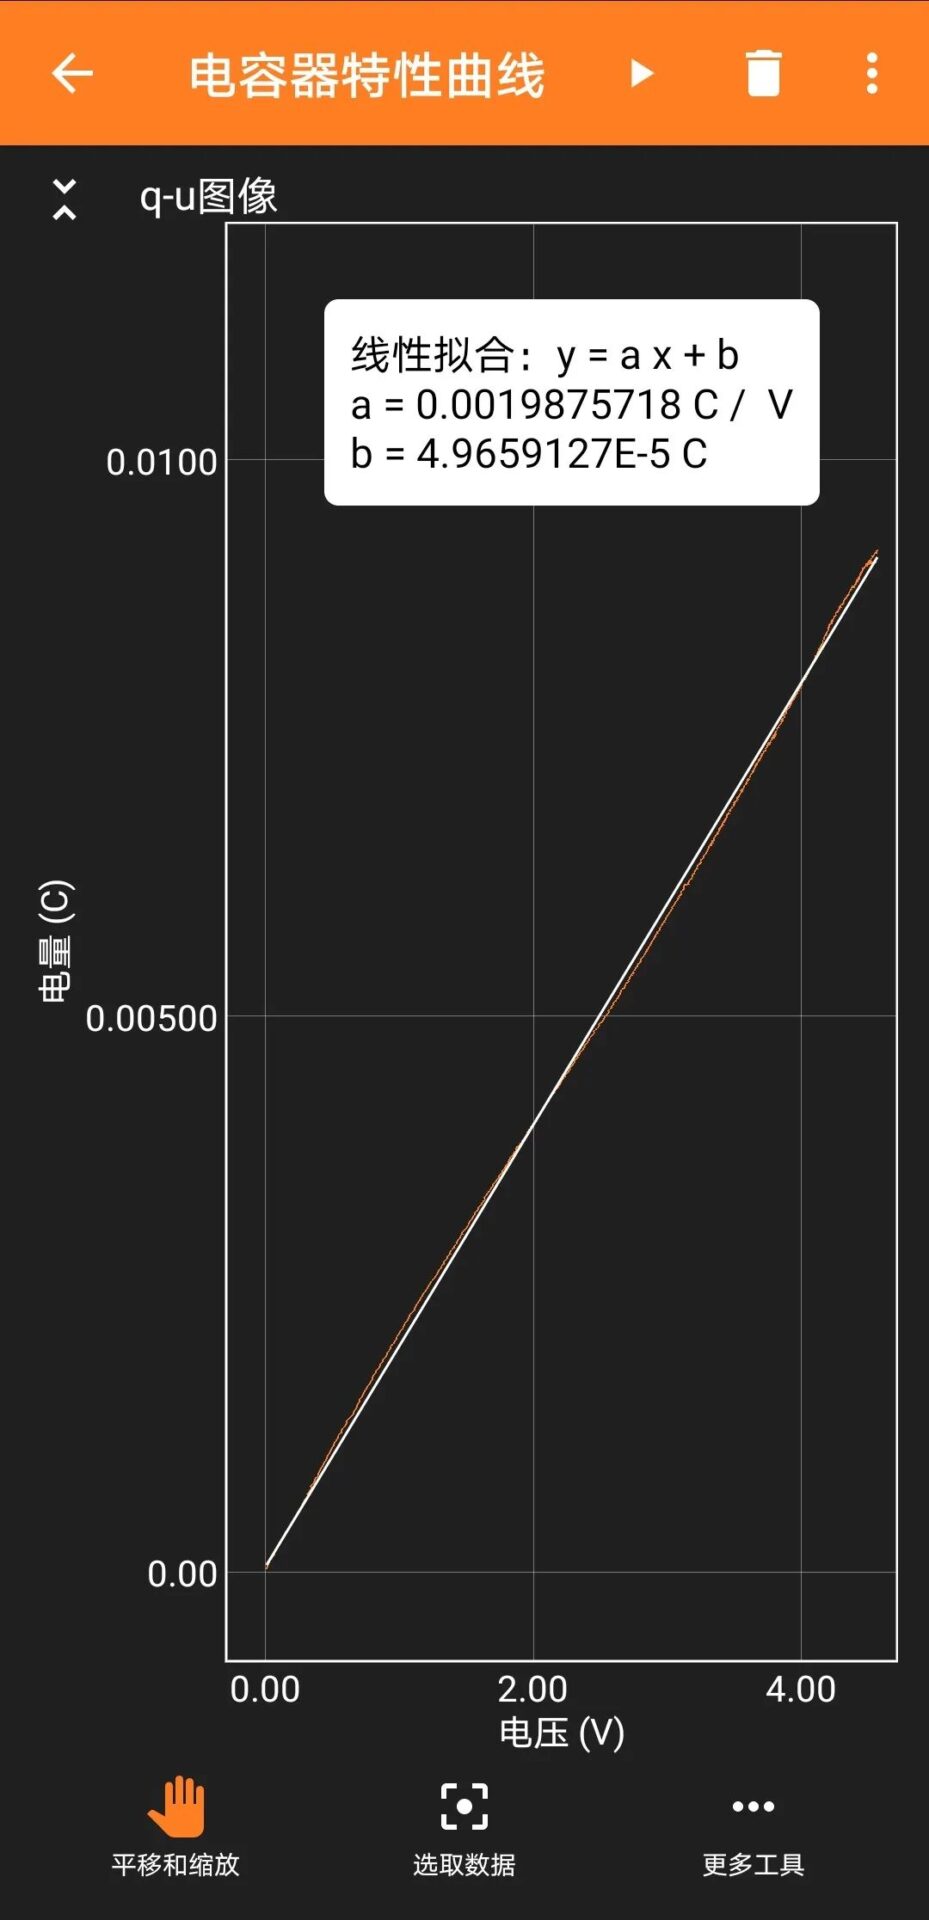
q-u Relationship Graph
When the charge-voltage relationship graph is expanded to full screen and linear fitting is performed, it can be found that the charge-voltage relationship graph is an inclined straight line passing through the origin. The slope of the charge-voltage relationship graph is 1988 microfarads, which is quite close to the nominal value of 2200 microfarads for the capacitor.
6 Conclusion
During the charging process of the capacitor, the charge amount in the capacitor is directly proportional to the voltage across the capacitor.
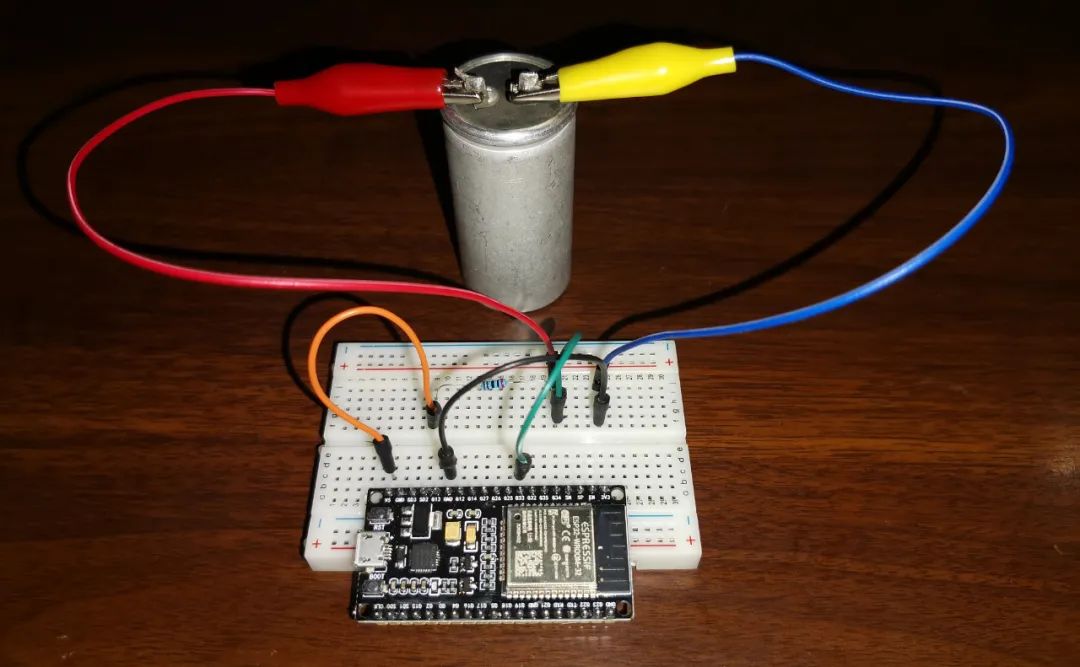
Experimental Device

| Maker Jiaozuo |
HenanMaker Jiaozuo is the WeChat public platform of the Jiaozuo Maker Education Teacher Studio, focusing on maker education, sharing maker cases, explaining innovative methods, inspiring creative design, conducting scientific explorations, organizing social surveys, guiding thesis writing, participating in maker competitions and patent applications, and discovering, nurturing, and achieving a group of students with innovative potential.
HenanPublic Number: chuangkejiaozuo
HenanFamous Teacher Blog: http://blog.sina.com.cn/updays

Long press Recognize Follow Share
– END –
