Below we present some function curves or surface plots drawn using Matlab. Since the public account cannot process EPS images, the images we screenshot are all bitmap, so you will see the ‘jagged edges’. To appreciate high-quality images with smooth edges and no jaggedness when zoomed in, please click on “Read the Original (Extraction Code: dsqb)” to preview the high-definition PDF document. (Reply in the public account: mtbltx to receive the PDF document and all example source code)
-
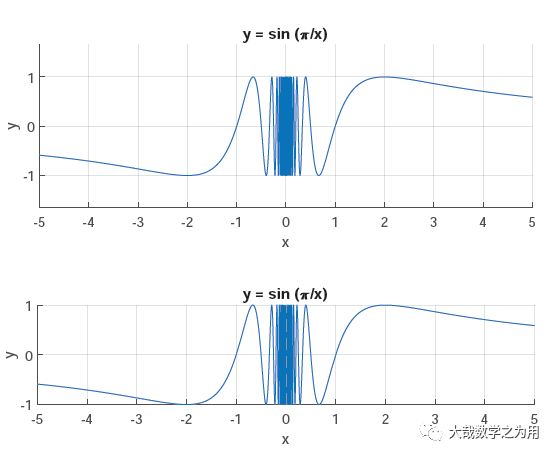
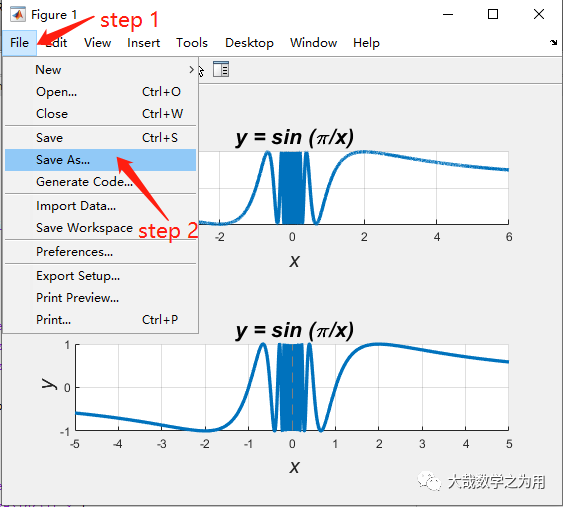
Images drawn using <span>plot</span>and<span>fplot</span>in the upper and lower windows respectively.
-
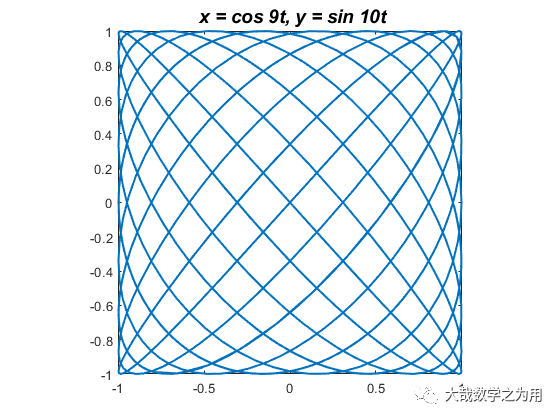
Image of the parameter equation.
-
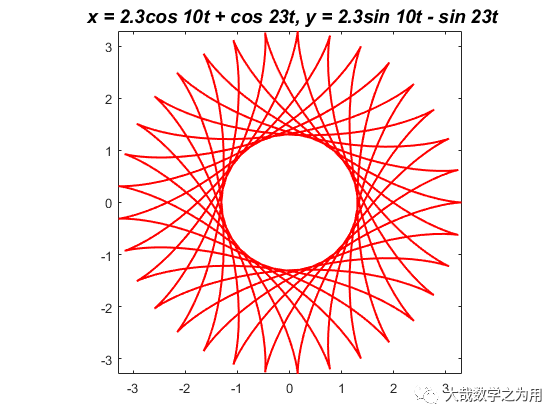
Image of the parameter equation.
-
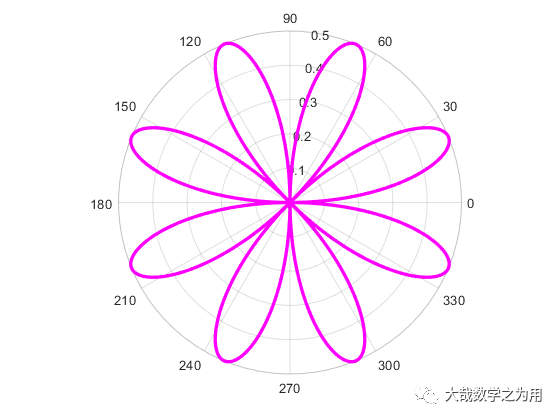
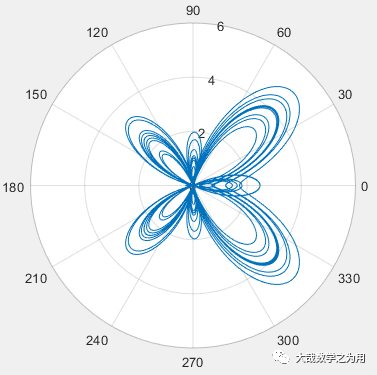
Image of the polar coordinate equation.
-
Image of the polar coordinate equation.
-
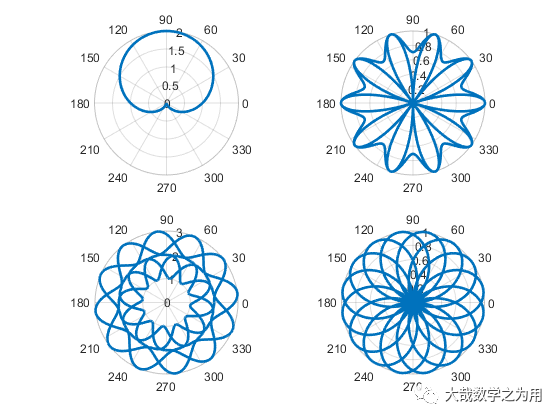
Multiple polar coordinate equations in multiple windows.
-
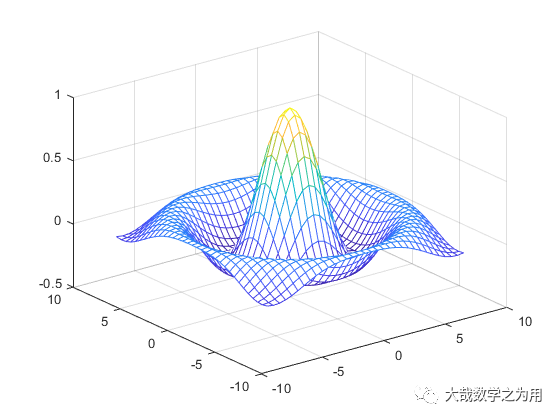
Image of the surface.
Matlab Plotting and LaTeX Typesetting
Plotting is certainly for usage. How to generate EPS format images with Matlab and insert them into a LaTeX document?
-
Draw the image with Matlab and click to open the Figure window.
-
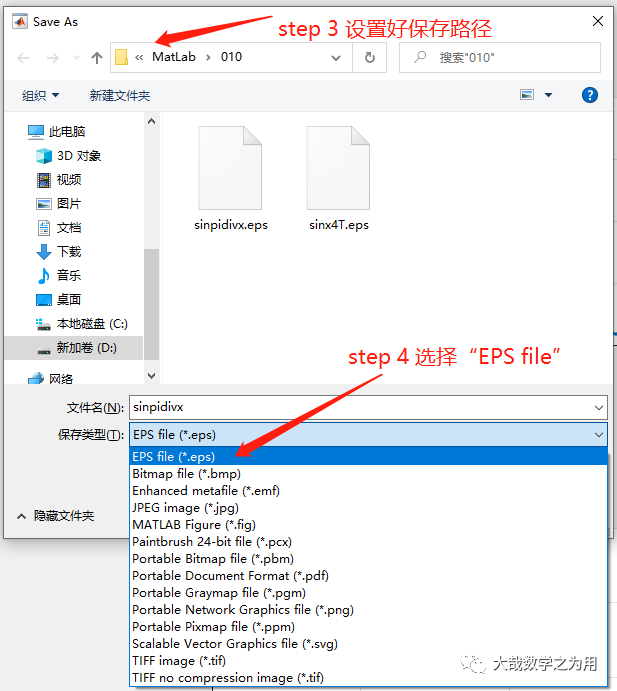
Click “ File →
-
In the pop-up dialog, select “EPS file” and confirm.
Next, I will explain how to insert the generated EPS image file into the TeX source file:
First, save the EPS format image in the same path as the TeX source file.
Then, at the place in the text where you want to insert the image, use the command \includegraphics to insert the image.
For example, to insert the image here, you can use the following command:
\begin{verbatim}
\begin{figure}[H]
  \centering
 \includegraphics[width=\textwidth]{sinx4T}
  \caption{$y= sin x$\ 4 periods of the image}\label{sinx4t}
\end{figure}
\end{verbatim}
Long press to recognize the QR code below, reply in the public account:mtlbltx to receive!

Long press to recognize the QR code and reply:003, to receive videos and e-books.
Long press the QR code above, reply:003, receive 2.5G Matlab videos + beginner to advanced e-book!
[1] Charles F. Van Loan, K. V. Daisy Fan, Insight Through Computing.
[2] Zhang Zhiyong, Mastering MATLAB R2011A.


Welcome to “like”, “view” and leave a message! Your support is our motivation to persist!