Today, let’s dive into some hardcore content! 🔥 With the help of this chip fabrication cost evolution chart, we will understand how chip manufacturing has been “spending money like water” from 90nm to 5nm. Whether you are a newly minted electronic engineer or a chip investment analysis enthusiast, after reading this, you will confidently say:
“So that’s why a 5nm chip is so expensive!” 🚗⚙️💸
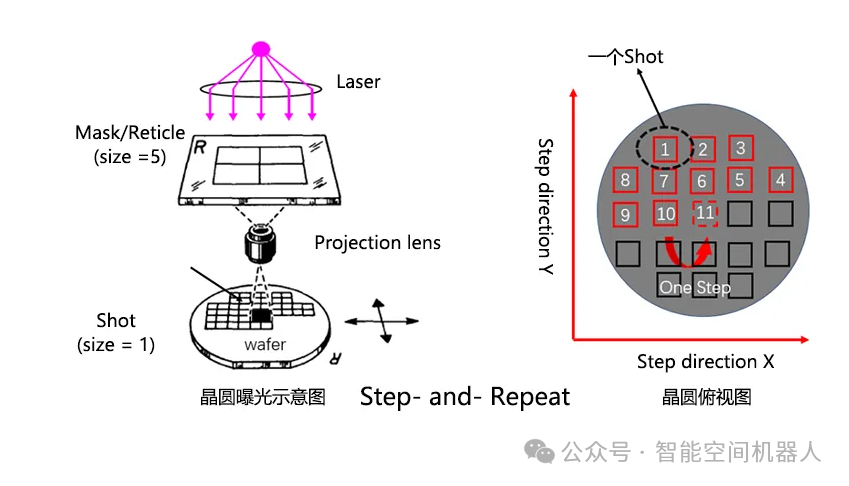
🎯 Comprehensive Analysis of Chip Fabrication Costs (90nm ➡️ 5nm)
🧱 1. When did we start burning money?
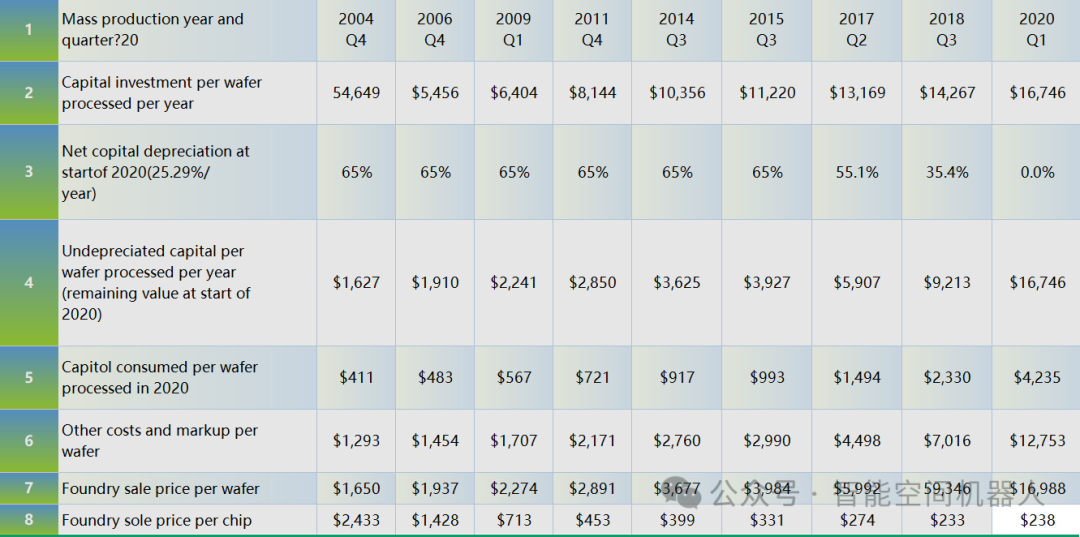
From 90nm (Q4 2004) to 5nm (Q1 2020), with each process node advancement, costs skyrocketed as if on steroids.| Node | Mass Production Time |
|---|---|
| 90nm | Q4 2004 |
| 65nm | Q4 2006 |
| 40nm | Q1 2009 |
| 28nm | Q4 2011 |
| 20nm | Q1 2014 |
| 16/12nm | Q3 2015 |
| 10nm | Q2 2017 |
| 7nm | Q3 2018 |
| 5nm | Q1 2020 |
Look at this trend 📈, Moore’s Law isn’t dead; it just got more expensive!
💰 2. Investment Cost per Wafer: A Crazy Money-Piling Machine!
| Node | Investment/Year/Wafer |
|---|---|
| 90nm | $4,649 |
| 5nm | $16,746 |
The investment per wafer has directly increased by 260%+ from 90nm to 5nm. What does this imply? 👇
- Photolithography machines have become more expensive, with EUV (Extreme Ultraviolet) equipment costing hundreds of millions 💸
- More process steps, lower yield
- High environmental requirements, significant upgrades to clean rooms and temperature control systems 🔥
🧮 3. How to Allocate Capital Depreciation?
The annual depreciation rate is uniformly set at 25.29%, assuming calculations are based on 2020. Thus:

| Node | Remaining Value (2020) |
|---|---|
| 90nm | 65% |
| 5nm | 0% |
This means:
For “old antiques” like 90nm, they have long been fully depreciated, and if the equipment is still usable, it’s profit.
However, 5nm is a completely new investment, with zero depreciation, putting immense capital pressure 😵💫!
📦 4. Capital Consumption per Wafer vs. Selling Price
| Node | Capital Consumption/Wafer (2020) | Selling Price/Wafer |
|---|---|---|
| 90nm | $411 | $1,650 |
| 5nm | $4,235 | $16,988 |
Capital expenditure has increased tenfold, and selling prices have also risen tenfold, but note ⚠️:
👇 Gross profit hasn’t become more “reasonable”:
Manufacturers are just raising prices along with costs; seeking exorbitant profits? It's not that simple.📦 5. Selling Price per Chip: An Unexpected Reversal!
| Node | Selling Price/Chip |
|---|---|
| 90nm | $2,433 |
| 5nm | $238 |
Are you surprised to see this?! How can chips become cheaper as they advance? 🔍 Here’s the truth:
- Improved wafer area utilization,allowing more chips to be cut from a single wafer;
- Increased power/performance, making the price per unit of computing power more cost-effective;
- Major clients like Qualcomm and Applehave strong bargaining power with bulk customization.
But don’t forget:
High fabrication costs ≠ expensive final chips; industry ecology, technological accumulation, and scale are decisive factors.
🔍 Summary: Understanding the Evolution of Chip Process Costs in One Chart 🔥
From 90nm to 5nm, wafer investment costs have increased nearly 4 times, while the unit chip cost has decreased by 10 times, showcasing the best representation of the chip industry's "money burning" and "economies of scale".We are witnessing a new era where “wafer is king, capital reigns supreme”.
🚀 Key Takeaways
- Why are advanced chip processes ridiculously expensive?
- Mass production times, cost structures, and profit models for each node
- Why is the unit price of 5nm chips cheaper?