This article is reprinted from the public account: Will’s Canteen
Author: A Chef Who Codes
A spectrum analyzer is a commonly used test and measurement instrument in the research, testing, and maintenance of wireless communication systems. It can perform frequency domain measurements, time domain measurements, and even vector signal analysis. If you are engaged in work related to wireless communication, mastering the use of a spectrum analyzer is an essential skill. To better use a spectrum analyzer, we must have a certain understanding of its principles.
If we classify spectrum analyzers, the most common types we see are FFT analyzers and superheterodyne analyzers. In fact, the spectrum analyzers widely used today are a comprehensive application of the principles of these two types of spectrum analyzers.
FFT analyzers are easy to understand; their principle is to directly perform a Fourier transform on the time domain, which requires sampling the signal to obtain a set of discrete data, and then performing algorithmic analysis and processing. We know that the sampling theorem requires the sampling frequency to be greater than twice the signal frequency. For high-frequency signals, this poses a significant challenge to the ADC, and due to early semiconductor technology limitations, the bit depth of the ADC was limited, resulting in limited sampling capabilities. Therefore, FFT analyzers are generally used for low-frequency signal analysis.
To meet the measurement of high-frequency signals, the superheterodyne analyzer has become a more widely used spectrum analyzer.
The term “superheterodyne” refers to mixing the local oscillator signal with the input signal to produce a signal at a specific frequency. Super indicates that the signal is converted to ultrasonic. This principle was initially proposed by Armstrong, who could use the superheterodyne principle to create superheterodyne receivers. The Armstrong here is not the brother who landed on the moon; he was an early expert in radio who invented the method of frequency modulation, having a profound impact on the development of radio technology.
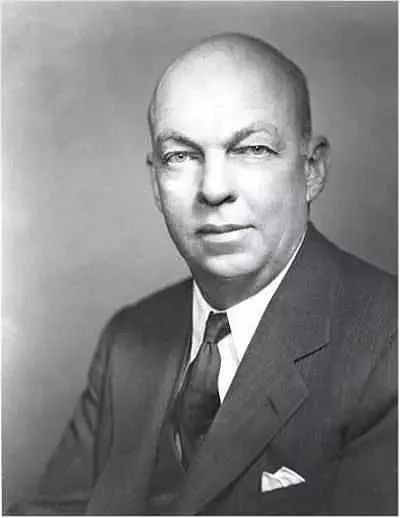
This frequency conversion reception method performs better than high-frequency direct reception methods and is still widely used in high-frequency signal receivers today. We often see many examples of receivers around us, such as radios, GPS, satellite TV receivers, etc., all of which belong to receivers. The working principle of a radio is similar to that of a spectrum analyzer; we can initially understand spectrum analyzers through radios. The role of a radio is to convert the electromagnetic waves emitted by broadcasting stations into sounds that we can hear. In fact, this does not directly convert the received electromagnetic waves into sound, but rather involves a series of processes such as carrier amplification, mixing, intermediate frequency amplification, detection, audio amplification, power amplification, and sound emission from speakers. Similar to radios, spectrum analyzers also have a series of complex processes.
Next, we can learn about the working principle of modern commonly used spectrum analyzers through the framework diagram below.
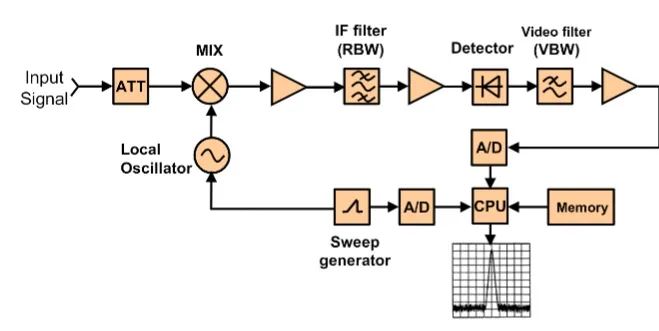
From the above diagram, we can see that the RF signal first passes through an attenuator, mixes the carrier and local oscillator, undergoes intermediate frequency amplification, intermediate frequency filtering, detection, video filtering, analog-to-digital conversion, data storage, data computation, and graphical display, among other processes. Below, we will learn about these processes sequentially.
Attenuator
Basically, the signal receiving end of a spectrum analyzer is designed with an attenuator, which effectively prevents signals that are too strong from damaging the components inside the instrument. This attenuator is usually adjustable, and during measurement, we can choose an appropriate attenuation value as needed. However, the attenuation here is internal to the spectrum analyzer, and we do not need to perform separate calculations; the measurement values displayed on the screen have already accounted for this attenuation. Of course, this attenuator is not all-powerful, as it does not provide infinite attenuation, nor is there an infinitely large attenuator. Usually, if the signal being tested is too strong, we need to connect an external attenuator, for which we need to perform certain calculations. For example, the value displayed on the spectrum analyzer’s screen plus the external attenuation value gives the actual measurement value. However, we do not need to perform this calculation ourselves; in fact, we can compensate for this attenuation value into the spectrum analyzer by setting the Ref level offset parameter. This parameter can be understood as an external calibration value. At this point, the displayed value on the screen is our measurement value. This method is extremely convenient in testing and measurement and is the most widely used method.
Although the attenuator can effectively protect the instrument’s safety, it also brings a downside: setting attenuation reduces the input signal and lowers the signal-to-noise ratio, which can impact the testing sensitivity.
Remember, when using a spectrum analyzer, always estimate whether the measured signal is within the safe range of the spectrum analyzer, which is generally marked with the maximum power size at the input port.
Mixing and Mixer
Similar to the principle of a radio, the superheterodyne spectrum analyzer does not measure the original carrier frequency signal directly; it also needs to mix the measurement signal to generate an intermediate frequency signal for measurement. So, the question arises: what is mixing? With whom is it mixed?
Mixing refers to the process of changing a signal from one frequency to another; it is the process of linear shifting of the spectrum.
The RF devices used for mixing in RF are called mixers, which require an RF input signal and a local oscillator signal, producing a new mixed frequency signal by multiplying the two signals, which is the intermediate frequency signal we refer to here.
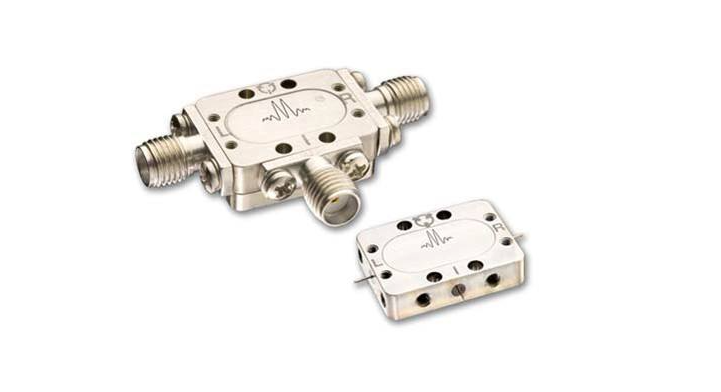
Everything in communication is based on mathematics. Here we can understand mixing through trigonometric function identities. Let’s assume Y is the RF input signal and L is the local oscillator signal:
ππ
We multiply the two signals, which is mixing:
From the above formula, we can see that the two signals, after passing through the mixer, will generate signals at the sum and difference of the two signal frequencies, indicating that the signal has undergone spectral shifting.
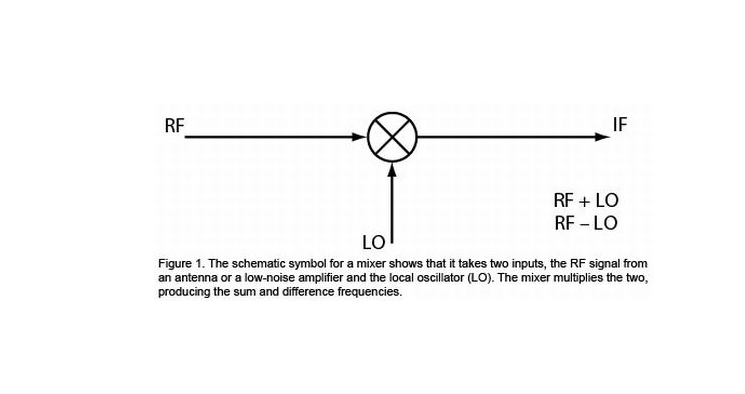
Although the above is derived through real signals, the same principle applies to complex signals, which we will not elaborate on here.
Returning to the main topic of this article, the mixing function of the spectrum analyzer requires two key components to implement: the mixer and the local oscillator. The spectrum analyzer will mix the received RF signal with the local oscillator signal generated by the local oscillator through the mixer to produce an intermediate frequency signal, facilitating the next stage of signal processing.
Intermediate Frequency Filter
After the RF signal is mixed, the generated intermediate frequency signal is the desired signal, while the signal prior to mixing is the unwanted signal. So, can we just add a low-pass filter? However, for mixers, their internal structure consists of nonlinear devices, and thus the RF signal after mixing also produces intermodulation and interference signals. Therefore, to accurately distinguish the intermediate frequency signal, a filter with a bandwidth sufficiently narrow is typically required to separate signals with very close frequency intervals. This is the intermediate frequency filter, which can suppress other signals outside its bandwidth.
When we use a spectrum analyzer for testing, we often adjust an important parameter called RBW (Resolution Bandwidth), which actually corresponds to the bandwidth of the intermediate frequency filter (generally representing the 3dB bandwidth of the intermediate frequency filter).
Adjusting the size of RBW often has a certain impact on the spectrum; the smaller the RBW value, the more detailed the spectrum graph, while the lower the noise level.
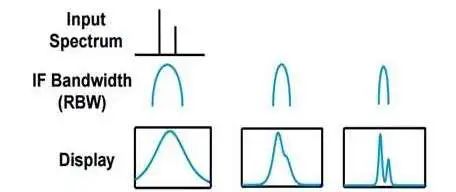
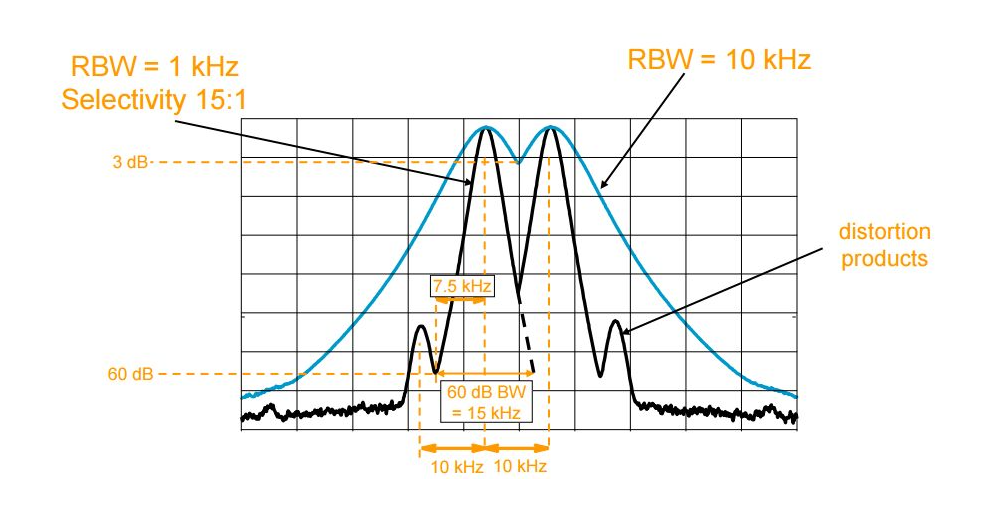
However, the testing time will also correspondingly increase. Generally, choose an appropriate value based on the actual situation for setting.
Sweep Generator
Having learned about the mixer, local oscillator, and intermediate frequency filter, let’s consider a question. If we are measuring a bandwidth signal, since the intermediate frequency filter is a narrowband filter, to measure each frequency signal, we would need to apply such a narrowband filter at each frequency. In practice, this approach is very unrealistic.
If we want to measure bandwidth signals, to simplify the design, we can keep the intermediate frequency fixed and change the local oscillator frequency to keep the intermediate frequency at a certain frequency, allowing the intermediate frequency signal processing circuit to remain the same.
How do we change the local oscillator frequency? This is done by the sweep generator, which can control the output frequency of the local oscillator, thus converting different frequency signals into the same frequency intermediate frequency signal. The sweep bandwidth can be set by us, corresponding to the parameter Span on the spectrum analyzer, which also corresponds to the frequency range being measured, that is, the frequency bandwidth displayed on the spectrum analyzer screen. In addition to the bandwidth, we also need to specify the starting frequency (Start Frequency) or stopping frequency (Stop Frequency) to determine the test range. Of course, during instrument use, we do not need to calculate the starting or stopping frequency of the local oscillator based on the instrument’s intermediate frequency; for convenience, we set it directly to the actual test spectrum’s starting and stopping frequencies, and the instrument will automatically make the necessary adjustments to generate the corresponding local oscillator frequency.
Generally, spectrum analyzers have a few forms of Zero Span, Full Span, and Custom Span. Zero Span corresponds to the time domain situation of the signal because the sweep bandwidth is 0 at this time, and the measurement result displays the time domain result at the corresponding center frequency point, similar to the function of an oscilloscope. Full Span is also easy to understand; it corresponds to the measurement of the full bandwidth, although due to hardware limitations, this full bandwidth is not infinite, and different instruments have different ranges, so everyone should pay attention when using different models of spectrum analyzers. Custom Span is a commonly used testing form; to better test and observe the measured signal, we usually need to determine the test frequency range according to the test signal and requirements, allowing us to set it through custom means. Typically, we set the center frequency point and then set a Span bandwidth, and the spectrum analyzer will automatically adjust the starting and stopping frequencies. Of course, we can also manually adjust the starting and stopping frequencies.
Detector
Modern spectrum analyzers generally use digital LCD screens, and the data display can only be described by discrete pixel points. Compared to high-frequency signals, these discrete pixel points appear quite limited and cannot fully describe a signal. Therefore, we also need to sample the original signal through algorithms. Sampling refers to dividing the actual signal into multiple segments and deriving a point to represent the value corresponding to this pixel point through a certain algorithm. The resulting pixel values are then displayed on the screen, representing the final test results of the signal. This process is called detection, and the signal after detection is referred to as the detected envelope signal.
Generally, spectrum analyzers have several detection methods, and the differences in detection methods mainly reflect the differences in algorithms.
- Peak Detection: Selects the maximum value in the corresponding segment.
- Minimum Peak Detection: Selects the minimum value in the segment.
- Automatic Peak Detection: Simultaneously selects both maximum and minimum values.
- Sample Detection: Selects values at specific positions.
- Root Mean Square Detection: Takes the RMS value of the points in the corresponding segment.
- Average Value Detector: Takes the average value of the points in the corresponding segment.
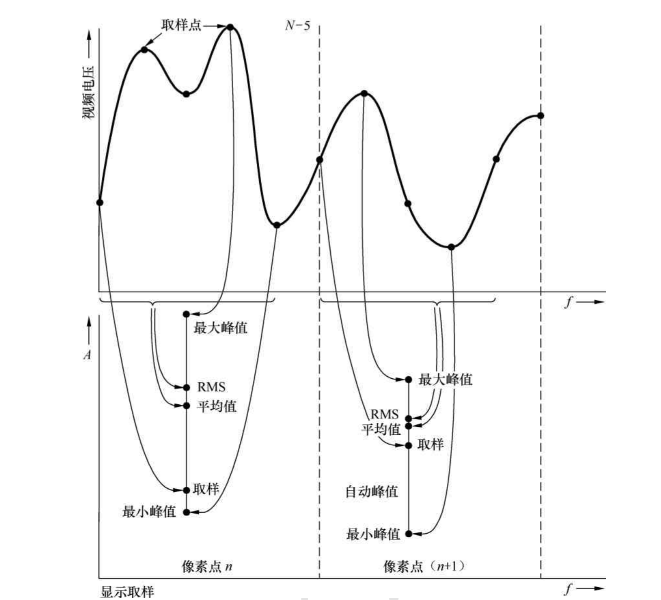
For peak detection, minimum peak detection, and automatic peak detection methods, since they select maximum or minimum values and ignore the randomness of noise, they cannot accurately reflect the actual noise situation. Sample detection can better reflect noise randomness, but its downside is that it cannot accurately reflect the signal peaks. Average value detection and root mean square detection select all the points in the segment for computation and yield a point, so they can better represent the characteristics of all points in that segment.
In daily testing and measurement, we can choose the appropriate detection method based on the actual testing situation.
Video Filter
After detection, the detected envelope signal enters the video filter. The video filter is a low-pass filter primarily used to smooth the noise display. In spectrum analyzers, there is a setting for video bandwidth (VBW), and we can smooth the noise in the spectrum display by reducing the video bandwidth (VBW), which is very helpful for displaying small signals.
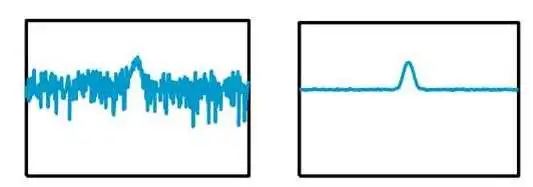
However, the VBW setting is not arbitrary; it is related to the RBW setting, otherwise, it will affect the accuracy of signal testing. Generally, when we change the RBW, the default value of VBW is equal to RBW.
The relationship between the sizes of VBW and RBW varies with the following types of signals:
- Sine Wave
- Pulsed Signal
- Random Signal
For sine waves, the default value of VBW can generally be used, that is, VBW equals RBW. If the measured signal is too small, VBW can be appropriately reduced to smooth the noise, at which point VBW is less than RBW. For pulsed signals, it is somewhat different; to obtain more accurate test values, a larger VBW is often required, making VBW greater than RBW. For random signals, due to their random variability, the signals scanned in the spectrum are also random each time, so to display more smoothly, we need to set a narrower VBW value, which makes VBW less than RBW, for example, the ratio of VBW to RBW is 1:100 or even 1:1000.
Analog-to-Digital Converter (ADC)
As mentioned earlier, most modern spectrum analyzers also have some digitization capabilities, adding an ADC after the video filter to convert the signals into digital form and process the digital signals, which can enhance the instrument’s testing capabilities. Through algorithmic processing, it can be used to test various complex signal formats, significantly improving testing speed and dynamic range.
Many users often encounter the error IF Overload during operation, which occurs when the signal under test exceeds the Reference Level. The reference level here is essentially the maximum voltage value of the ADC. Therefore, when the reference level is not set accurately, the measurement value may also be inaccurate. However, for ease of understanding, we can treat the reference level as the maximum value that can be displayed on the screen. Generally, we can set the value of the Reference Level to be about 10dB higher than the actual signal.
Conclusion
No matter what model of spectrum analyzer, the principles are mostly the same. After understanding the working principles of spectrum analyzers, I believe everyone will be more familiar with the use of various models of spectrum analyzers and, when testing signals in various environments, only by understanding the principles can we set various parameters more accurately and reasonably to facilitate the measurement of the signals we want to test. Quickly try using your spectrum analyzer!
— End —
This article is reprinted from the public account: Will’s Canteen
Author: A Chef Who Codes

Note: 【RF Classroom】Reprinted, all original articles belong to the original author. Sharing is for learning purposes. If there are any objections, please contact RF Classroom for deletion or modification. Wishing you much learning and gain at RF Classroom!For groups/recruitment/reprints/cooperation/submissions/promotion, contact RF Carpenter(RF_Centered)Essential for RF
【RF Data Download】【Essential for RF Basics】【Must-Read Wonderful Articles】