

Recently, while debugging the FPGA Ethernet communication at 1Gbps using the RTL8211 Ethernet chip and XCKU series FPGA, I encountered several issues during the debugging process. Although Ethernet below 1Gbps is relatively simple, I have documented the various challenges I faced in the order of debugging and analysis.
1. Clock Constraints and [DRC AVAL-244] Issues
After completing all the code and simulations, the first issue encountered was the clock constraints and [AVAL-244] problem after compilation.

1. Clock Constraint Issues
It is necessary to apply some constraints to rgmii_rx_clk, but this issue is not significant. Vivado will prompt which constraints to add in the message area, and I just need to add the suggested constraints.

2. [DRC AVAL-244] Issues
After adding the ILA, a clock error for the ILA will be reported.
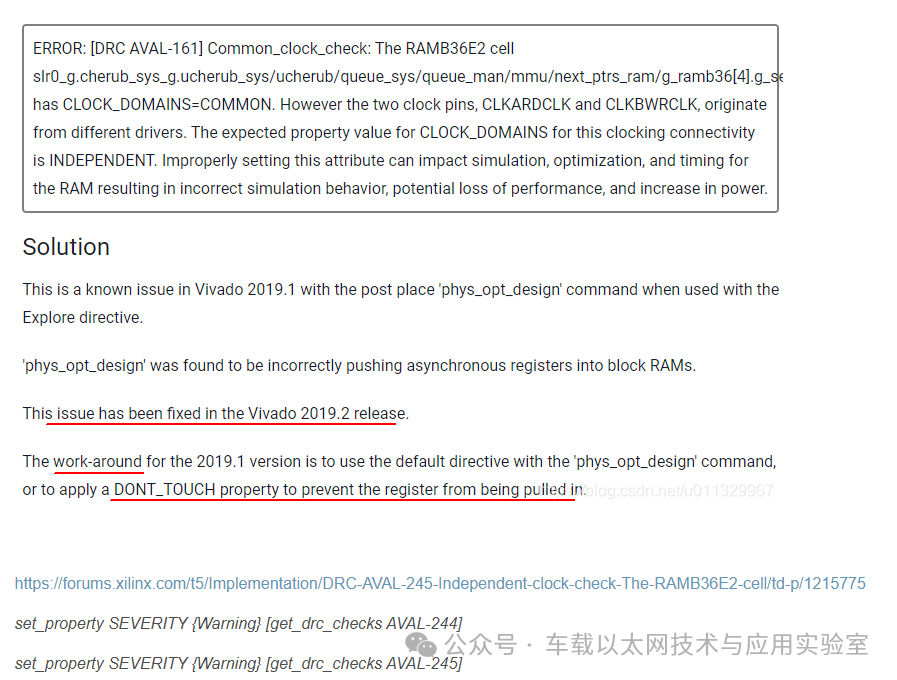
Add the following constraints:

2. Reset Issues
After the entire project was compiled and programmed, it continuously displayed no clock input [Labtools 27-3361] The debug hub core was not detected. The ILA uses rgmii_rx_clk, which is processed through a buffer and MMCM to generate the internal clock.

Confirm the hardware reset issue; the reset pin is provided by the FPGA to the PHY chip, active low, and is held high by the FPGA.
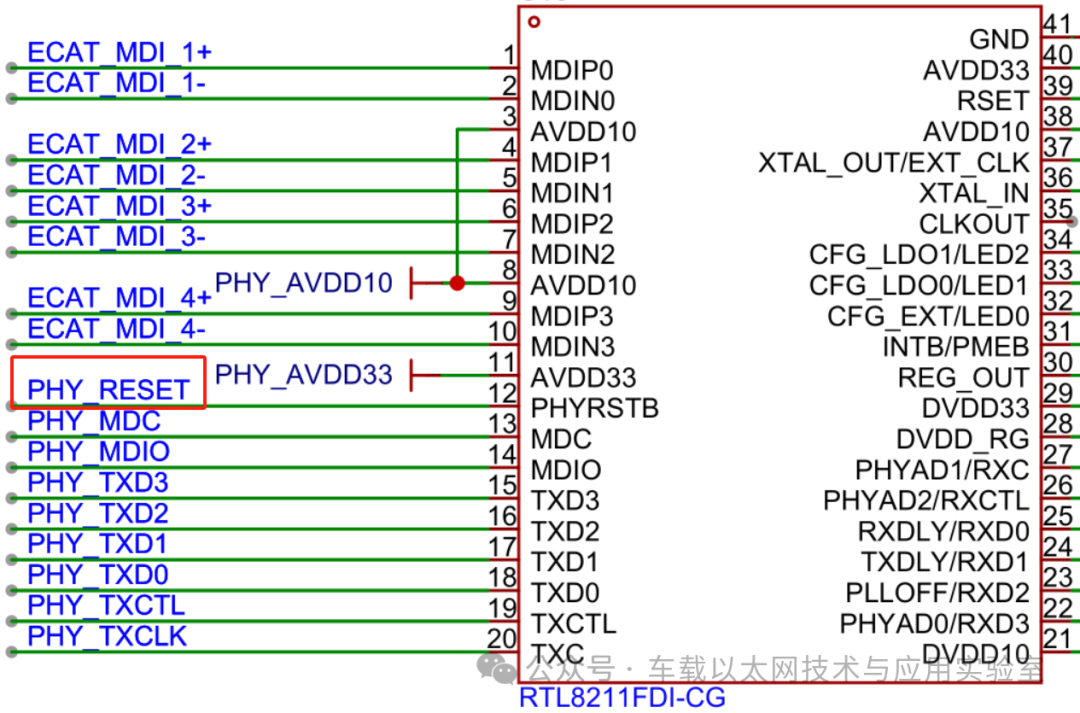
Due to the hardware connecting the originally 1.8V standard voltage bank to 3.3V, the PHY chip mistakenly believes that the FPGA’s high signal is not pulled high, remaining in a reset state. Temporarily not controlling this pin on the FPGA can resolve the issue, but ultimately hardware modification of the bank is required.
3. Download Speed and Network Speed Issues
After resolving the reset issue, the bitstream download still shows the aforementioned ILA has no clock input, while rgmii_rx_clk can be captured with an oscilloscope.
When encountering this issue, typically two steps are taken:
① Check the status of the network port lights;
If the board does not light up the network port after power cycling, it may be because the Vivado hardware manager was not closed after the last programming, causing the board to remain in JTAG boot mode upon power cycling, which may prevent the network port from functioning. After closing the hardware manager, power cycle the board again and check if the network port lights up and if the network icon is displayed on the PC.
② JTAG programming speed and Ethernet port speed mismatch issues;
The ILA clock must be at least twice the JTAG programming speed. It was found that due to previous debugging, the PC’s network port was set to forced 100Mbps, causing the rgmii_rx_clk clock to drop to 25MHz, while JTAG was at 15MHz. Therefore, either switch back to Gigabit Ethernet or adjust the JTAG programming speed.
1. The method to modify JTAG is in this post. Debugging Experience 01: After the ILA interface pops up, it cannot trigger data; or when adjusting the JTAG clock in Vivado, the FPGA clock is present but the ILA cannot trigger – CSDN Blog
Modify in the open new target section of the hardware manager.
2. The method to modify Ethernet speed is as follows:
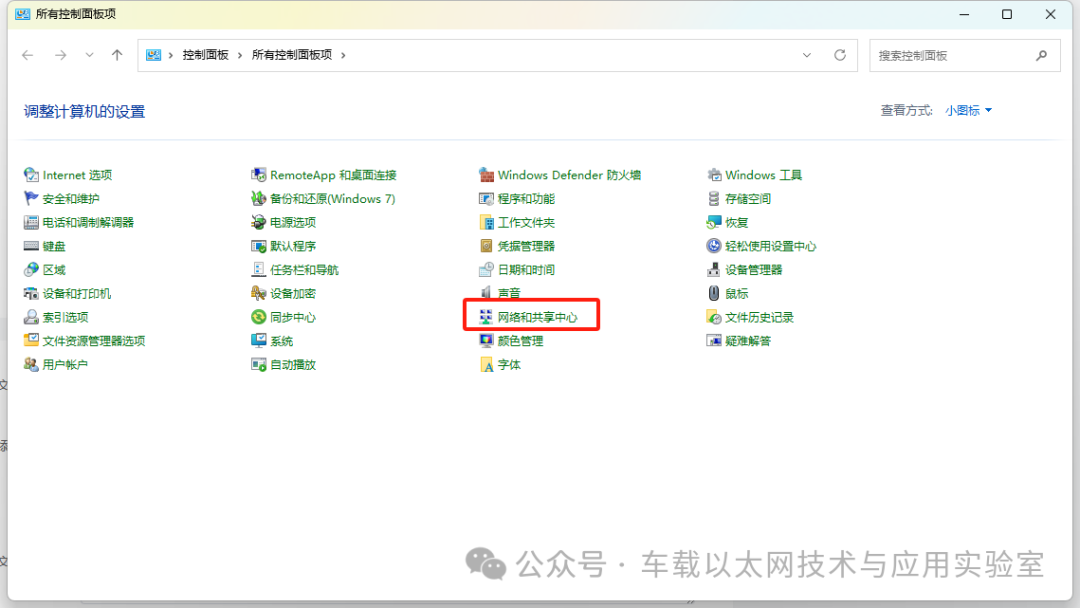
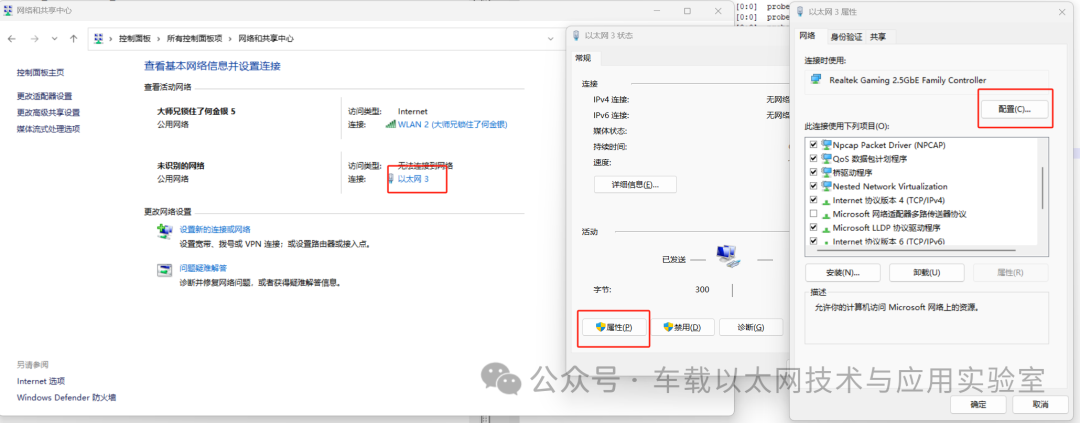
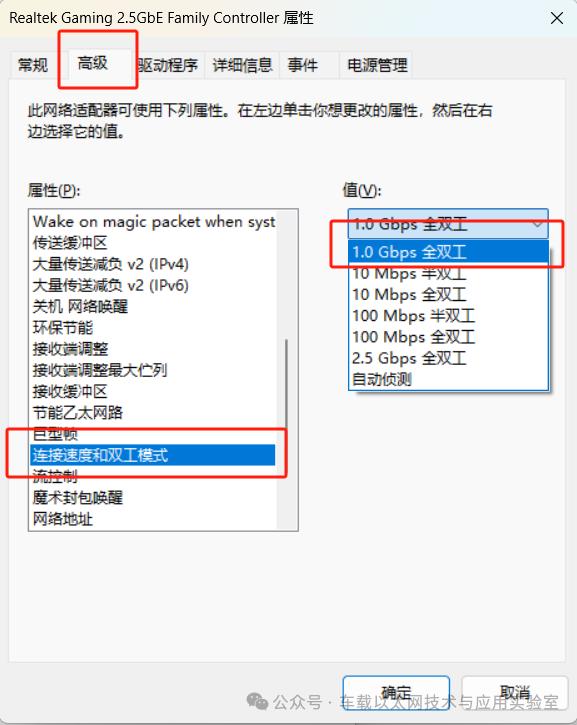
4. IP Binding Issues
After resolving the clock issues mentioned above, I opened the network port debugging assistant to send UDP data. By using Wireshark or ILA, I observed that it was continuously sending broadcast frames, indicating that the IP and MAC were not successfully bound. The FPGA program does not include the ARP protocol, so manual binding is required. The set IP address is 192.168.0.2, and the MAC address is 00-0a-35-01-fe-c0. Binding the MAC requires running CMD with administrator privileges.
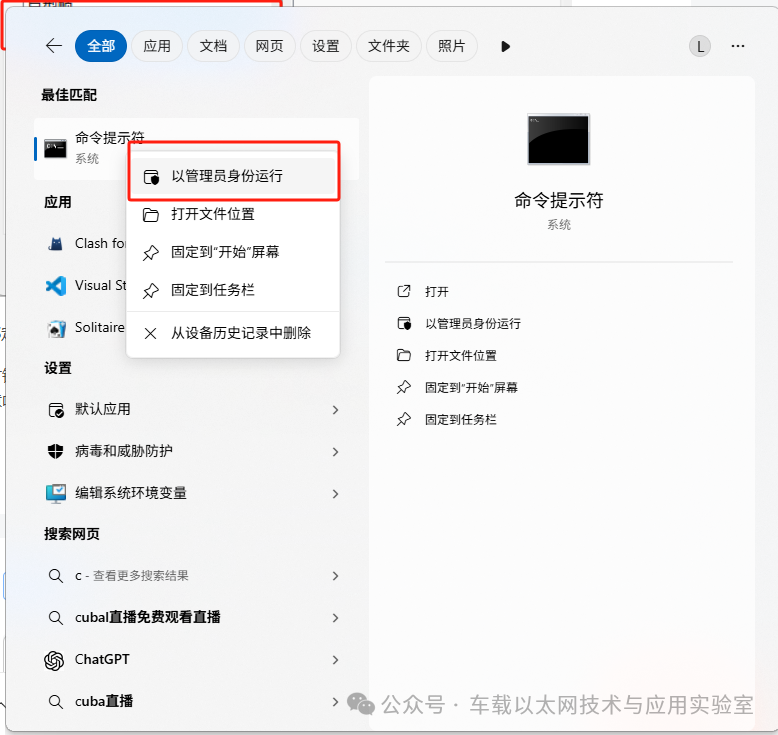
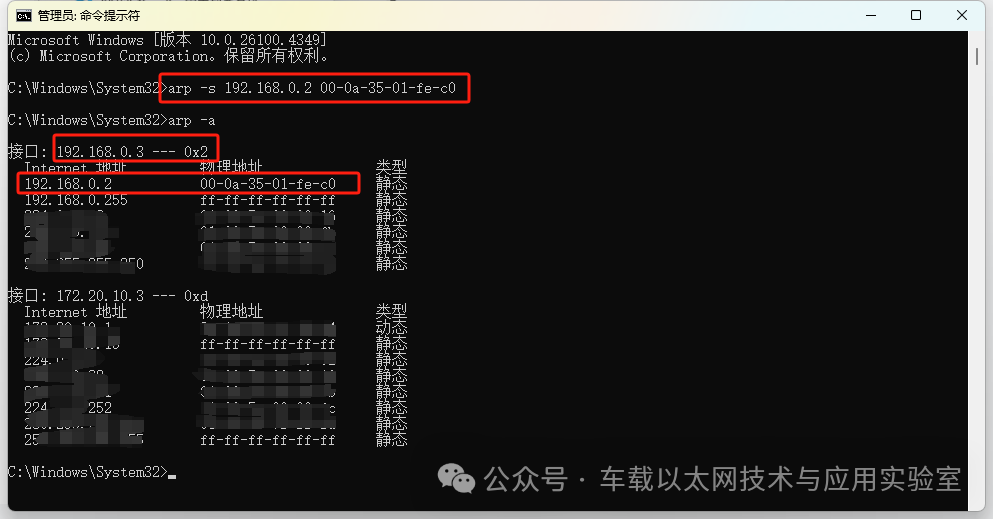
After binding, confirm that the FPGA’s IP and MAC are bound under the PC network port 192.168.0.3. If WiFi is enabled, it may occasionally bind the FPGA’s IP and MAC to an address other than 192.168.0.3, which will still result in the FPGA’s MAC address being unfindable.
The solution is to disable WiFi and attempt to rebind. If it still cannot bind to the .3 address, modify the FPGA’s IP address and rebind the new IP and MAC.
5. No Return Frames from TX, PHY_TXDLY Pin Issues
After completing the above operations, I was finally able to transmit the correct Ethernet frames through the network debugging assistant. The FPGA is a loopback project, needing to return the received data to the PC. However, at this point, Wireshark could not capture any return frames, while the ILA could see that the sent frames were completely correct.
After analysis, it was found that the issue was between rgmii_tx_clk and rgmii_tx_data. Due to wiring issues, the clock and data arriving at the PC were misaligned, causing the PHY chip to collect incorrect data using rgmii_tx_clk, leading to frame parsing errors and no return frames to Wireshark.
1. This can be resolved by pulling up the dedicated delay pin of the PHY chip, which shifts rgmii_tx_clk by 2ns.
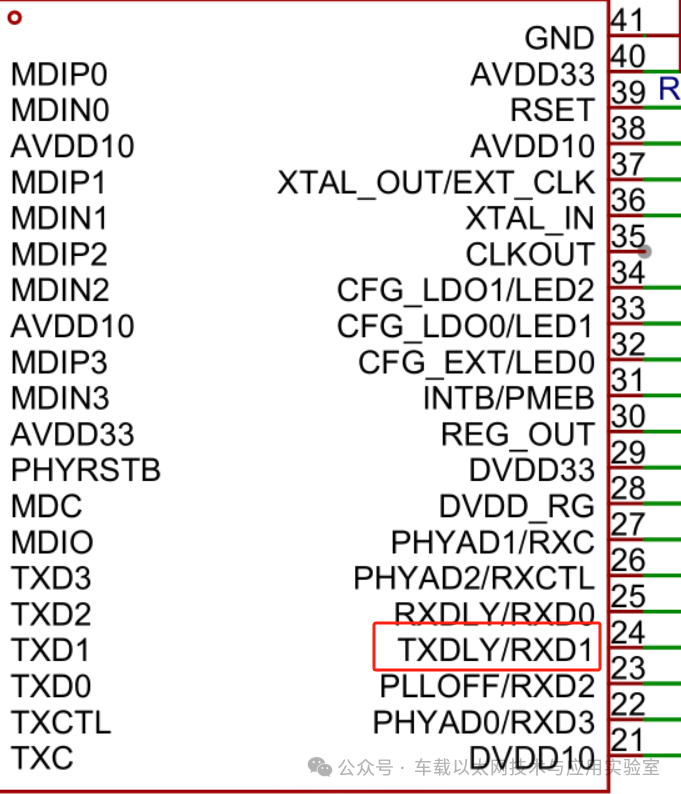
2. By using the internal MMCM/PLL of the FPGA, shift rgmii_tx_clk by 90 degrees (2ns) before outputting it to the PHY chip. If the 8-bit data captured at the rgmii_rx_clk end does not match with Wireshark, consider shifting rgmii_rx_clk by a certain time before capturing.
6. No Return Frames from TX, UDP Header and Checksum Issues
In the UDP frame, there is a UDP and checksum section that can usually be omitted. If you want to omit it, this value must be set to 16’h0000; do not assign any other non-zero value, as this will cause the network debugging assistant to not receive data.
7. Viewing Ethernet Status through Non-Transmission RX Signals
Ethernet status information is usually obtained by reading the PHY chip through MDIO. In fact, the RX signal when no data is being transmitted can also indicate the Ethernet status, represented as follows.


Disclaimer: We respect originality and emphasize sharing; the text and images are copyrighted by the original author. The purpose of reprinting is to share more information and does not represent the position of this account. If your rights are infringed, please contact us promptly, and we will delete it immediately. Thank you!
Original link:
https://blog.csdn.net/weixin_44149418/article/details/148838298