Haitong Securities: Chen Ping, Xie Lei, Yin Ling, Zhang Tianwen
At this point, we discuss the trends in the NOR Flash industry and the annual economic outlook. On one hand, NOR manufacturers’ second-quarter performance is about to be announced, while the first-quarter performance of related companies has not fully reflected industry changes; on the other hand, related targets and the industry fundamentals have also changed (e.g., Switch’s unexpected strong sales and Zhaoyi Innovation receiving feedback from the Securities Regulatory Commission, etc.). At the same time, we have raised our expectations for demand driven by AMOLED and TDDI NOR, and we will calculate the supply-demand gap in detail in order to qualitatively and quantitatively study future trends;
Automotive Electronics and Industrial Control Drive Industry Trend Reversal, TDDI + AMOLED New Demand Adds Fuel to the Fire
1. Automotive and Industrial Control Drive Trend Reversal in 2016
From various aspects, 2016 is a turning point for NOR. First, why has the NOR market continued to decline in the past? On one hand, NAND has replaced NOR in the smartphone field due to its higher cost-performance ratio; on the other hand, shipments of feature phones have continued to decline.
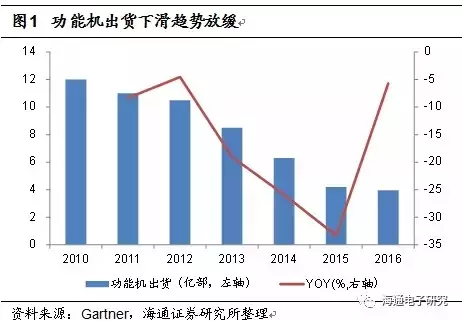
However, the current situation is that the replacement by NAND has been completed, and applications in smartphones have stabilized in areas such as ISP, TDDI, AMOLED, as well as low-end feature phones, while there is still a large market in the feature phone sector and the decline in growth rate has also leveled off.
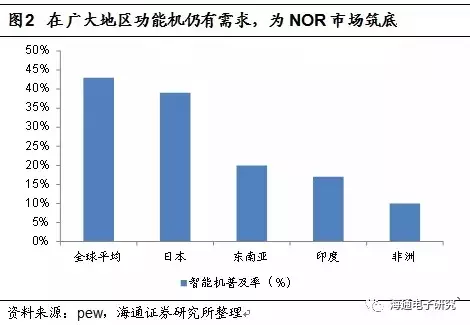
According to Gartner, in 2016, shipments of feature phones reached 396 million units, with a year-on-year growth rate of -5.71%, far less than the double-digit decline in previous years. The reasons behind this are influenced by income structure and population structure factors, and there are still many regions where feature phones dominate. According to PEW research, the smartphone penetration rates in Southeast Asia, India, Africa, and Japan (due to the impact of an aging population) are only 20%, 17%, 10%, and 39% (the global average is 43%).
Therefore, for feature phones, we expect there to still be a bottoming market of around 300 million units, corresponding to a 25% decline space, and we expect the decline in feature phones to remain below 10% in the coming years.
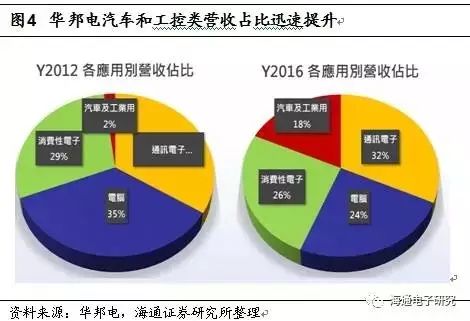
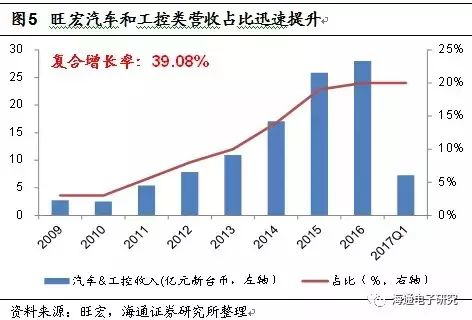
While the traditional feature phone market’s decline has significantly slowed, new applications in industrial control and automotive sectors are rising strongly. The proportion of Winbond in automotive and industrial control has rapidly increased from 2% in 2012 to 18% in 2016. Meanwhile, Macronix’s automotive and industrial control share has also risen from less than 3% in 2009 to 20% in 2016, with a compound growth rate of 39.08%.
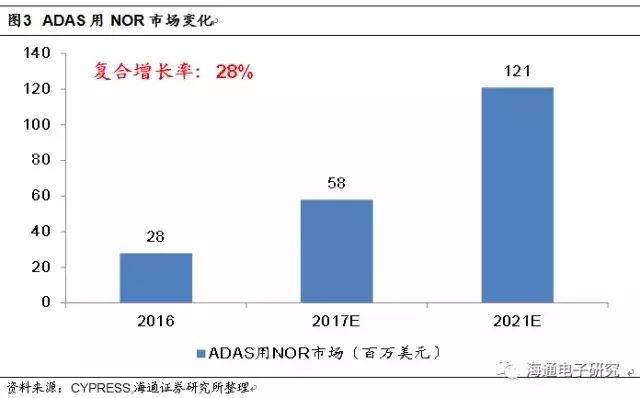
According to CYPRESS, the NOR market specialized for ADAS systems is expected to grow from $28 million in 2016 to $121 million in 2021, corresponding to a compound growth rate of 28%.
2. Raising Expectations for Demand Driven by TDDI + AMOLED
The demand for NOR Flash driven by AMOLED and TDDI may be more optimistic than we initially expected.
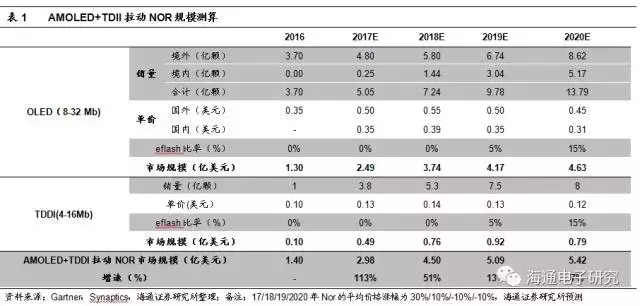
(a) AMOLED: Due to uniformity of brightness and residual images being the two major challenges of AMOLED (Mura), it is necessary to use external driving circuits to sense the electrical or optical characteristics of the pixels and then compensate (De-mura). However, since the cost of integrating De-mura coding into the driving IC is too high, an external NOR Flash of 8Mb (Full HD) or 32Mb (QHD) is required. Currently, the main suppliers of NOR for Samsung are Taiwanese manufacturers Macronix and Winbond, and Macronix is the exclusive supplier for Apple, with a unit price of about $0.2-0.5. We estimate the new market space for 2017/2018 to be $190 million/$240 million.
(b) TDDI: TDDI integrates touch and display driver chips. According to Synaptics, global TDDI sales in 2017/2018 are projected to be 380 million/530 million units, corresponding to a market value of $38 million/$53 million.
(c) eFlash penetration rate: In our original assumptions, considering that eFlash (embedded NOR) is a trend, we initially assumed a ratio of eFlash of 20%/50%/70% for 2018/2019/2020. However, due to factors such as area and cost, and the incompatibility of high and low voltage processes (eflash operates at 12V while the driving IC operates at 28V), we further lowered the eFlash ratio for 2018/2019/2020 to 0%/5%/15%. At the same time, we assume that the average price increase of NOR for 2017/2018/2019/2020 will be 30%/10%/-10%/-10%, corresponding to new market scales of $298 million/$450 million/$509 million/$542 million for 2017/2018/2019/2020 (as a significant increase in NOR for OLED in 2017 comes from Apple’s new smartphone, the component value of Apple devices is expected to be higher than that of Android devices; thus, we assume a price increase of 43% for NOR used in OLED compared to 2016).
3. Market Expected to Maintain Double-Digit Growth in the Future
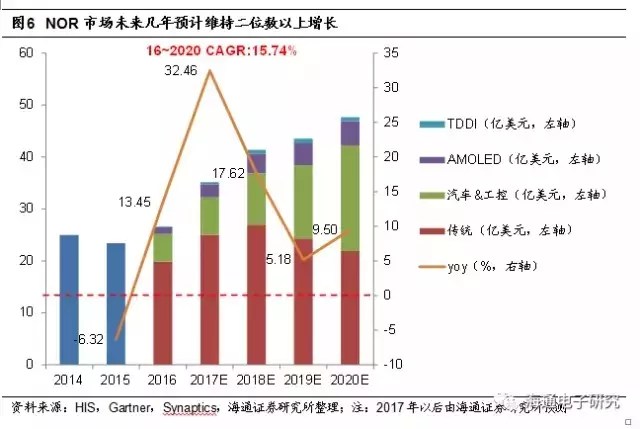
Under the background of slowing decline in traditional applications and strong driving from new applications such as automotive, industrial control, AMOLED, and TDDI, we expect the compound annual growth rate of the NOR Flash market to be 15.74% from 2017 to 2020, with the market size expected to reach $4.768 billion by 2020.
Moderate Expectations for Slight and Steady Capacity Increase in the Coming Years
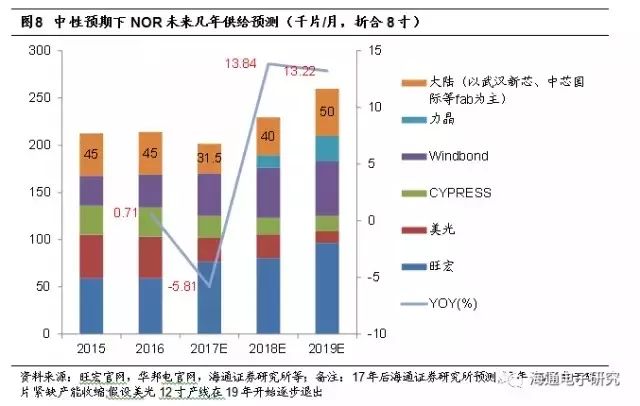
From the supply side, the overall contraction is evident, with Micron gradually exiting the market, CYPRESS exiting the low and medium capacity segments, while Taiwanese and mainland manufacturers are expanding production. Under moderate expectations, we estimate global NOR capacity for 2017/2018/2019 to be 201,600/229,500/259,800 wafers/month, with year-on-year changes of -5.81%/13.84%/13.22%.
Micron has halted production on its 8-inch line for NOR, corresponding to a monthly capacity of 20,000 wafers, and we expect that its other 12-inch line with a monthly capacity of 12,000 wafers, producing automotive and industrial control products, may also exit in the coming years.
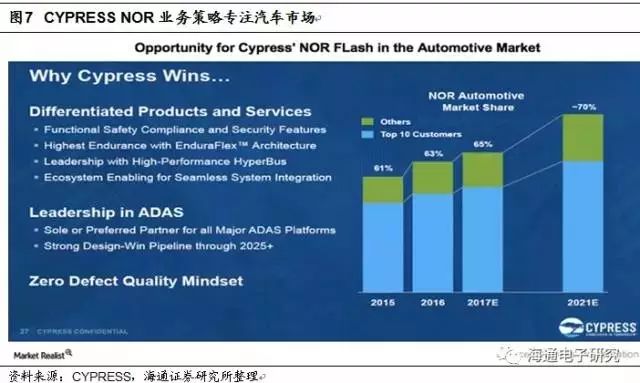
On the other hand, CYPRESS has recently announced its continued exit from low and medium capacity NOR, focusing instead on automotive and industrial control sectors.
At the 2017 CYPRESS analyst meeting, CEO Hassane El-Khoury stated that the company’s goal for NOR is to maintain a gross margin of 50%, while traditional applications typically have a gross margin of around 25% (Zhaoyi Innovation’s storage segment had a gross margin of 25% in 2016; Macronix had a gross margin of 24% in 2016). Therefore, the company will focus on high-end markets such as automotive and industrial control.
CYPRESS has previously exited part of the traditional market, corresponding to a market scale of $80 million, and it is expected that in the next 2-4 years, its capacity will be reduced to below 50%.
According to Trend Force, in 2016, CYPRESS had a market share of 25% and Micron had a market share of 18%. Considering the information from both CYPRESS and Micron, without accounting for Micron’s exit from the 12-inch line, it is expected that there will be a supply gap of 12% to 20% in the next 3-4 years, with the main capacity contraction expected in the first two years (although Micron is selling equipment, it is expected that if new entrants take over the equipment, it will take over 4 years to reach large-scale production; if it is traditional market players, it will also take more than a year and a half).
On the other hand, Taiwan and mainland manufacturers are expected to continue expanding production to seize market share. According to Winbond, Macronix, and Lichee, large Taiwanese manufacturers have clear expansion plans for the coming years, with Lichee even gradually shifting LCD driver IC production to its Hefei plant, using the excess capacity to produce NOR, with a maximum capacity of 24,000 wafers/month (12-inch).
Regarding mainland NOR expansion, we maintain a cautiously observant attitude. Unlike competitors, mainland NOR production is mainly handled by foundries, and NOR typically has the lowest profit margins, so foundries generally do not actively increase NOR capacity. On the other hand, the upstream silicon wafers for major mainland NOR manufacturers, such as Wuhan Xinxin, are restricted by Japanese manufacturers, which is expected to impact the overall supply of mainland NOR in the next one or two years.
Therefore, based on the above information, assuming no new entrants, under moderate expectations, we estimate global NOR capacity for 2017/2018/2019 to be 201,600/229,500/259,800 wafers/month, with year-on-year changes of -5.81%/13.84%/13.22%.
Supply Shortage May Become the Norm, Gap Expected to Persist Until 2019
1. In 2017, the gap is expected to be 13.40%, with a widening trend
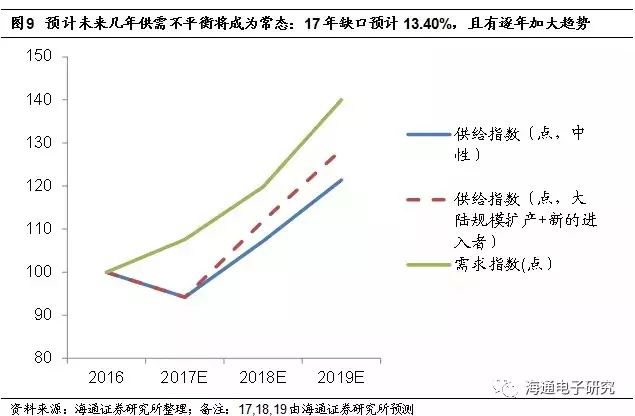
Taking 2016 as the year of supply-demand balance, set as the base of 100, considering both supply and demand factors, it is expected that a supply shortage of NOR Flash may become a norm in the coming years, with a gap of 13.40% expected in 2017, and a trend of widening.
2. Mainland Storage Ambitions Are Ambitious, But Uncertainties Cannot Be Ignored
Unlike overseas, the mainland NOR Flash industry is currently mainly Fabless, with production controlled by foundries such as Wuhan Xinxin and SMIC, and the government has already taken a strong dominant position. A potential issue is whether national platforms (紫光系) or local platforms (Fujian, Hefei) will enter this market in the future. If they do, what will the impact on the market be?
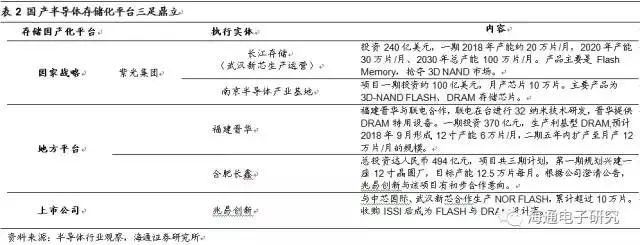
Our view is that we expect national or local platforms will not enter this market. Even if they do, it may not change the basic situation of supply and demand imbalance before 2020.
First, the main goal of government platforms is to achieve domestic substitution in mainstream markets such as DRAM/NAND, rather than entering the NOR market where mainland companies already have an advantage; secondly, compared to the hundreds of billions of dollars in DRAM/NAND, the NOR market is too small to accommodate local and national teams investing over $10 billion. Therefore, we expect that national or local platforms will not enter this market.
If they do enter, it is expected that by 2019, a capacity of 100,000 wafers/month will be needed to achieve supply-demand balance, while the capacity in 2016 was 450,000 wafers, and due to tight silicon wafer supply, capacity is expected to contract in 2017.
Therefore, we believe that even considering new entrants or mainland expansions, the capacity gap is expected to persist until 2019 (corresponding to the dashed line forecast in Figure 9, achieving balance in 2019 requires total mainland capacity to reach 90,000 wafers/month, which corresponds to a compound growth rate of 69% in capacity from 2017 to 2019).