Quantifying the relationships between soil fraction mass, fraction carbon, and total soil carbon to assess mechanisms of physical protection.
Abstract:
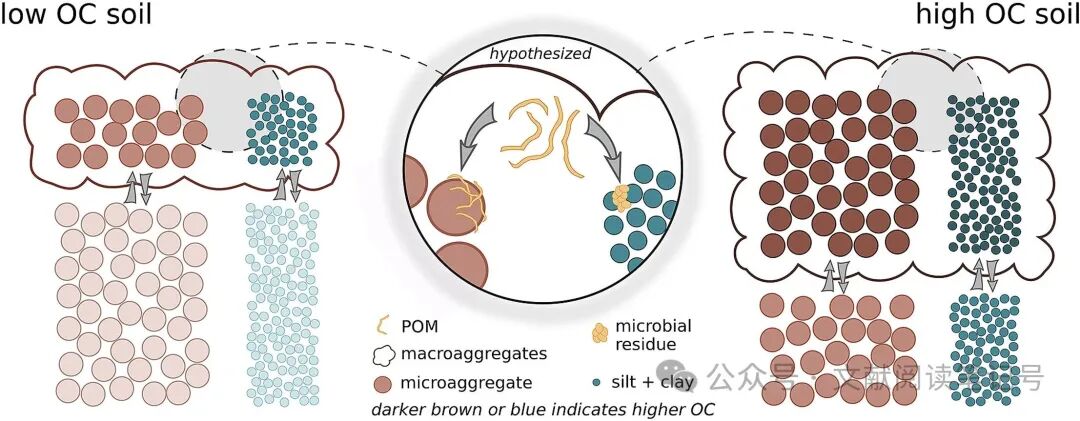
Main point: relationships between soil fractions (their mass or C) and soil organic carbon (SOC).
Method:linear hierarchical models to quantify relationships between mass, C concentration and total C of fractions (macroaggregates, free microaggregate, occluded microaggregate, free silt & clay, and occluded silt & clay) and SOC.
Key finding:
1) total microaggregate mass (free + occluded) did not increase with macroaggregate mass;
2) high SOC soils exhibited a greater percent of total microaggregates occluded in macroaggregates;
3) occlusion in macroaggregates was also associated with increased C concentrations of microaggregates;
4) rates of SOC increase with silt + clay C concentrations failed to increase with mean site-level SOC concentration.
Conclusion:
1) reduced macroaggregate turnover promotes SOC accumulation via the stabilization of C into occluded fractions;
2) SOC accumulation appears unlikely to be limited by C storage capacity in the silt + clay fraction.
Introduction:
The physical protection (such as within soil aggregates) on SOC formation and persistence.
⬇
The importance to understand or identify the contribution of measurable soil fractions on SOC formation and persistence.
⬇
General previous investigation:
1) smaller soil fractions persist longer and therefore offer more stable protection to associated organic C;
2) soils with a greater mass in larger fractions (usually > 250μm) are associated with greater SOC levels, with a larger mean weight diameter;
⬇
Gap:
quantify the relationship between SOC and all soil fractions across many sites.
widely applied soil fractionation of Six et al. (2000) with Elliott (1986):
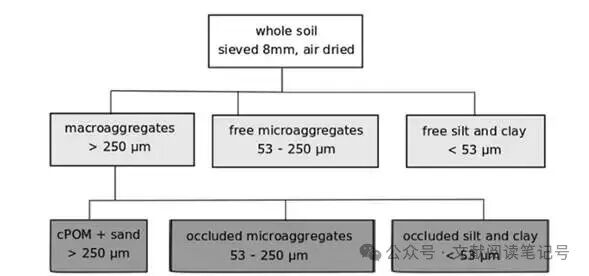
Certain key findings on this method on soil fractionation from previous work:
1) reduced rates of macroaggregate turnover under no-till enabled occluded micro aggregate formation and acted as a mechanism for SOC accumulation.
2) silt + clay and cPOM fractions have potential to inform because their C dynamics are central to C saturation theory.
⬇
Uncertainty:
1) rates of aggregate mass redistribution, however this possibility has received little theoretical attention to our knowledge;
2) if preferential increases in total fraction C occur due to a redistribution of soil mass into that fraction, due to higher rates of increase in the C concentration of that fraction, or some combination of these two processes.
⬇
Requirement on careful selection of statistical techniques:
1) meta-analysis: comparison of treatment and control observations (standardized effect sizes).
Limitation: do not quantify variables in absolute units rather than absolute change.
2) Linear hierarchical models
Advantages:
—generate quantitative reviews (i.e., multiple treatments within sites) because they can synthesize all within-site slopes into global slopes, which are then not confounded by drivers of between-site variation.
—answer specific questions in soil ecology, such as whether C saturation occurs between (but not within) sites, by extracting lower-level slopes and testing whether they change with mean site-level SOC concentration.
⬇
Objectives: to examine the method of soil fractionation by Six et al. (2000) to understand SOC formation and persistence.
1) Do occluded microaggregates accumulate C preferentially as SOC increases?
2) Is preferential C accumulation in any soil fraction caused by changes in that fraction’s C concentration, mass, or both?
3) Do fraction and SOC relationships support de novo formation of microaggregates within macroaggregates?
4) Are rates of change in soil fraction characteristics with SOC concentration moderated by mean site-level SOC concentration?
5) Does occlusion in macroaggregates influence C concentrations of microaggregates and silt + clay particles? with consideration of environmental variables.
Method:
2.1 Database search
Sources: papers citing Six et al. (2000) method on soil fractionation.
Noted: elevation (m), mean annual temperature (MAT, °C) and mean annual precipitation (MAP, mm), and percent sand, silt, and clay.
2.2 Calculations
C amounts as g kg-1 soil.
C concentrations for non-sand-corrected aggregate concentrations were used.
2.3 Statistics
1) Linear mixed effect hierarchical models (R package lme4):
SOC concentration as the response variable for other models (fraction mass, fraction C concentration, mean weight diameter).
2) random effect for all models:
unique site and depth identifiers assigned after grouping soil observations from within the same site and depth.
3) linear regression:
—between slopes (dependent variable) and mean site-level SOC concentrations (independent variable).
—effect of environmental variables (MAT, MAP, elevation, clay and pH) on SOC and macroaggregate mass.
2.4 Caveats and limitations of the dataset
1) inconsistent procedures on sand correction and correction for light fraction;
2) the influence from depth of sampling on mean site-level SOC.
Results:
3.1 Database synthesized from literature
—From 38 sites located on five continents.
—Soil orders: Alfisols, Entisols, Inceptisols, Mollisols, Oxisols, and Ultisols.
—Systems: agriculture, grassland, forest, or a mixture of these.
—Treatments: tillage, species identity or diversity (usually through crop rotation), inorganic nitrogen (N) fertilizer, quality of organic amendment, quantity of organic amendment, harvest practices, earthworm abundance or species, free air carbon enrichment, and restoration (from agriculture to grassland).
3.2 Do occluded microaggregates accumulate C preferentially as SOC increases?
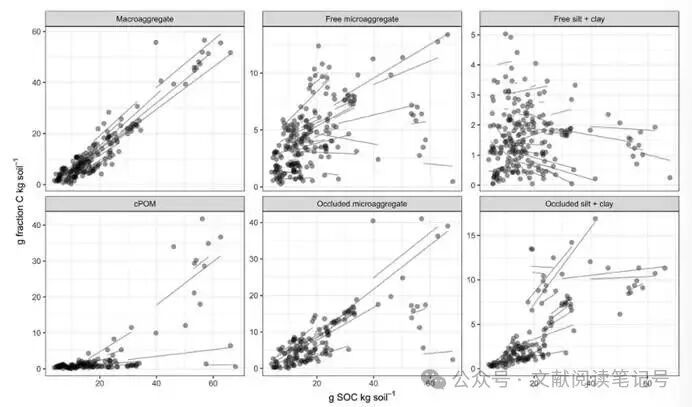
—macroaggregates accumulated total C at both the highest rate and with the greatest consistency (83%, CI=74, 91%).
— within the set of non-overlapping fractions, occluded microaggregates accumulated total C at the highest rate (43%, CI =33–52%).
— among all three macroaggregate-occluded fractions, occluded microaggregates preferentially accumulated C as SOC increased, gaining more C than both other fractions combined.
— free microaggregates were responsible for little C gain and the free silt + clay fraction often lost C as SOC concentration increased.
3.3 What soil fraction dynamics explain preferential C accumulation?
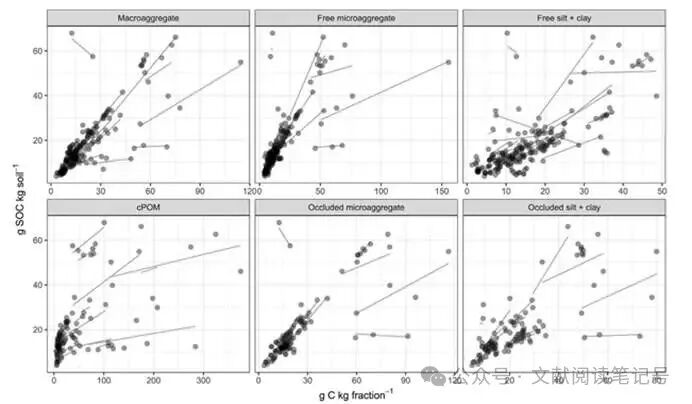
— Among all soil fractions, increases in C concentrations were associated with similar increases in SOC concentrations, with the exception of cPOM.
—changes in fraction mass (i.e. redistribution) explained the preferential increase in total fraction C with SOC concentration for a given soil fraction.
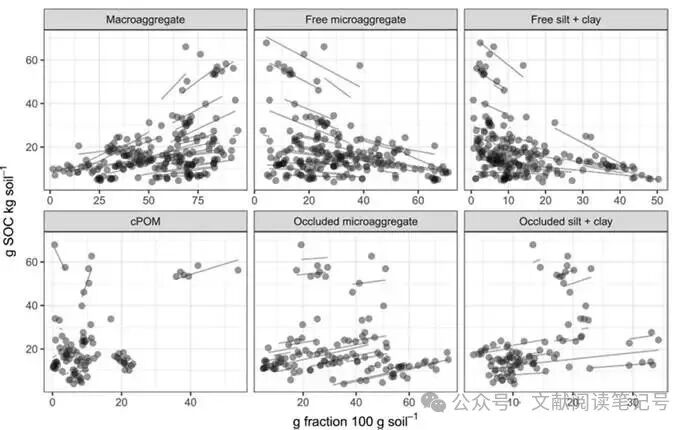
— SOC consistently increased with the redistribution of soil mass into macro aggregates, away from free microaggregates or free silt and clay.
3.4 Do fraction and SOC relationships support de novo formation of microaggregates within macroaggregates?
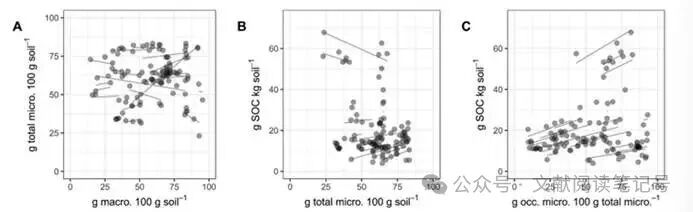
— total microaggregate mass did not increase with macroaggregate mass.
— total microaggregate mass was associated with relatively small changes in SOC concentration.
— significant increases in SOC concentration were caused by increases in the percent of total microaggregates occluded in macroaggregates.
3.5. Are rates of change in soil fraction characteristics with SOC concentration moderated by mean site-level SOC?
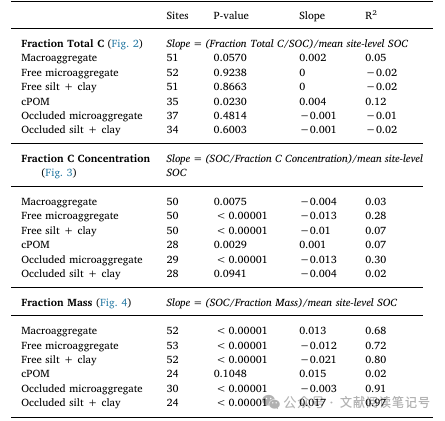
—the relationship between SOC concentration and total fraction C shows little relationship to mean site-level SOC concentration.
— the relationship between SOC concentration and fraction C concentration shows little relationship to mean site-level SOC concentration.
—mean site-level SOC concentration did moderate fraction mass.
3.6. Does occlusion in macroaggregates influence fraction C concentration?
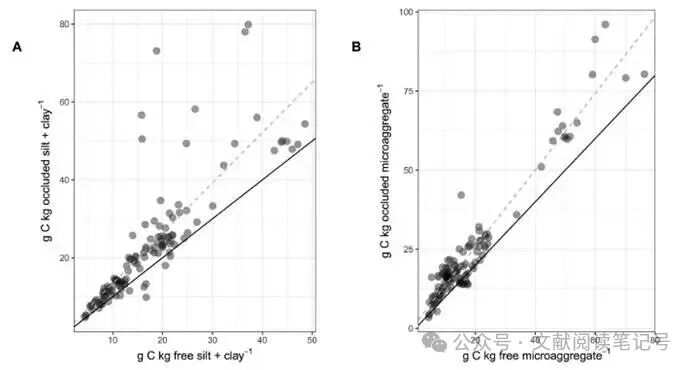
(Solid black lines represent 1:1 lines. Dashed gray lines represent linear regression through all points).
—occluded microaggregates and occluded silt+clay showed higher C concentrations than their free counterparts.
3.7 Environmental properties as predictors of SOC concentration and macroaggregate mass
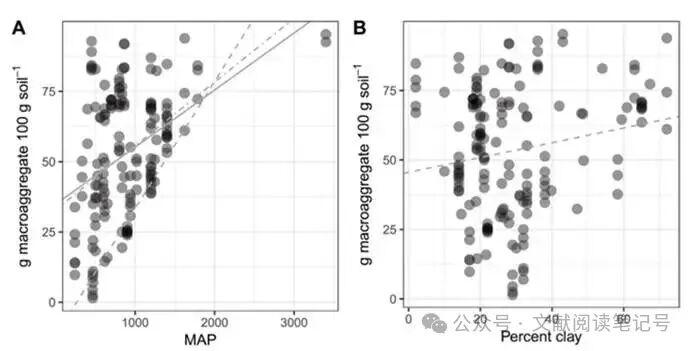
— several environmental properties (MAT, MAP, clay, elevation and pH) were statistically significant, but none explained more than 33% of the variability in SOC concentration between sites.
— MAP was a strong predictor of macroaggregate mass.
—Macroaggregation differed among USDA soil orders: Oxisols exhibited greater macroaggregation than Alfisols, Ultisols, and Mollisols.
Discussion:Not specified (not reviewed in detail).
Conclusion:
—a redistribution of soil mass toward macroaggregates is associated with an increase in SOC concentration.
—mechanisms linking increased macroaggregate mass (and reduced macroaggregate turnover) appear attributable in part to the role of macroaggregates in increasing C stabilization and/or protection in occluded microaggregates and silt + clay.
Key finding: consistent proportions of SOC accumulation occurred in C macroaggregates and occluded microaggregates.
The redistribution of soil quality toward macroaggregates is key to the increase of SOC, with the mechanism being that macroaggregates provide physical protection for the internal microaggregates and silt + clay, thus stabilizing carbon.One important finding is that even at high SOC concentrations, the silt + clay components did not show a strict carbon saturation limit. Ultimately, SOC accumulates in consistent proportions in macroaggregates and occluded microaggregates.(Reading notes)