MATLAB-Excel Read and Write
1.1 Reading Excel Data (<span>.xlsx</span>, <span>.xls</span>)
1. <span>readtable</span> (Read as Table)
% Read the entire worksheet
data = readtable('filename.xlsx');
% Specify worksheet to read
data = readtable('filename.xlsx', 'Sheet', 'Sheet1');
% Read specified cell range
data = readtable('filename.xlsx', 'Range', 'A1:C10');- • Output:
<span>data</span>is a<span>table</span>type variable, which can be directly manipulated by column name:columnData = data.ColumnName; % Extract column named "ColumnName"
1.2 Example Operations
Reading and Processing Data
% Read data from the "Sales" worksheet in the A1:D100 range
salesData = readtable('report.xlsx', 'Sheet', 'Sales', 'Range', 'A1:D100');

% (Optional) Use detectImportOptions to set import options
% opts = detectImportOptions('report.xlsx'); % Automatically detect import options
% opts.Sheet = 'Sales';                     % Specify worksheet name
% opts.DataRange = 'A1:D100';               % Specify read range
% filteredData = readtable('report.xlsx', opts);

% Calculate the average of the "Revenue" column
avgRevenue = mean(salesData.Revenue);

% Write the calculated result to a new worksheet "Summary"
result = table(avgRevenue, 'VariableNames', {'AverageRevenue'});
writetable(result, 'report.xlsx', 'Sheet', 'Summary');Illustration:<span><Example Data Chart></span>:
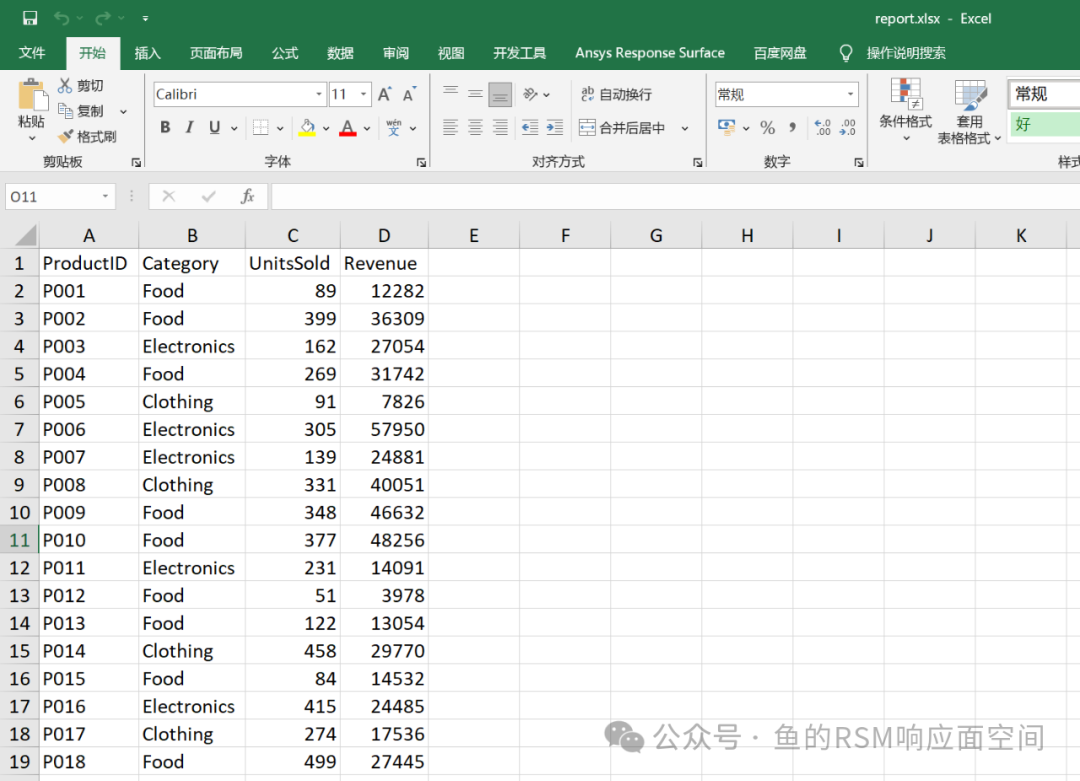
Original Excel data table example.
<span><Read into MATLAB></span>:
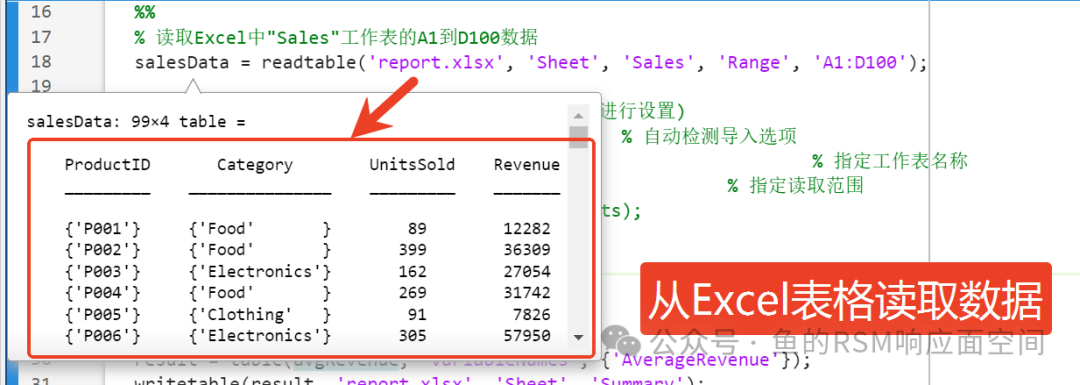
Using <span>readtable</span> to read the specified worksheet (<span>'Sales'</span>) and range (<span>A1:D100</span>) results in a MATLAB<span>table</span> variable.
<span><Read into MATLAB (default)></span>:
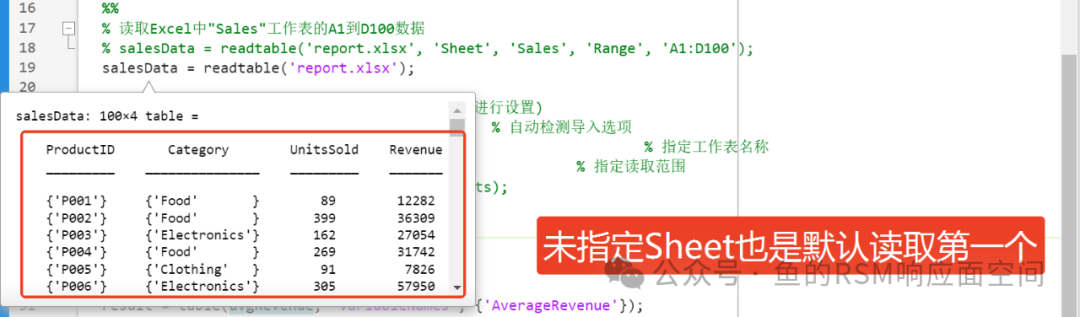
When the <span>Sheet</span> parameter is not specified, it defaults to reading the first worksheet.
<span><Run Result Chart></span>:
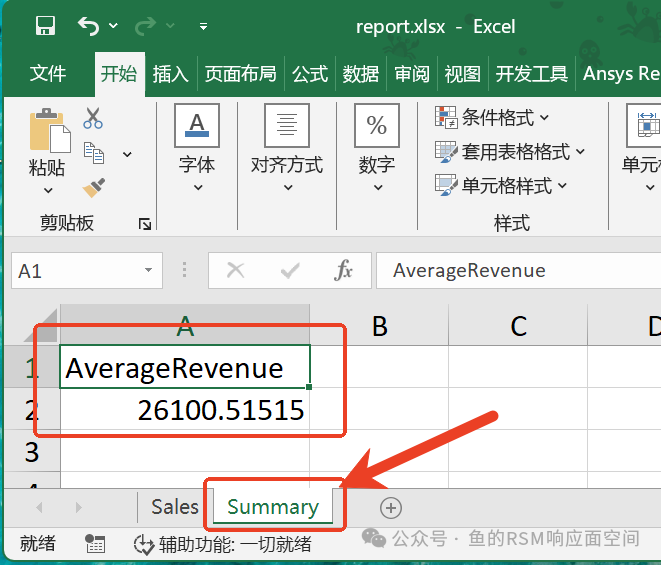
Finally, the average value of the <span>Revenue</span> column is written to the new worksheet<span>'Summary'</span> as shown in the run result.
Special Format Reading
<span>readtable</span> function is powerful and supports various data format processing. The following is a simple demonstration; for specific applications, please refer to the help documentation or AI assistance.
% Handle special data types during reading
processedData = readtable('sales_data.xlsx', ...
    'Sheet', 'Quarterly', ...               % Specify worksheet
    'ReadRowNames', true, ...               % Use the first column as row names
    'VariableNamingRule', 'preserve', ...   % Preserve original column names (including spaces and special characters)
    'TextType', 'string' ...                % Read text as string type (instead of character vector array)
);

% Display read results
disp(head(processedData));       % Display the first 8 rows of the table
summary(processedData);          % Display data summary statistics
rowData = processedData('2024-12-31', :); % Access specific row data by row nameIllustration:<span><Example Data Chart II></span>:
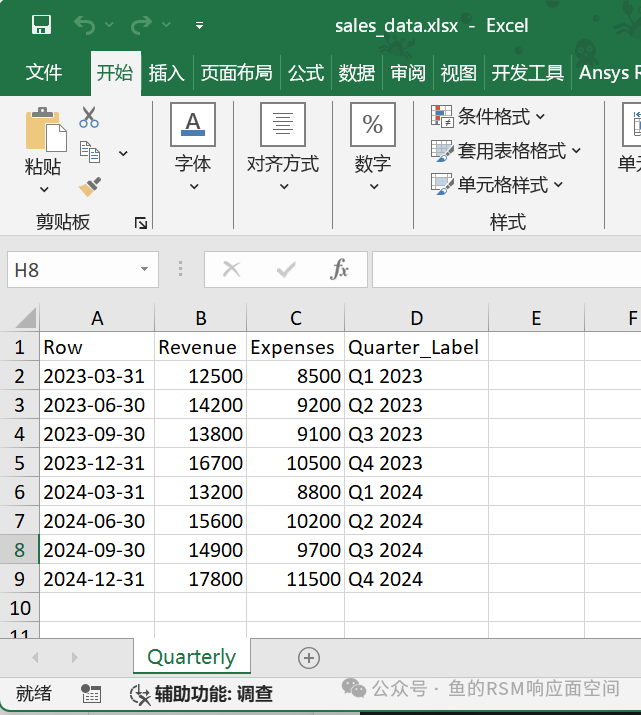
Original Excel data table example with row names and special formats.
<span><Run Result Chart II></span>:
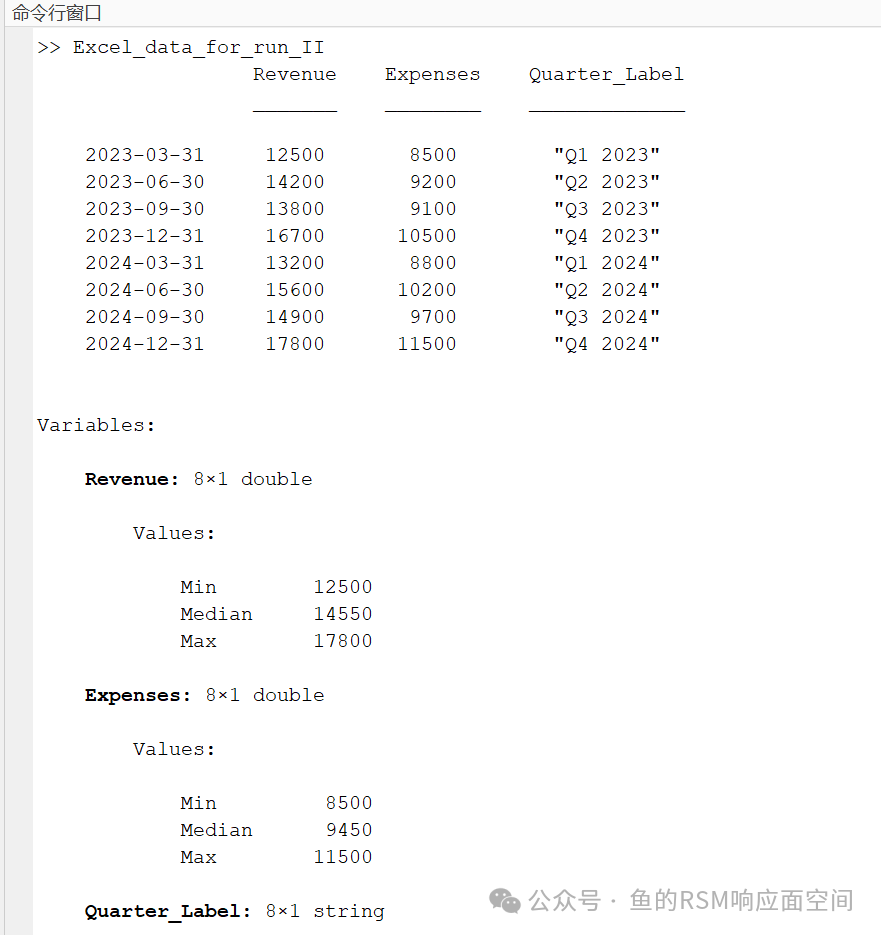
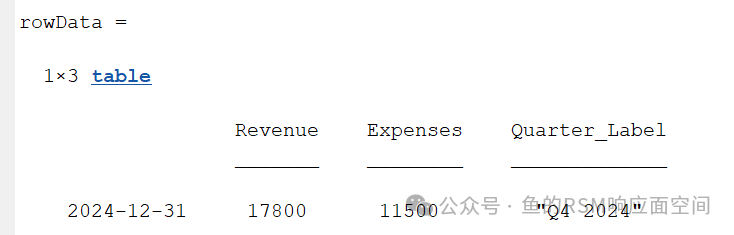
<span>disp</span> and <span>summary</span> output effect charts, as well as an example of accessing data by row name.
1.3 Parameter Description
<span>readtable</span> Common Options
| Parameter | Description | Default Value | Example Value |
<span>'Sheet'</span> |
Specify worksheet name or index | 1 (first worksheet) | ‘Sheet1’ or 2 |
<span>'Range'</span> |
Cell range | Automatically detect data range | ‘A1:F100’ |
<span>'TextType'</span> |
Text data type: ‘string’ or ‘char’ | ‘char’ | ‘string’ |
<span>'VariableNamingRule'</span> |
Variable name rule: ‘preserve’ (preserve special characters) or ‘modify’ (automatically correct) | ‘modify’ | ‘preserve’ |
<span>'MissingRule'</span> |
Missing value handling: ‘fill’ (fill default value)/’omitrow’ (delete row)/’omitvar’ (delete column) | ‘fill’ | ‘omitrow’ |
<span>'ReadVariableNames'</span> |
Whether to read the first row as column names | true | false |
<span>'ReadRowNames'</span> |
Whether to use the first column as row names | false | true |
<span>'VariableNames'</span> |
Custom column names | Automatically generated | {‘ID’,’Date’,’Value’} |
<span>'SelectedVariableNames'</span> |
Select specific columns to read | All columns | {‘Name’,’Age’} |
<span>'TreatAsMissing'</span> |
Text to treat as missing values | None | {‘N/A’,’–‘} |
<span>'DateLocale'</span> |
Date format locale | System locale | ‘en_US’ |
<span>'Encoding'</span> |
File encoding format | ‘UTF-8’ | ‘ISO-8859-1’ |
2.1 Writing Excel Data
1. <span>writetable</span> (Write Table to Excel)
% Write to default worksheet (Sheet1)
writetable(data, 'output.xlsx');
% Write to the 2nd worksheet
writetable(data, 'output.xlsx', 'Sheet', 2);
% Start writing from cell B2
writetable(data, 'output.xlsx', 'Range', 'B2');
2.2 Example Operations
Using the example table <span>report.xlsx</span> as an example
% Create example data table
product = ["A"; "B"; "C"; "D"];
salesQ1 = [120; 95; 150; 80];
salesQ2 = [135; 110; 160; 75];
profit = [0.25; 0.18; 0.30; 0.15];

salesTable = table(product, salesQ1, salesQ2, profit, ...
    'VariableNames', {'Product', 'Q1_Sales', 'Q2_Sales', 'Profit_Margin'});

% Basic write operation
writetable(salesTable, 'report.xlsx');Illustration:<span><Write Run Result Chart></span>:
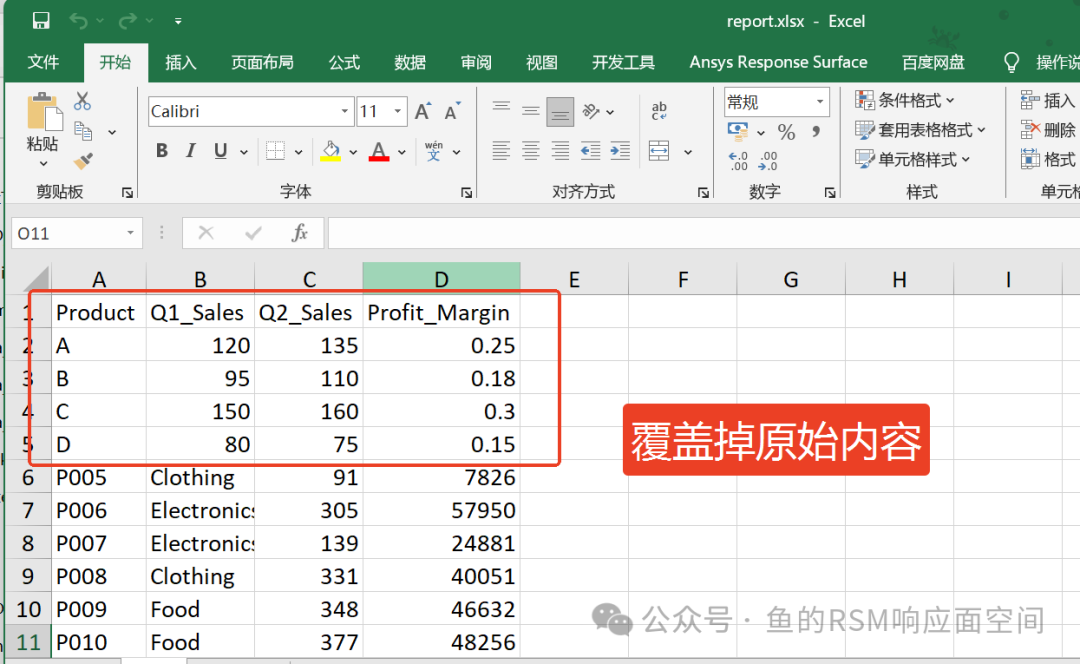
Effect chart of the Excel file after basic write operation.
Advanced Write Options
% Write data using advanced options
writetable(salesTable, 'report.xlsx', ...
    'Sheet', 'Quarterly_Report', ...    % Specify worksheet name
    'Range', 'B3', ...                   % Start writing from B3
    'WriteRowNames', false, ...          % Do not write row names
    'WriteMode', 'overwritesheet', ...   % Overwrite entire worksheet content (keep other sheets)
    'AutoFitWidth', true ...             % Automatically adjust column width
);

% (Optional) Append data to existing worksheet (add below existing data)
% 1. Read existing data
existingData = readtable('report.xlsx', 'Sheet', 'Quarterly_Report');
% 2. Vertically concatenate tables (new data added below)
combinedData = [existingData; salesTable];
% 3. Write the combined data back to the original worksheet, starting from B3 to maintain format consistency
writetable(combinedData, 'report.xlsx', ...
    'Sheet', 'Quarterly_Report', ...
    'Range', 'B3');
Illustration:
<span><Write Run Result Chart></span>: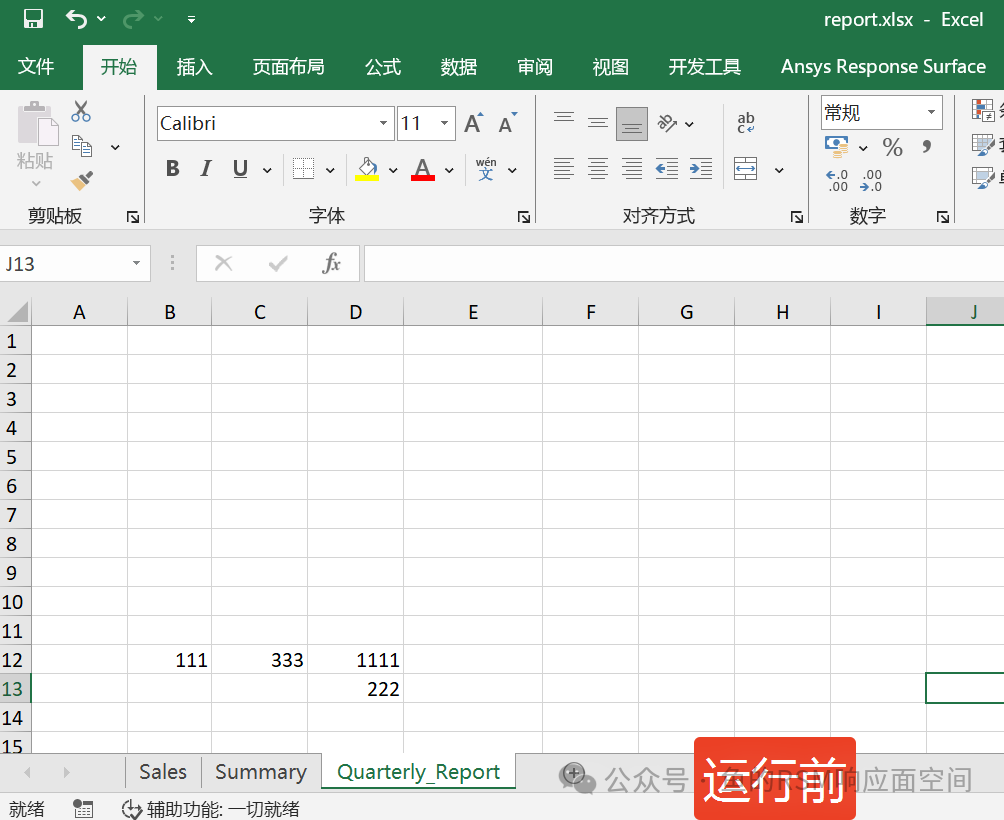
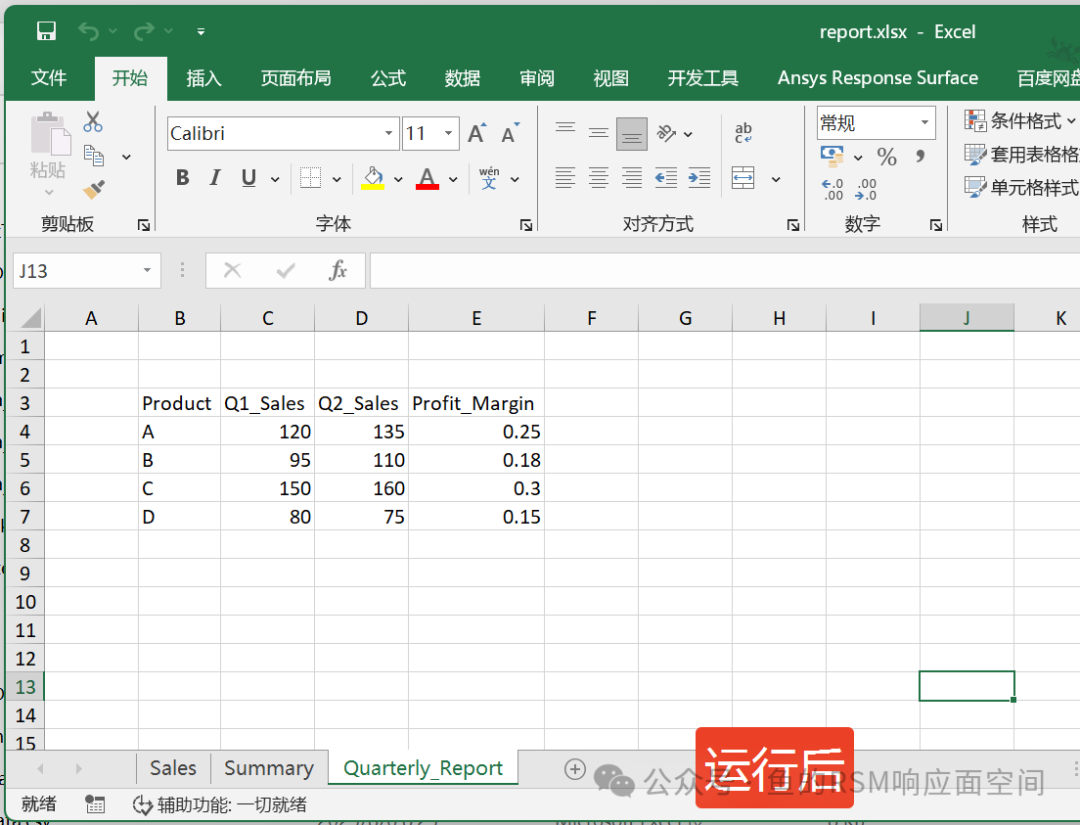
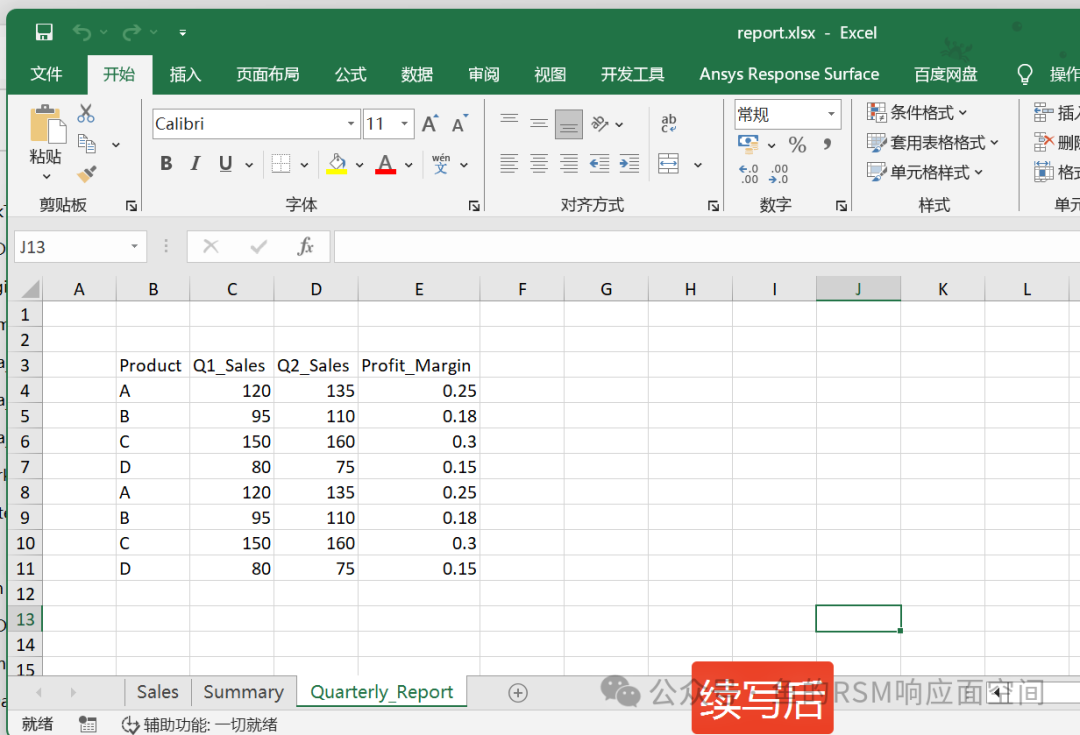 Effect chart of the Excel file after writing data with advanced options. After running: this write operation directly overwrites the entire original table. After appending: first read the original table content, complete the table concatenation in MATLAB, and then write it back to the specified position in the table.
2.3 Parameter Description
<span>writetable</span> Common Options
| Parameter | Description | Default Value | Example Value |
<span>'Sheet'</span> |
Specify worksheet name or index | 1 (first worksheet) | ‘Results’ or 3 |
<span>'Range'</span> |
Starting write position | ‘A1’ | ‘C5’ |
<span>'WriteVariableNames'</span> |
Whether to write column names | true | false |
<span>'WriteRowNames'</span> |
Whether to write row names | false | true |
<span>'AutoFitWidth'</span> |
Automatically adjust column width | false | true |
<span>'PreserveFormat'</span> |
Preserve existing format | false | true |
<span>'DateLocale'</span> |
Date format locale | System locale | ‘zh_CN’ |
Tips
- 1. File Status:Before executing the
<span>writetable</span>write operation, please ensure the target Excel file is closed.If the file is open in another program (such as Excel itself), MATLAB will not be able to write and may report an error. - 2. Function Capability:
<span>readtable</span>and<span>writetable</span>are powerful built-in functions in MATLAB that support not only Excel but also various other formats (such as CSV, text files). This document mainly focuses on Excel interaction scenarios. - 3. Flexible Application:The above examples cover the core processes of data reading, processing, and exporting.In practical applications, parameters and data processing logic can be adjusted according to specific needs.