Click on the above“Visual Learning for Beginners”, select to add Star or Pin.
Important content delivered immediately
The code for this article can be found at: https://github.com/TimChinenov/FarmPlotter
In agriculture, it is often desired to obtain the area of different plots of land. While obtaining these areas is relatively straightforward, it involves high costs. Moreover, measuring the area of irregularly shaped land becomes quite challenging.
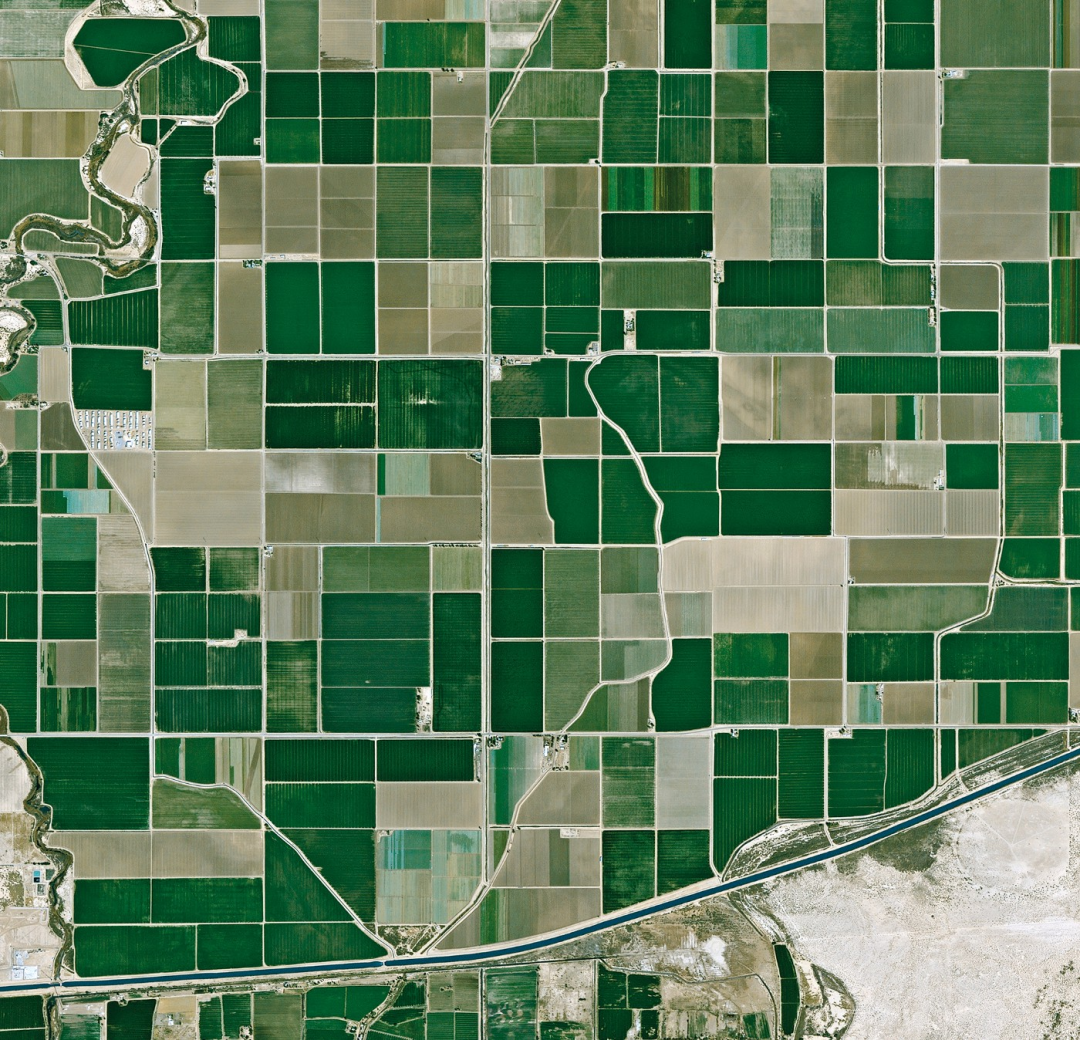
Fortunately, there is a wealth of publicly available farm land data in the form of satellite images. The image below shows the obtained land. Based on such images, image processing algorithms can be applied to calculate the area of each plot of land.
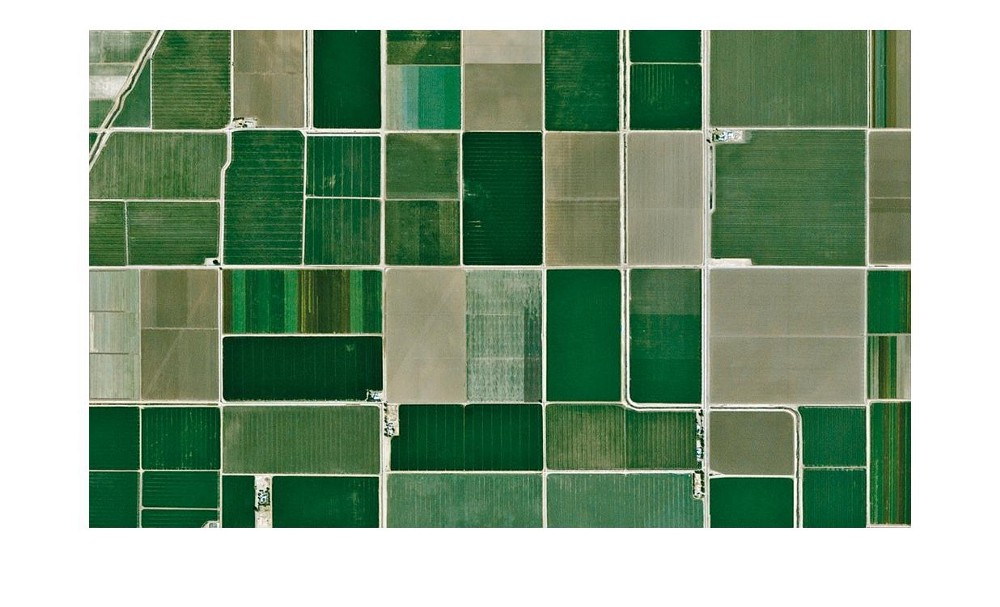
We can use a derivative filter, as it seems to align with how humans distinguish land or plots. When we observe an object, we use contrast and shadows to determine its shape and type. Similarly, derivative filters can be used to find contrasting areas. If the difference between a pixel value and its surrounding pixels exceeds a threshold, it is marked as 1; otherwise, it is marked as 0. This creates a binary image with the selected edges of the original image.
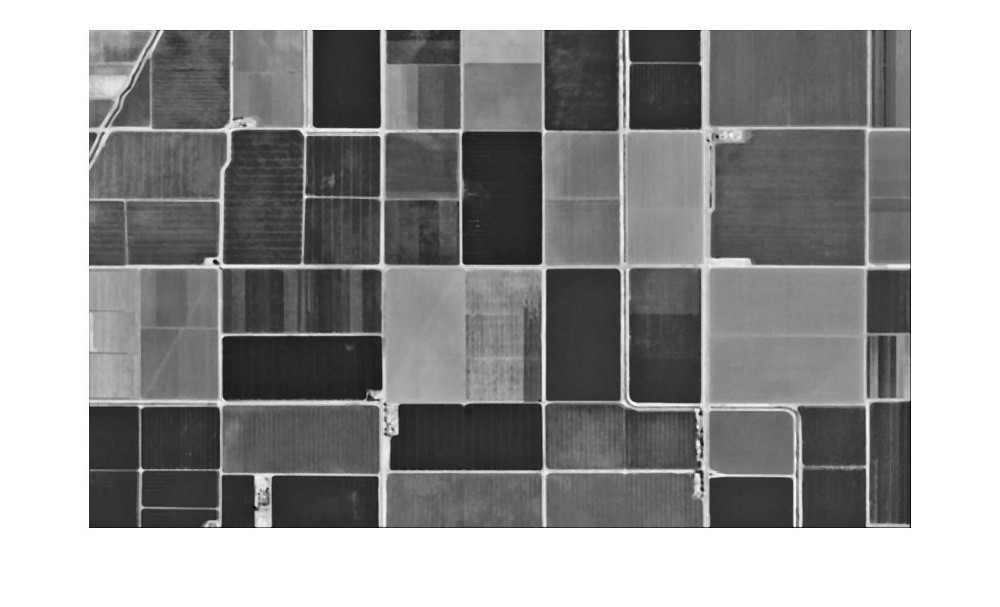
The original image contains a lot of noise and details, which may reduce the success rate of the algorithm. It is recommended to apply a blurring filter to remove noise before applying the derivative filter. Any blurring filter can be used for image denoising. Since our main goal is to eliminate noise and small details while preserving the colors for contrast, we used a 4×4 median filter. Afterward, the image is converted to grayscale to obtain a grayscale image for subsequent edge detection. The specific results are shown in the image below.
Next, three edge detection methods were tried to find the best results.
The first edge detection filter is the Sobel filter. This filter performs gradient detection on each pixel of the image. Built-in Matlab and OpenCV functions can perform operations in both horizontal and vertical directions, combining the results. The specific results are shown below.
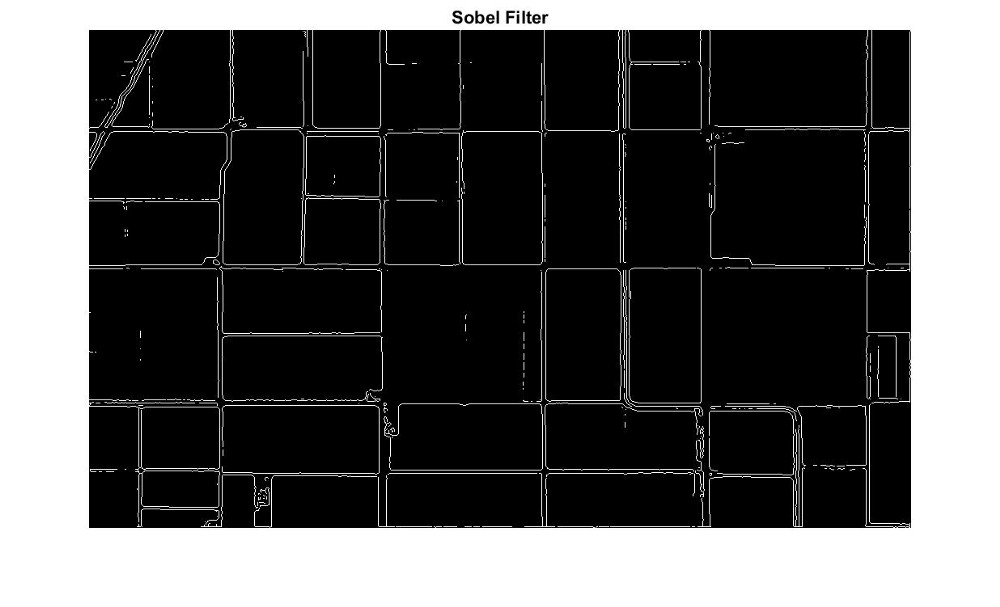
From the results, it can be seen that the generated image has almost no noise. However, unfortunately, when comparing the filtered image with the original image, it can be seen that many of the dividing lines between plots were not well captured, especially in areas where the color of the farmland is not significantly different from that of adjacent plots.
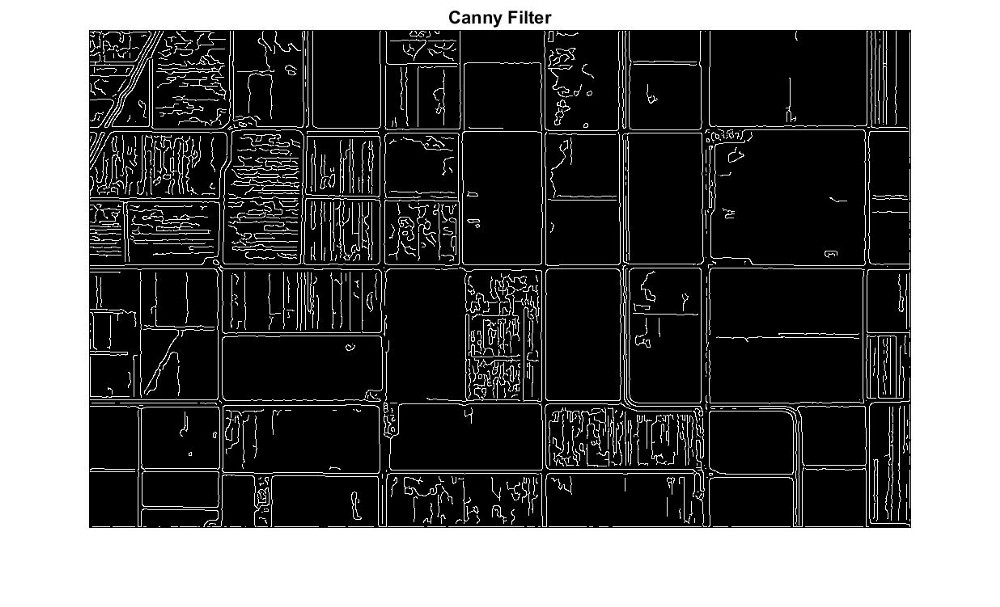
The second edge detection method is the Canny filter. The filtering results are given below, and from the Canny filtering results, it can be seen that the Canny filter detected more edges. However, this method also has its drawbacks, as it produces more noise. Considering that the Canny algorithm merges pixels through a magnitude threshold function with adjacent pixels through a slightly lower threshold function, this is expected. The Canny algorithm is more complex than the simple Sobel filter. It also relies on prior Gaussian smoothing. Using a median filter may hinder optimal results.
The third filter is the Laplacian operator with Gaussian filtering. The results extracted by this filter are shown in the image below.
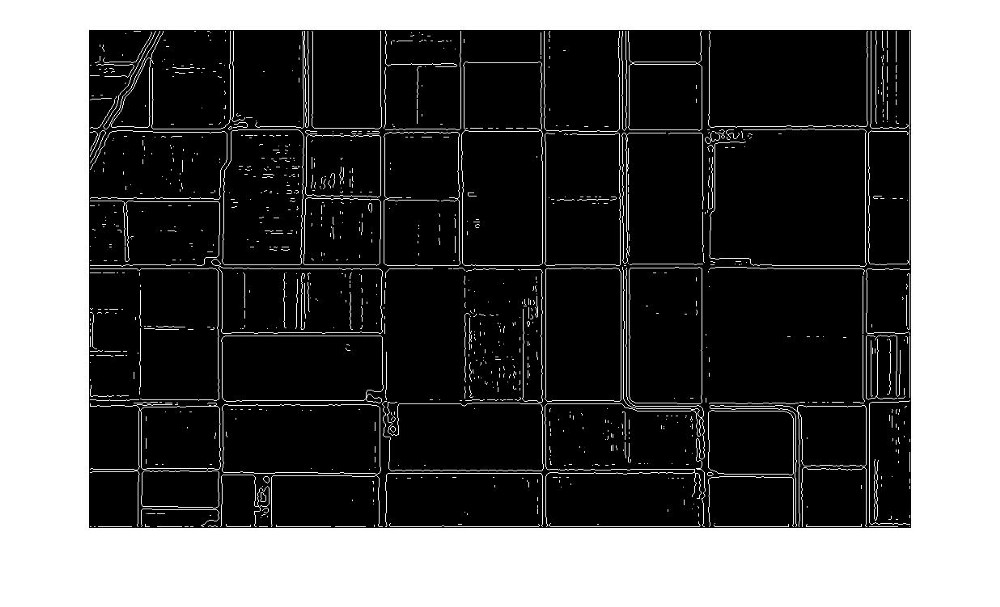
Through the results, we can see that regardless of which filter we use, most prominent roads are detected. However, whether small areas inside the farmland and houses near the roads produce noise depends on the type of filter selected. This characteristic of farmland images makes it very suitable for the Gaussian filter’s Laplacian operator. Looking at the test results, a relatively ideal result can be obtained. The number of detected roads is maximized, with minimal noise.
To further remove noise from the image, all white areas with a total pixel area smaller than the average pixel area value are removed. This threshold is an empirical value obtained through multiple trials. Others can also try different thresholds.
Next, the image is inverted to obtain the area of the fields. After that, a dilation operation with a size of 4 is performed on this result, as shown in the image below.
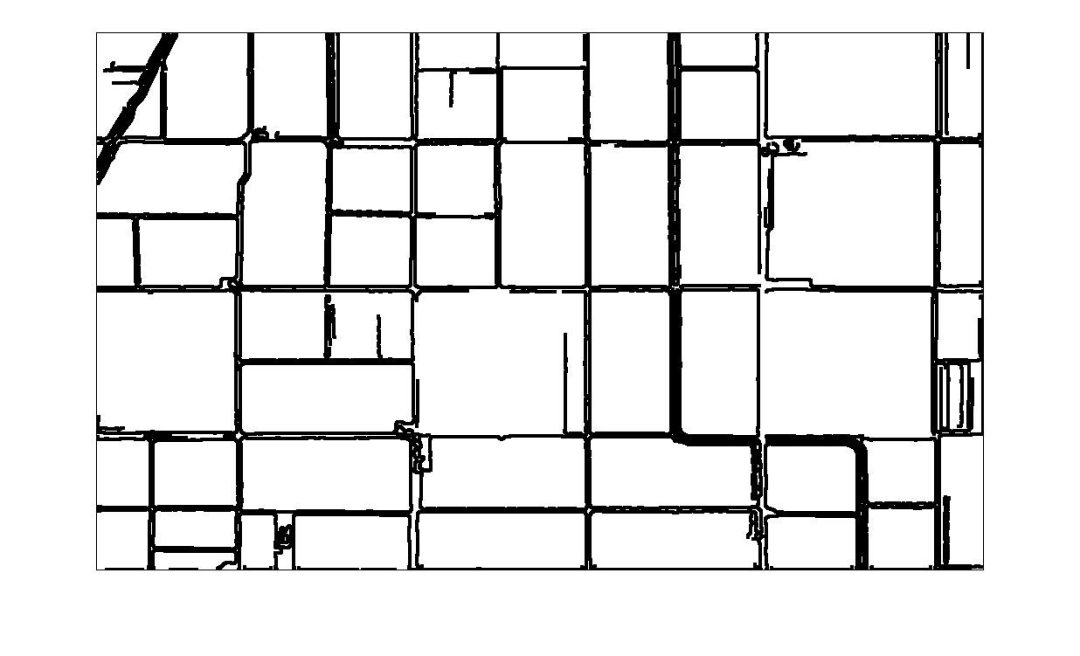
With this image, calculating the area of each plot of land becomes quite simple. The regionprop function in Matlab (or OpenCV) can be used to find the area of each region. There are still some plots that are not real farmland; some are roads or other details. To mitigate these areas, we only calculate regions with an area greater than the average minus one standard deviation.
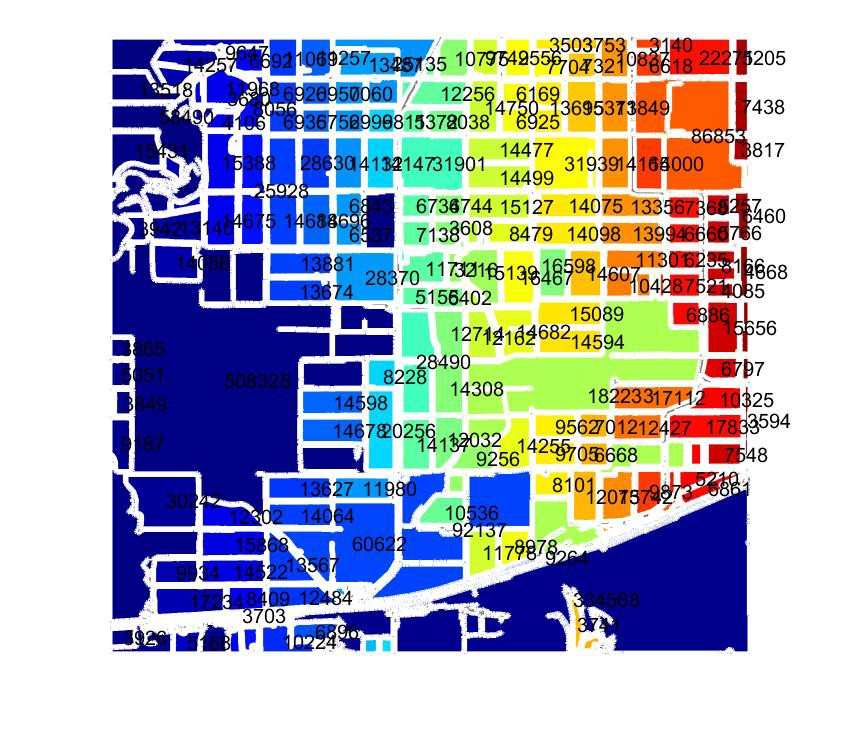
Then, color each region and print its pixel size at its location. The results can be seen in the image below. The printed size is the numerical value of the pixels in that region. Unless there is a known ratio between the pixel and image sizes, these values will be of no use. However, we know that satellite images (e.g., Google Maps) often come with a scale, which gives meaning to the pixel values.
The results are quite satisfactory. The application can separate most plots into their specific areas. However, there are some exceptions. For example, the large orange area with a pixel value of 47,680 merges two regions together. This can be resolved by adjusting the dilation value. Another consideration is that the dilation of roads does indeed erode the pixel area of the farmland. To obtain a more accurate value for the farmland, it may be necessary to add the result of this erosion to the total area of the farm. Interested parties can implement this themselves.
Next, another example result is shown.
Download 1: OpenCV-Contrib Extension Module Chinese Tutorial

Reply "Extension Module Chinese Tutorial" in the backend of the "Visual Learning for Beginners" public account to download the first Chinese version of the OpenCV extension module tutorial available online, covering installation of extension modules, SFM algorithms, stereo vision, target tracking, biological vision, super-resolution processing, and more than twenty chapters of content.

Download 2: 52 Lectures on Python Vision Practical Projects

Reply "Python Vision Practical Projects" in the backend of the "Visual Learning for Beginners" public account to download 31 visual practical projects including image segmentation, mask detection, lane detection, vehicle counting, eyeliner addition, license plate recognition, character recognition, emotion detection, text content extraction, and face recognition, to aid in quickly learning computer vision.

Download 3: 20 Lectures on OpenCV Practical Projects

Reply "20 Lectures on OpenCV Practical Projects" in the backend of the "Visual Learning for Beginners" public account to download 20 practical projects based on OpenCV, achieving advanced learning in OpenCV.

Discussion Group

Welcome to join the reader group of the public account to exchange with peers. Currently, there are WeChat groups for SLAM, 3D vision, sensors, autonomous driving, computational photography, detection, segmentation, recognition, medical imaging, GAN, algorithm competitions, etc. (these will be gradually subdivided in the future). Please scan the WeChat number below to join the group, and note: "Nickname + School/Company + Research Direction", for example: "Zhang San + Shanghai Jiao Tong University + Visual SLAM". Please follow the format; otherwise, your request will not be approved. After successful addition, you will be invited into the relevant WeChat group based on your research direction. Please do not send advertisements in the group; otherwise, you will be removed from the group. Thank you for your understanding.~