The key to whether a program is easy to debug lies in the completeness of the debugging information. This article provides a brief introduction to what DWARF debugging information is based on this premise.
What is DWARF
Debugging With Attributed Record Formats is a debugging information format used by many compilers, which allows for easy source-level debugging of code. The standard documentation for DWARF is as follows:
https://dwarfstd.org/doc/DWARF5.pdf
What Does DWARF Contain
When we compile a program, we can compare the presence of DWARF in ELF by compiling with and without the -g option, as shown below:
gcc example.c -g -o example_with_dwarf
gcc example.c -o example_without_dwarf
At this point, we can compare their sections as follows:
readelf -S example_with_dwarf
readelf -S example_without_dwarf
The comparison is as follows:
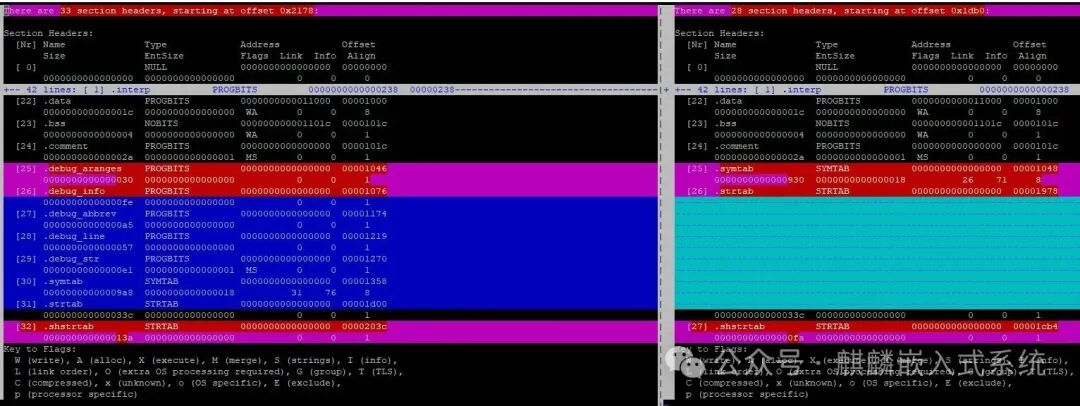
As we can see, DWARF actually adds the following sections:
- .debug_aranges
- .debug_info
- .debug_abbrev
- .debug_line
- .debug_str
The contents of these sections provide auxiliary information for source-level debugging of this binary, mainly including the following:
- Function names
- Variable calculations
- Variable types
- Source code lines
- Source file paths
Using dwarfdump, we can parse the actual contents of these sections as follows:
# dwarfdump -a example_with_dwarf

.debug_info

COMPILE_UNIT<header overall offset = 0x00000000>:
< 0><0x0000000b>  DW_TAG_compile_unit
                    DW_AT_producer              GNU C17 10.3.0 -mlittle-endian -mabi=lp64 -g -fasynchronous-unwind-tables -fstack-protector-strong -fstack-clash-protection
                    DW_AT_language              DW_LANG_C99
                    DW_AT_name                  example.c
                    DW_AT_comp_dir              /root/gdb
                    DW_AT_low_pc                0x00000894
                    DW_AT_high_pc               <offset-from-lowpc>180
                    DW_AT_stmt_list             0x00000000

LOCAL_SYMBOLS:
< 1><0x0000002d>    DW_TAG_base_type
                      DW_AT_byte_size             0x00000008
                      DW_AT_encoding              DW_ATE_unsigned
                      DW_AT_name                  long unsigned int
......

.debug_line: line number info for a single cu
Source lines (from CU-DIE at .debug_info offset 0x0000000b):

            NS new statement, BB new basic block, ET endoftext sequence
            PE prologue end, EB epilogue begin
            IS=val ISA number, DI=val discriminator value
<pc>        [lno,col] NS BB ET PE EB IS= DI= uri: "filepath"
0x00000894  [   9, 1] NS uri: "/root/gdb/example.c"
......

.debug_str
name at offset 0x00000000, length   13is'long long int'
name at offset 0x0000000e, length    4is'main'
name at offset 0x00000013, length   22is'long long unsigned int'
name at offset 0x0000002a, length   13is'unsigned char'
name at offset 0x00000038, length    9is'example.c'
name at offset 0x00000042, length   18is'short unsigned int'
name at offset 0x00000055, length  123is'GNU C17 10.3.0 -mlittle-endian -mabi=lp64 -g -fasynchronous-unwind-tables -fstack-protector-strong -fstack-clash-protection'
name at offset 0x000000d1, length    5is'hello'
name at offset 0x000000d7, length    9is'short int'
name at offset 0x000000e1, length    9is'/root/gdb'

.debug_aranges

COMPILE_UNIT<header overall offset = 0x00000000>:
< 0><0x0000000b>  DW_TAG_compile_unit
                    DW_AT_producer              GNU C17 10.3.0 -mlittle-endian -mabi=lp64 -g -fasynchronous-unwind-tables -fstack-protector-strong -fstack-clash-protection
                    DW_AT_language              DW_LANG_C99
                    DW_AT_name                  example.c
                    DW_AT_comp_dir              /root/gdb
                    DW_AT_low_pc                0x00000894
                    DW_AT_high_pc               <offset-from-lowpc>180
                    DW_AT_stmt_list             0x00000000


arange starts at 0x00000894, length of0x000000b4, cu_die_offset = 0x0000000b
arange end

.debug_frame
How to Extract DWARF
In Linux distributions, such as the Debian series, the software package with the same name provides a ddeb, which contains the debug information for that program, i.e., the DWARF information file.
Taking example_with_dwarf as an example, we first extract its DWARF debug information as follows:
objcopy --only-keep-debug example_with_dwarf example.debug
Then we remove the debug information from example_with_dwarf as follows:
objcopy --strip-debug example_with_dwarf
At this point, gdb debugging example_with_dwarf has no symbols, as shown below:
# gdb ./example_with_dwarf
Reading symbols from ./example_with_dwarf...
(No debugging symbols found in ./example_with_dwarf)
(gdb) list
No symbol table is loaded.  Use the "file" command.
However, we can manually load the DWARF as follows:
(gdb) add-symbol-file example.debug
add symbol table from file "example.debug"
(y or n) y
Reading symbols from example.debug...
(gdb) list
11          memcpy(p, hello, strlen(hello) + 1);
12          free(p);
13      }
14
15      int sum(int x)
16      {
17          int s = x + y;
18          printf("sum=%d\n", s);
19          mem();
20          return s;
This allows the binary without DWARF information to easily load the separate DWARF file, thus supporting convenient source-level debugging.
Strip
In general, Debian packages will call strip for further trimming, rather than just trimming debug info as shown below:
strip program
objcopy --strip-debug program
This means that the stripped program will naturally lose both <span>.symtab</span> and <span>.strtab</span>. Therefore, when debugging the operating system, it is important to note that stripped binaries are more difficult to debug than binaries that only have debug info removed. The reason is that <span>.symtab</span> and <span>.strtab</span> store the symbol tables for linking and debugging. The explanation is as follows:
If a program only removes debug info, then because <span>.symtab</span> and <span>.strtab</span> exist, breakpoints can still be set because the function names we input can still be found by gdb. For example:
(gdb) l
No symbol table is loaded.  Use the "file" command.
(gdb) b mem
Breakpoint 1 at 0x8a0
(gdb) r
Starting program: /root/gdb/example_with_dwarf
Breakpoint 1, 0x0000aaaaaaaaa8a0 in mem ()
Because the additional information provided by DWARF does not exist, the address is instead based on the runtime address of the code, but the program can still be debugged.
However, for applications stripped by strip, if we run gdb, we may not be able to set breakpoints by name, as shown below:
# strip  example_with_dwarf
# gdb ./example_with_dwarf
(gdb) l
No symbol table is loaded.  Use the "file" command.
(gdb) b main
Function "main" not defined.
Breakpoint 1 (main) pending.
(gdb) b mem
Function "mem" not defined.
Breakpoint 2 (mem) pending.
(gdb) r
Starting program: /root/gdb/example_with_dwarf
sum=3
[Inferior 1 (process 756218) exited normally]
As we can see, we are issuing function names in gdb, but because <span>.symtab</span> and <span>.strtab</span> are missing, it naturally cannot find the corresponding function addresses by name.
How to Find the Entry Point of a Stripped Binary
As mentioned above, if a program cannot find the address by function name after being stripped, how can we locate and debug it? In fact, we can find the function entry point through calculations, as follows:
When the program is stripped, we cannot set a breakpoint at main:
(gdb) b main
Function "main" not defined.
However, every program has an entry point, which is at the entry of the ELF header. In gdb, we can read the actual offset of the entry after loading the program once, as follows:
(gdb) r
Starting program: /root/gdb/example
sum=3
[Inferior 1 (process 830429) exited normally]
(gdb) info files
Symbols from "/root/gdb/example".
Local exec file:
        `/root/gdb/example', file type elf64-littleaarch64.
        Entry point: 0xaaaaaaaaa780
As we can see, the entry of this program is 0xaaaaaaaaa780, so we can set a breakpoint at this address:
(gdb) b *0xaaaaaaaaa780
Breakpoint 1 at 0xaaaaaaaaa780
(gdb) r
Starting program: /root/gdb/example

Breakpoint 1, 0x0000aaaaaaaaa780 in ?? ()
This is the actual function entry point. It is worth noting that this is not the main function, but the <span>_start</span> function, and we can proceed with some hacking operations from here.
How to Debug a Program Without Symbols
As mentioned above, in operating systems, many programs are stripped, making it difficult to debug them simply because function names do not correspond to addresses, and it is challenging to achieve this through manual calculations.
However, a program that is said to be without symbols should be one that was compiled without the -g flag and has not been stripped.
So how do we debug such a program?
This situation is actually quite simple. Based on previous articles, we know that the main reason a program is easy to debug is the loading of DWARF. Therefore, the question is how to debug a function without the help of DWARF information by inferring calculations through registers. Below is a simple practice using a sum function.
The function is as follows:
int sum(int x)
{
    int s = x + y;
    printf("sum=%d\n", s);
    return s;
}
So how do we obtain the values of x, y, and s without the help of DWARF information? We can do this by examining the registers and disassembling the code. We can set a breakpoint at the sum function and then disassemble it as follows:
(gdb) b sum
Breakpoint 1 at 0x8f4
(gdb) r
Starting program: /root/gdb/example

Breakpoint 1, 0x0000aaaaaaaaa8f4 in sum ()
(gdb) disassemble
Dump of assembler code for function sum:
   0x0000aaaaaaaaa8e0 <+0>:     stp     x29, x30, [sp, #-48]!
   0x0000aaaaaaaaa8e4 <+4>:     mov     x29, sp
   0x0000aaaaaaaaa8e8 <+8>:     str     w0, [sp, #28]
   0x0000aaaaaaaaa8ec <+12>:    adrp    x0, 0xaaaaaaabb000
   0x0000aaaaaaaaa8f0 <+16>:    add     x0, x0, #0x18
=> 0x0000aaaaaaaaa8f4 <+20>:    ldr     w0, [x0]
   0x0000aaaaaaaaa8f8 <+24>:    ldr     w1, [sp, #28]
   0x0000aaaaaaaaa8fc <+28>:    add     w0, w1, w0
   0x0000aaaaaaaaa900 <+32>:    str     w0, [sp, #44]
   0x0000aaaaaaaaa904 <+36>:    ldr     w1, [sp, #44]
   0x0000aaaaaaaaa908 <+40>:    adrp    x0, 0xaaaaaaaaa000
   0x0000aaaaaaaaa90c <+44>:    add     x0, x0, #0x9e8
   0x0000aaaaaaaaa910 <+48>:    bl      0xaaaaaaaaa770 <printf@plt>
   0x0000aaaaaaaaa914 <+52>:    ldr     w0, [sp, #44]
   0x0000aaaaaaaaa918 <+56>:    ldp     x29, x30, [sp], #48
   0x0000aaaaaaaaa91c <+60>:    ret
End of assembler dump.
As we can see, by analyzing the assembly code, the value of y should be at 0xaaaaaaabb018, so we can directly read and verify it:
0xaaaaaaabb018 <y>: 0x00000002
While the value of x should be at sp+28, we can read and verify it:
(gdb) x/wx $sp+28
0xfffffffff30c: 0x00000001
At this point, the value of s is stored at sp+44, so we first adjust the stack frame and then print it:
(gdb) b *0x0000aaaaaaaaa904
Breakpoint 2 at 0xaaaaaaaaa904
(gdb) c
Continuing.

Breakpoint 2, 0x0000aaaaaaaaa904 in sum ()
(gdb) x $sp+44
0xfffffffff31c: 0x00000003
Thus, we have completed a simple debugging of a function without symbols. Essentially, it involves disassembling to understand the code and modifying memory. Compared to debugging programs without DWARF information, this is much more tedious.
Conclusion
This article provides a simple introduction based on debugging information, allowing for a clearer understanding of gdb debugging techniques. If a program lacks DWARF information, debugging it requires analyzing the stack and assembly to understand it, which usually only allows for fragmentary logical analysis.However, if a program has DWARF information, using gdb for debugging becomes very convenient, allowing for a comprehensive analysis of code behavior.If a program is stripped, based on personal experience, it is not recommended to force analysis, as even if memory addresses are calculated, access may not be possible, making the investment not worth the return.