PLC debugging is the “last mile” of electrical project implementation—no matter how perfectly the program is written or how standard the wiring is, if there are issues during the debugging phase, the equipment will not operate normally. Many engineers, when first encountering debugging, often fall into the trap of “power on with no response → randomly modifying the program → getting more confused”.
Today, in conjunction with practical scenarios of Siemens S7-1200/200 SMART, we will break down the four core steps of PLC debugging, from preparation to acceptance. Each step includes “operational procedures + visual breakdown + pitfall guide” to help you efficiently complete debugging and avoid 90% of the detours.
1. Preparation Before Debugging: “Three Checks and Two Preparations” to Block Issues Before Power-On
Core Objective: Ensure hardware is fault-free and software is error-free, preventing module damage or fault triggers after power-on. Many beginners rush to power on, only to burn out analog modules due to incorrect wiring or wrong program versions—preparation before power-on is more important than “firefighting” after power-on.
Operational Procedures (Three Checks and Two Preparations)
1. Check Hardware: Wiring, Modules, Power Supply
- Wiring Check: Compare with the electrical schematic, checking each point for correct wiring of inputs (buttons, sensors) and outputs (contactors, indicator lights), focusing on “strong/weak current isolation” (e.g., whether the 220V power line and PLC signal line are separated to avoid interference) and “common terminal polarity” (e.g., whether the N line is connected correctly, whether the DC24V positive and negative terminals are reversed).
- Module Status: Check that the PLC CPU, input/output modules, and analog modules are securely installed, terminal screws are tightened (looseness can lead to poor contact), and that module indicator lights are normal (the CPU’s “SF” fault light should not be lit when not powered).
- Power Supply Check: Use a multimeter to measure the voltage at the PLC power terminals (e.g., L1/N connected to AC220V, DC24V terminals) to ensure it is within the allowable range (AC220V±10%, DC24V±5%), to avoid burning out modules due to excessive voltage.
2. Check Software: Program, Configuration, Variables
- Program Version: Confirm that the program downloaded to the PLC is the “final version” with no syntax errors (click “compile” in TIA Portal to ensure “no errors” message), especially checking that “addresses correspond to hardware configuration” (e.g., whether the analog input address IW64 matches channel 0 of the SM1231 module).
- Hardware Configuration: Verify that the hardware configuration in TIA Portal matches the actual PLC model and module order (e.g., CPU is 1214C DC/DC/DC, expansion module is SM1231 AI 4×12 bits, the order must not be incorrect), as misconfiguration can lead to module recognition failure.
- Variable Table: Prepare a monitoring table for commonly used variables (e.g., input I0.0, output Q0.0, intermediate variable M0.0) in advance for real-time status observation during debugging.
3. Prepare Tools: Multimeter, Communication Cable, Spare Parts
- Essential Tools: Digital multimeter (for measuring voltage and continuity), PLC programming cable (e.g., USB-PPI, PROFINET cable), Phillips screwdriver (for tightening terminals), insulated gloves (for high voltage operations);
- Spare Parts: Spare fuses, terminals, DC24V power modules (to prevent unexpected failures from delaying progress).
Visual Breakdown: Wiring Check Comparison Image
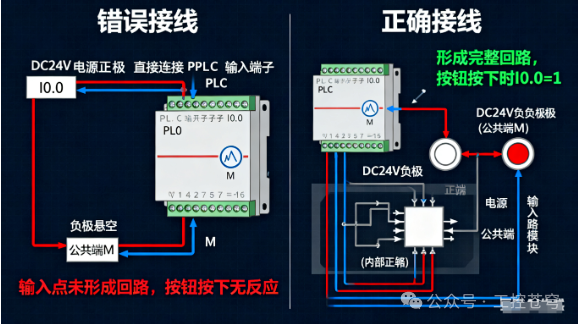
“PLC Wiring Check Comparison Image”: Left side “Incorrect Wiring”—DC24V positive connected to PLC input terminal I0.0, negative not connected to common terminal, note “Input point does not form a loop, no response when button is pressed”; Right side “Correct Wiring”—I0.0 connected to button, the other end of the button connected to DC24V negative (common terminal M), note “Forms a complete loop, I0.0=1 when button is pressed”
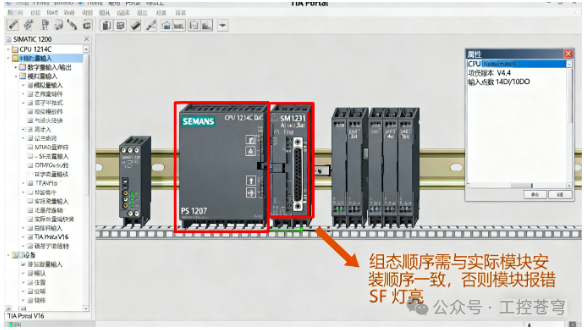
“TIA Portal Hardware Configuration Screenshot”: Red box highlights CPU 1214C and SM1231 AI module, note “Configuration order must match the actual module installation order, otherwise the module will report an error and the SF light will be on”
Pitfall Guide
- ❌ Do not touch terminals with your hands: Always disconnect power before checking, and when checking high voltage terminals, use a multimeter in continuity mode (not your hands) to confirm there is no short circuit;
- ❌ Do not skip “compiling the program”: Even if only one contact has been changed, recompile to avoid “syntax errors in the program that go unnoticed, leading to SF fault after download”.
2. Hardware Step Debugging: “Point” First, Then “Run”, Confirm All I/O Are Normal
Core Objective: Test all input (I) and output (Q) points one by one to ensure “input action → PLC recognition, PLC output → device action”, eliminating hardware faults (e.g., incorrect wiring, faulty sensors, stuck contactors).
This step is the “foundation of foundations”—if the I/O points are not normal, subsequent program debugging is like “a castle in the air”. For example, if the button is pressed and the PLC input point does not light up, it may be due to incorrect wiring; if the PLC output point lights up but the contactor does not engage, it may be due to a broken wire from the output terminal to the contactor.
Operational Procedures (Input Testing → Output Testing)
1. Input Point Testing (Manual Trigger, Check PLC Status)
- Power On: Supply AC220V power to the PLC, power on the DC24V module, the CPU’s “RUN” light should be on (if the SF light is on, check hardware configuration or wiring first);
- Monitor Inputs: Open TIA Portal “Online Monitoring” → “Variable Table”, manually press the button (e.g., the start button connected to I0.0), observe whether the status of I0.0 changes from “0” to “1” (and back to “0” when released);
- Test Each Input: Test all input points (buttons, photoelectric sensors, limit switches) and record any “non-responsive points” (to check wiring or sensors later).
2. Output Point Testing (Forced Output, Check Device Action)
- Forced Output: In the variable table, right-click the output point (e.g., Q0.0, controlling the motor contactor) → “Force” → input “1”, observe whether the PLC output terminal Q0.0 indicator light is on, and check whether the contactor engages (if the light is on but the contactor does not act, check the wiring from Q0.0 to the contactor or the contactor coil);
- Cancel Force: After testing, right-click “Cancel Force” to ensure the output point returns to normal (to avoid the program being unable to control under forced conditions);
- Safety Note: When testing high voltage outputs (e.g., contactors, inverters), ensure the device is unloaded (e.g., the motor is powered off) to prevent accidental startup and injury.
Visual Breakdown: TIA Portal I/O Point Monitoring Screenshot
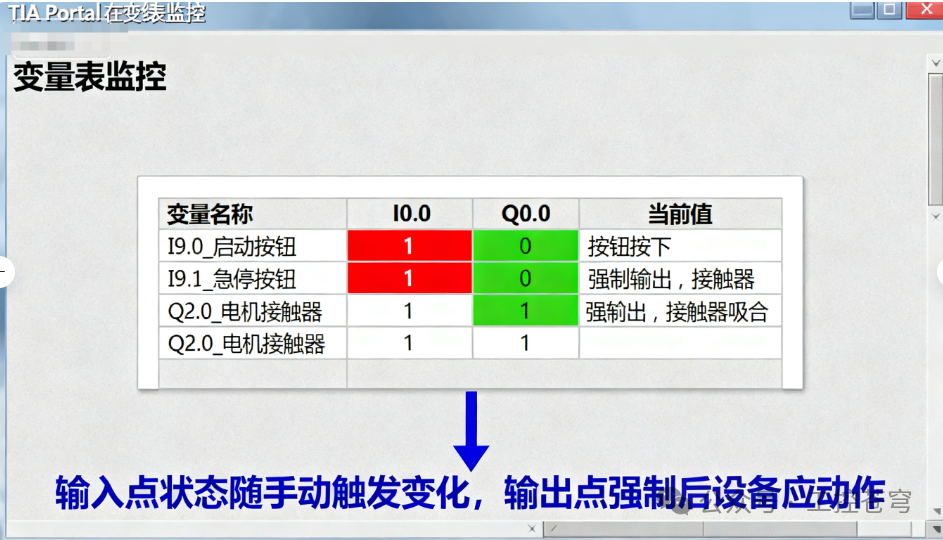
“TIA Portal Variable Table Monitoring Screenshot”: The left variable list includes “I0.0_Start Button”, “I0.1_Emergency Stop Button”, “Q0.0_Motor Contactor”; the right “Current Value” column shows I0.0 as “1” (red, marked “Button Pressed”), Q0.0 as “1” (green, marked “Forced Output, Contactor Engaged”), note “Input point status changes with manual trigger, output point should act after forced output”
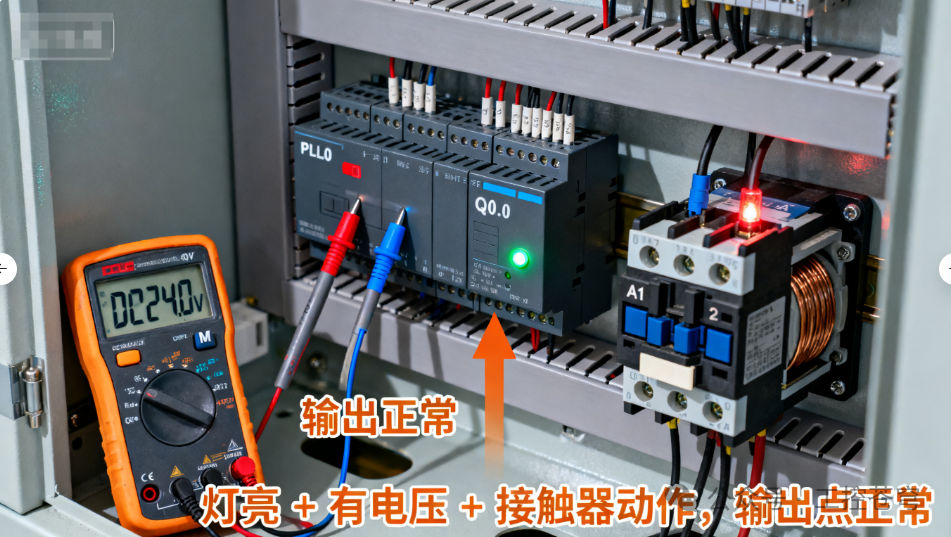
“PLC Output Terminal Testing Field Image”: Multimeter probes connected to Q0.0 and common terminal M, showing DC24V (marked “Output Normal”), the contactor coil powered on and engaged, note “Light On + Voltage Present + Contactor Action, Output Point Normal”
Pitfall Guide
- ❌ Do not force “Normally Closed Outputs”: For example, if the emergency stop output Q0.1 is normally closed (acts when powered off), forcing Q0.1=0 may cause the emergency stop to take effect; confirm device safety first;
- ❌ Do not overlook “Analog Input Testing”: Analog points (e.g., pressure sensor connected to AI0) can be tested with a signal generator, input 4mA to see if IW64 = 0, and 20mA to see if IW64 = 27648, confirming the analog module is normal.
3. Program Logic Debugging: Segment Debugging from “Module” to “Overall”
Core Objective: Validate whether the program logic meets design requirements, such as “Start → Motor Running, Emergency Stop → Motor Stopping, Overload → Alarm”, eliminating program loopholes (e.g., logical dead loops, unmet interlock conditions).
Many engineers are accustomed to “downloading the entire program and running it directly”, resulting in problems without knowing the cause—correct practice is “segment debugging”: first debug individual functional modules (e.g., start-stop logic), then interlock protection, and finally overall coordination.
Operational Procedures (Segment Debugging → Overall Coordination)
1. Debugging Individual Functional Modules (Taking “Motor Start-Stop” as an Example)
- Shield Unrelated Logic: In the program, use “//” to comment out logic unrelated to start-stop (e.g., overload protection, PID control), keeping only the loop of “Start Button I0.0 → Intermediate Relay M0.0 → Output Q0.0”;
- Monitor Operation: Online monitor the ladder diagram (LAD), press I0.0, observe whether M0.0 is set to 1, and whether Q0.0 outputs (contactor engages); release I0.0, if the program is designed for “self-locking”, M0.0 should remain 1, press the stop button I0.2, M0.0 should be set to 0, and Q0.0 should disconnect;
- Record Issues: If M0.0 does not set to 1, check whether I0.0 is normal (already tested in the first step), and whether there are other conditions in the program (e.g., emergency stop interlock) that are not met.
2. Interlock Protection Debugging (Emergency Stop, Overload, Limit Switch)
- Restore Interlock Logic: Uncomment and add “Emergency Stop I0.1 Normally Closed Contact” and “Overload Relay I0.3 Normally Closed Contact” to the start-stop loop;
- Simulate Faults: Press the emergency stop I0.1, observe whether M0.0 is immediately set to 0, and Q0.0 disconnects (motor stops); short-circuit I0.3 (simulate overload), check whether M0.0 is set to 0, and whether alarm output Q0.5 lights up (if the alarm does not light, check the alarm logic).
3. Overall Coordination (Multi-Module Collaboration)
- Restore All Logic: Uncomment all shielding to let the program run completely;
- Simulate Actual Working Conditions: For example, “Start → Motor Running → Sensor Detects Material → Cylinder Action → Motor Stops”, operate according to the process, monitor the status changes of each variable, and confirm whether the timing is correct;
- Capture Anomalies: If a step gets stuck (e.g., cylinder does not act), check whether the corresponding output point (e.g., Q0.2) has output, then check the conditions for the cylinder action in the program (e.g., whether sensor I0.5 = 1).
Visual Breakdown: Motor Start-Stop Interlock Program Monitoring Screenshot
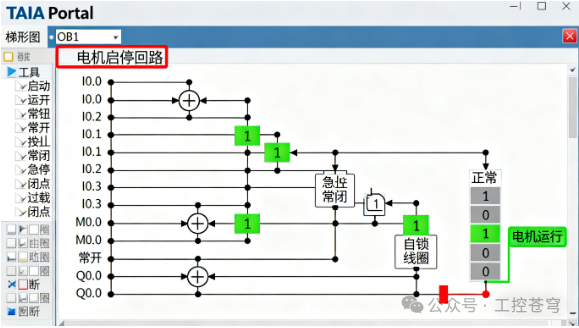
“TIA Portal Ladder Diagram Monitoring Screenshot”: Red box highlights the “Motor Start-Stop Loop”—I0.0 (Start), I0.2 (Stop), I0.1 (Normally Closed Emergency Stop), I0.3 (Normally Closed Overload), M0.0 (Self-Locking), Q0.0 (Output), in the monitoring state I0.0=1, M0.0=1, Q0.0=1 (green highlight, marked “Motor Running”); pressing I0.1 (Emergency Stop) opens the I0.1 contact, M0.0=0, Q0.0=0 (marked “Emergency Stop Activated, Motor Stopped”)
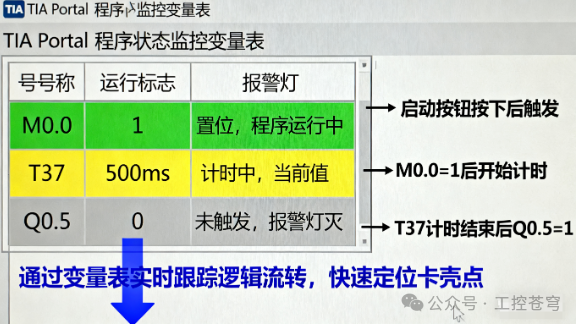
“Program Status Monitoring Variable Table”: The status of variable M0.0 (running flag), T37 (delay timer), and Q0.5 (alarm light) changes with operations, note “Real-time tracking of logical flow through the variable table, quickly locating stuck points”
Pitfall Guide
- ❌ Do not blindly modify the program: When logic is not working, first check “whether input conditions are met” (e.g., if M0.0 does not set to 1, check whether I0.1 emergency stop is not reset), then modify the program;
- ❌ Ignore “Timers/Counters”: For example, in delay start logic, monitor the current value of timer T37 to see if it reaches the set value (e.g., 5s), to avoid logic not executing due to incorrect timer parameters.
4. System Coordination and Acceptance: Simulate Working Conditions, Sign Off on “Can Work”
Core Objective: Combine all on-site equipment (sensors, actuators, inverters, touch screens) to simulate actual production conditions, test system stability, and ultimately sign off with the client.
This step is the “final verification before delivery”—not only must it “run”, but it must also be “stable and meet production requirements”, for example, in a constant pressure water supply system, testing whether “pressure fluctuations are within ±0.02MPa, and start-stop is without impact”.
Operational Procedures (Simulate Working Conditions → Stability Testing → Acceptance Sign-Off)
1. Simulate Actual Working Conditions (Run Through Production Process)
- Run with Load: For example, the motor drives a pump, the conveyor belt carries materials, rather than testing without load;
- Test Boundary Conditions: For example, “Minimum Pressure 0.3MPa → Inverter Reduces Frequency, Maximum Pressure 0.5MPa → Inverter Increases Frequency”, “Material Blockage → Emergency Stop Alarm”, confirming system response under extreme conditions;
- Linkage Testing: If there is a touch screen (HMI), operate the “Start/Stop/Set Value Modification” on the touch screen, checking whether the PLC responds normally and whether the displayed data is accurate (e.g., if the touch screen shows pressure 0.4MPa, the PLC variable table shows Actual_Press=0.4).
2. Stability Testing (Continuous Operation + Fault Simulation)
- Continuous Operation: Let the system run continuously for 1-2 hours, monitoring key parameters (e.g., pressure, temperature, current) for stability, with no abnormal alarms;
- Fault Injection: Simulate common faults (e.g., disconnecting sensor signal lines, pressing emergency stop, cutting off water supply), checking whether the system “safely shuts down + alarm prompts”, and whether it can reset normally after fault clearance.
3. Acceptance Sign-Off (Documentation for Reference)
- Organize Documentation: Output a “PLC Debugging Report”, including “debugging steps, test results, issues and solutions”, with variable table screenshots and alarm records;
- Client Confirmation: Test each item with the client according to the “Acceptance Standards”, confirming accuracy before signing to avoid future disputes.
Visual Breakdown: Constant Pressure Water Supply System Coordination Monitoring Screenshot
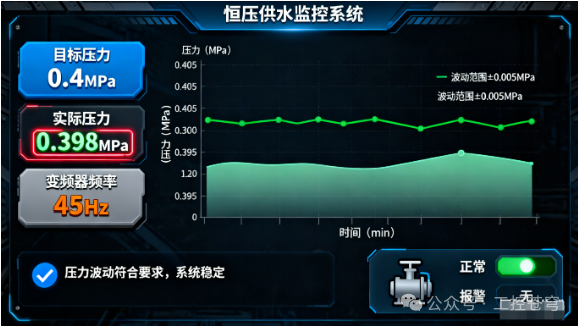
“Touch Screen Constant Pressure Monitoring Screen Screenshot”: Displays “Target Pressure 0.4MPa”, “Actual Pressure 0.398MPa”, “Inverter Frequency 45Hz”, trend graph shows pressure stabilizing between 0.395-0.405MPa, note “Pressure fluctuations meet requirements, system is stable”
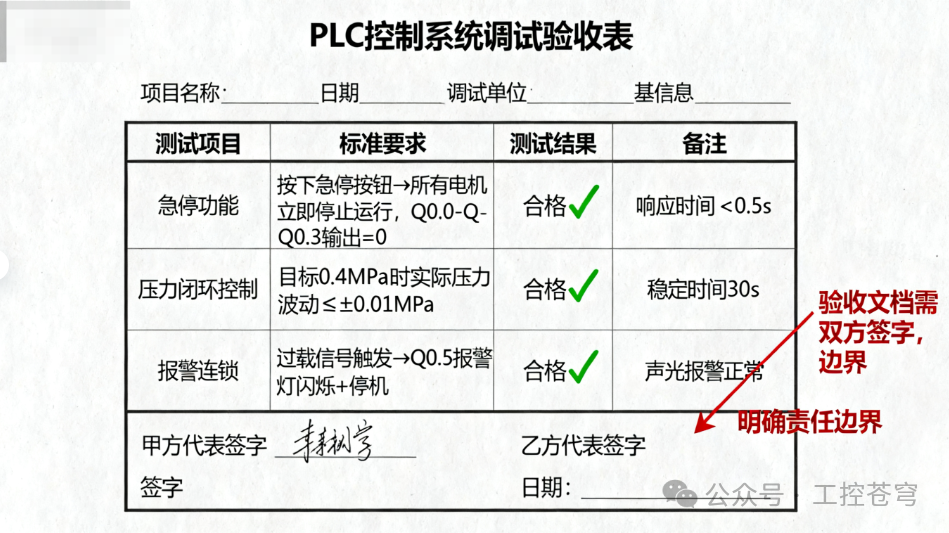
“PLC Debugging Report Acceptance Page Screenshot”: The table includes “Test Items, Standard Requirements, Test Results, Remarks”, such as “Emergency Stop Function” standard “Press Emergency Stop → All Motors Stop”, test result “Qualified”, with a section for “Client Signature” at the bottom, note “Acceptance documents must be signed by both parties to clarify responsibilities”
Pitfall Guide
- ❌ Do not omit “Load Testing”: Running normally without load may cause tripping under actual load due to excessive current; testing performance under actual load is necessary;
- ❌ Do not confirm verbally: All acceptance items must be “documented + signed”, to avoid future clients claiming “this function was not tested at that time”.
Summary: The “Golden Rules” of PLC Debugging
- Do Not Skimp on Preparation: Check wiring, programs, and tools three times, do not panic when powering on;
- Pass the Point Test First: Test each I/O point, eliminate hardware faults first;
- Debug Logic in Segments: First modules then overall, if stuck check conditions;
- Coordination Must Be Under Load: Simulate stable operation under working conditions, document and sign to avoid disputes.
Debugging is not about “luck”, but about “following procedures to troubleshoot”—even when encountering unfamiliar issues, as long as you return to these four steps, from hardware to software, from local to overall, you will always find the reason.
If you found this helpful, please give a follow + a heart! ^_^~