1. Configuration of FIR IP in Vivado

2. Setting up the simulation environment with Vivado and Modelsim
1. Importing Data from Matlab to Modelsim
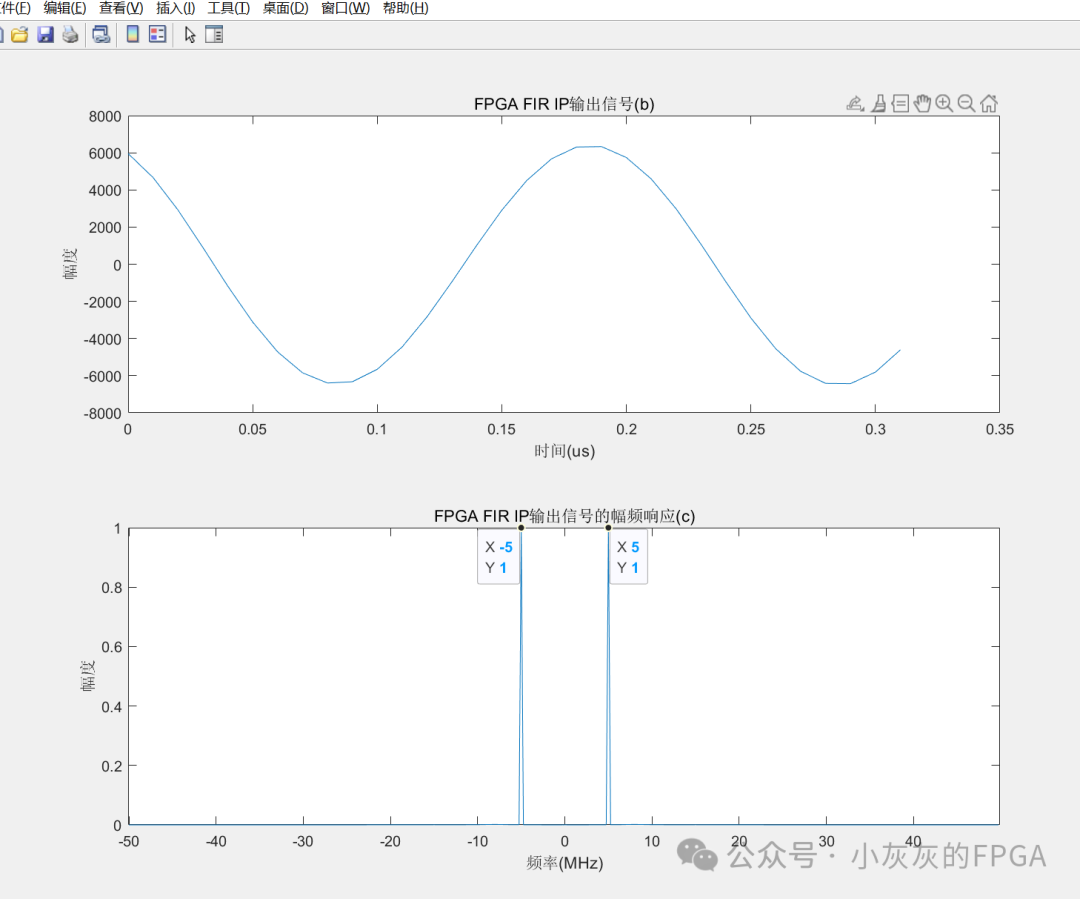
In the previous chapter, we designed a FIR digital filter using Vivado, and in the Modelsim simulation, the output data from the FIR IP was written to the data_out.txt file. This file is processed in Matlab to obtain the FFT spectrum, thereby analyzing whether the frequency of the processed data meets the design requirements.
A 15MHz single-tone signal and a 5MHz single-tone signal are combined to generate a mixed signal as the input signal for the FIR IP. After passing through a low-pass FIR filter with a cutoff frequency of 8MHz, the filtered signal at 5MHz is obtained. Of course, this is a theoretical design requirement and is merely a frequency validation. In fact, whether the amplitude meets the design requirements requires deeper validation.
2. Matlab Code Simulation
close all;
clear all;
clc;
% Set system parameters
Fs=100e6; % Sampling frequency
% Read data from text file
filename = 'data_out.txt';
fileID = fopen(filename, 'r'); % Open file
C = textscan(fileID, '%d'); % Read hexadecimal numbers
fclose(fileID); % Close file
% C is now a cell array containing all read values. Convert it to an array
dec_array = C{1}';
L=length(dec_array)-1;
fft_out=abs(fft(dec_array,L));         % Calculate the magnitude of the FFT transformation
% Normalization
%dec_array=dec_array/max(abs(dec_array));
%fft_out=fft_out/max(fft_out);
fft_out=[fft_out(L/2+1:L),fft_out(1:L/2)]; % Convert to a signal symmetric about the origin
% Generate time and frequency axes
t=[0:L-1];                        % Generate time axis in microseconds
t=t*(1/Fs)*(10^6);
m=[-L/2:1:(L/2-1)]*Fs/L*(10^(-6));% Generate frequency axis in MHz
% Plotting
figure;
subplot(2,1,1);
plot(t(1:32),dec_array(1:32));
xlabel('Time (us)');
ylabel('Amplitude');
title('FPGA FIR IP Output Signal (b)');

subplot(2,1,2);
plot(m,fft_out);
xlabel('Frequency (MHz)');
ylabel('Magnitude');
title('Magnitude-Frequency Response of FPGA FIR IP Output Signal (c)');
The time-domain signal output from the FPGA FIR IP is a single-tone signal. After FFT processing, it can be seen from the frequency spectrum that the frequency of this single-tone signal is 5MHz, indicating that the FIR IP design preliminarily meets the design requirements in frequency processing.