Share interest, spread happiness,
increase knowledge, and leave it beautiful.
Dear, this is the Learning Yard Academy!
Today, the editor brings you “Qing Reading (27):
How to create a 3D surface plot using MATLAB?”.
Welcome to visit!
Share interest, spread happiness,
increase knowledge, and leave it beautiful.
Dear, this is the Learning Yard Academy!
Today, the editor brings you Qing Reading (27):
How to create a 3D surface plot using MATLAB?
Welcome to visit!
1. Mind Map
2. Commonly Used Functions
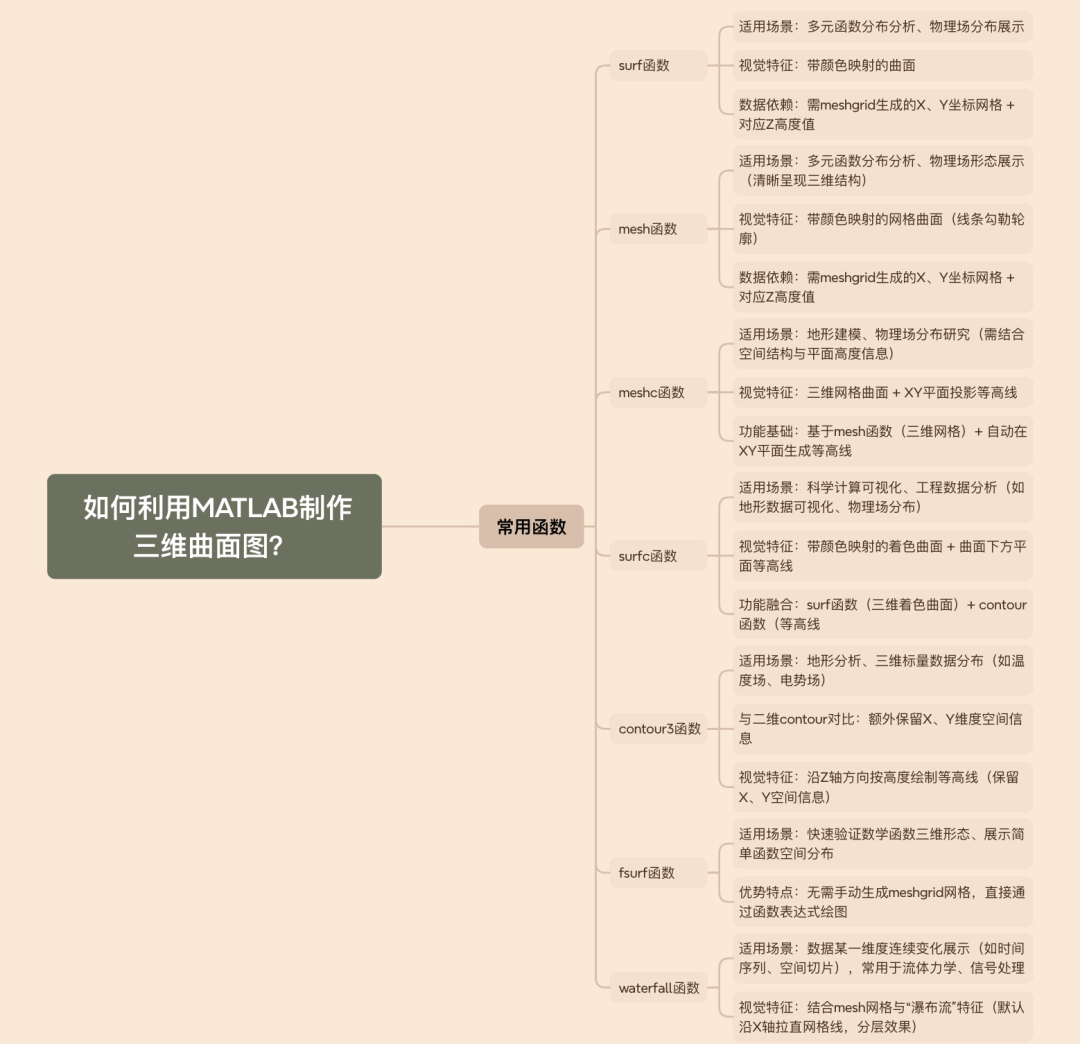
1.surf is the core function in MATLAB used for plotting 3D colored surface graphs. It constructs a surface with a colormap in 3D space based on grid data (the X and Y coordinate grids generated by meshgrid, and the corresponding calculated Z height values). This allows us to intuitively visualize the 3D shape of a function and is often used in scenarios such as analyzing the distribution of multivariate functions and physical field distributions.
1. The surf function is a core function in MATLAB used for plotting 3D colored surface graphs. Based on grid data (the X and Y coordinate grids generated by meshgrid, and the corresponding calculated Z height values), it constructs a surface with a colormap in 3D space. This allows us to intuitively visualize the 3D shape of a function and is often used in scenarios such as analyzing the distribution of multivariate functions and physical field distributions.
2.mesh is a classic function in MATLAB for plotting 3D mesh graphs. It constructs a mesh surface with a colormap in 3D space based on grid data (the X and Y coordinate grids generated by meshgrid, and the corresponding calculated Z height values). It outlines the surface contour and height changes through lines, and is often used in scenarios such as analyzing the distribution of multivariate functions and the shape of physical fields, clearly displaying the 3D structure of data.
2.The mesh function is a classic function in MATLAB for plotting 3D mesh graphs. Based on grid data (the X and Y coordinate grids generated by meshgrid, and the corresponding calculated Z height values), it constructs a mesh surface with a colormap in 3D space. It outlines the surface contour and height changes through lines, and is often used in scenarios such as analyzing the distribution of multivariate functions and the shape of physical fields, being able to clearly display the 3D structure of data.
3.meshc is a practical function in MATLAB for plotting 3D mesh graphs with bottom contour lines. It automatically generates contour lines in the XY plane projection based on the mesh function (which plots 3D mesh surfaces). It can simultaneously display the 3D shape of the surface and the planar contour of the height distribution, making it ideal for scenarios requiring analysis that combines spatial structure with planar height information, such as terrain modeling and physical field distribution research.
3. The meshc function is practical in MATLAB for plotting 3D mesh graphs with bottom contour lines. Based on the mesh function (which plots 3D mesh surfaces), it automatically generates contour lines in the XY plane projection. It can simultaneously display the 3D shape of the surface and the planar contour of the height distribution, making it ideal for scenarios requiring analysis that combines spatial structure with planar height information, such as terrain modeling and physical field distribution research.
4.surfc is a function in MATLAB used to plot 3D colored surface graphs while simultaneously drawing contour lines on the plane below the surface. It combines the functionalities of the surf function (for plotting 3D colored surfaces) and the contour function (for drawing contour lines), enabling a more comprehensive display of data distribution in 3D space and projection characteristics on 2D planes. It is often used in fields such as scientific computing, visualization, and engineering data analysis, such as terrain data visualization and physical field distribution display.
4. The surfc function in MATLAB is used to plot 3D colored surface graphs while simultaneously drawing contour lines on the plane below the surface. It combines the functionalities of the surf function (for plotting 3D colored surfaces) and the contour function (for drawing contour lines), enabling a more comprehensive display of data distribution in 3D space and projection characteristics on 2D planes. It is often used in fields such as scientific computing, visualization, and engineering data analysis, such as terrain data visualization and physical field distribution display.
5.contour3 is a function in MATLAB used to plot 3D contour graphs. It can draw contour lines by height along the Z-axis in 3D space, intuitively displaying the height distribution patterns of data in 3D space. Compared with 2D contours (contour), contour3 additionally retains the spatial information of the X and Y dimensions, making it suitable for analyzing the distribution of 3D scalar data such as terrain and physical fields (e.g., temperature fields, electric potential fields).
5. The contour3 function in MATLAB is used to plot 3D contour graphs. It can draw contour lines by height along the Z-axis in 3D space, intuitively displaying the height distribution patterns of data in 3D space. Compared with 2D contours (contour), contour3 additionally retains the spatial information of the X and Y dimensions, making it suitable for analyzing the distribution of 3D scalar data such as terrain and physical fields (e.g., temperature fields, electric potential fields).
6.fsurf is a 3D surface plotting tool in MATLAB specifically designed for symbolic functions or anonymous functions. It eliminates the need to manually generate meshgrid grids and directly plots surfaces through function expressions, simplifying the process from “function definition” to “visualization”. It is suitable for quickly verifying the 3D shape of mathematical functions or displaying the spatial distribution of simple functions.
6. The fsurf function in MATLAB is a 3D surface plotting tool specifically designed for symbolic functions or anonymous functions. It eliminates the need to manually generate meshgrid grids and directly plots surfaces through function expressions, simplifying the process from “function definition” to “visualization”. It is suitable for quickly verifying the 3D shape of mathematical functions or displaying the spatial distribution of simple functions.
7.waterfall is a function in MATLAB used to plot 3D waterfall graphs. It combines the visual characteristics of mesh (3D grid) and “waterfall flow”: along one axis (by default the X-axis), it “straightens” the grid lines into lines parallel to that axis, creating a layered effect similar to a waterfall. It is suitable for displaying continuous changes of data in a certain dimension (such as time series, spatial slices) and is often used in visualization in fields like fluid mechanics and signal processing.
7. The waterfall function in MATLAB is used to plot 3D waterfall graphs. It combines the visual characteristics of mesh (3D grid) and “waterfall flow”: along one axis (by default the X-axis), it “straightens” the grid lines into lines parallel to that axis, creating a layered effect similar to a waterfall. It is suitable for displaying continuous changes of data in a certain dimension (such as time series, spatial slices) and is often used in visualization in fields like fluid mechanics and signal processing.
3. Specific Commands
1.Surf Function(The Surf Function)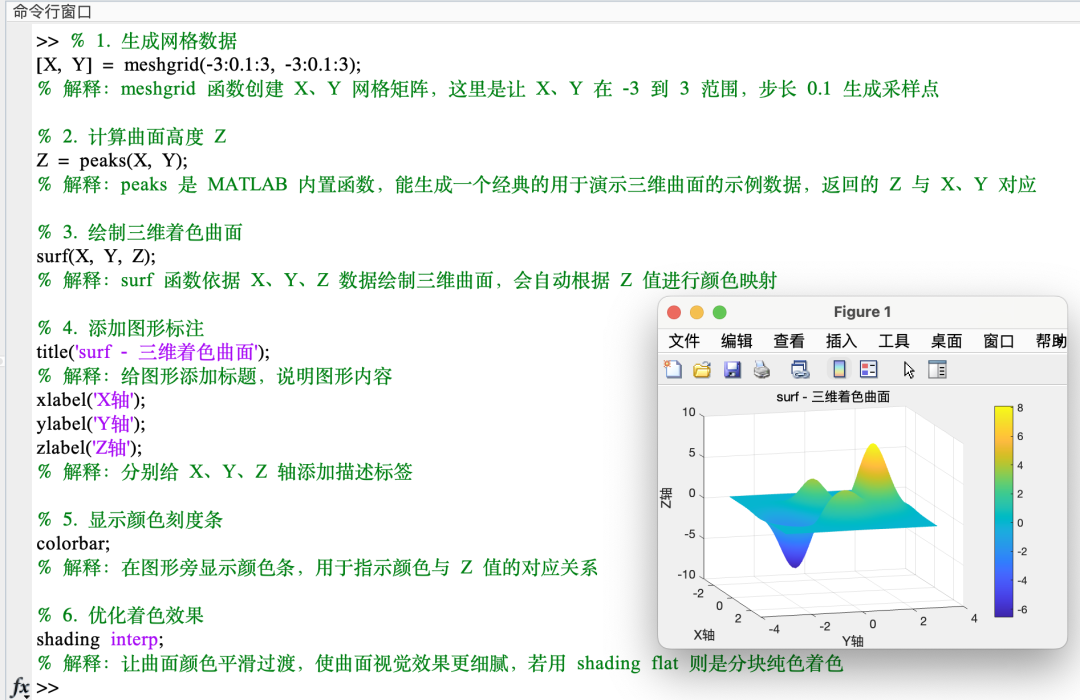
2.Mesh Function(The Mesh Function)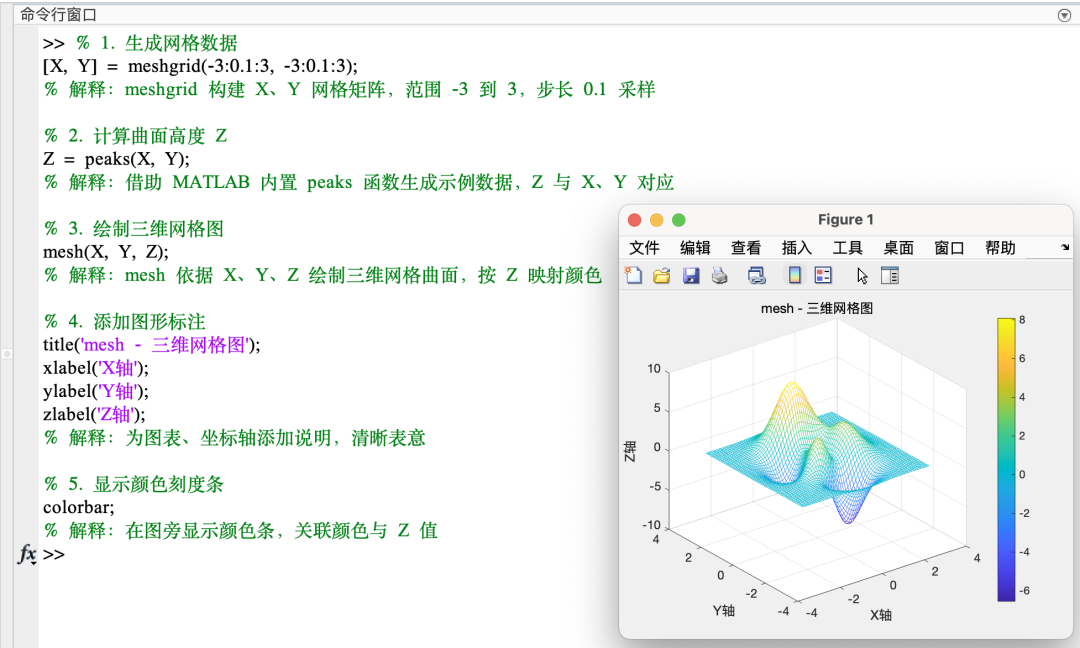
3.Meshc Function(The Meshc Function)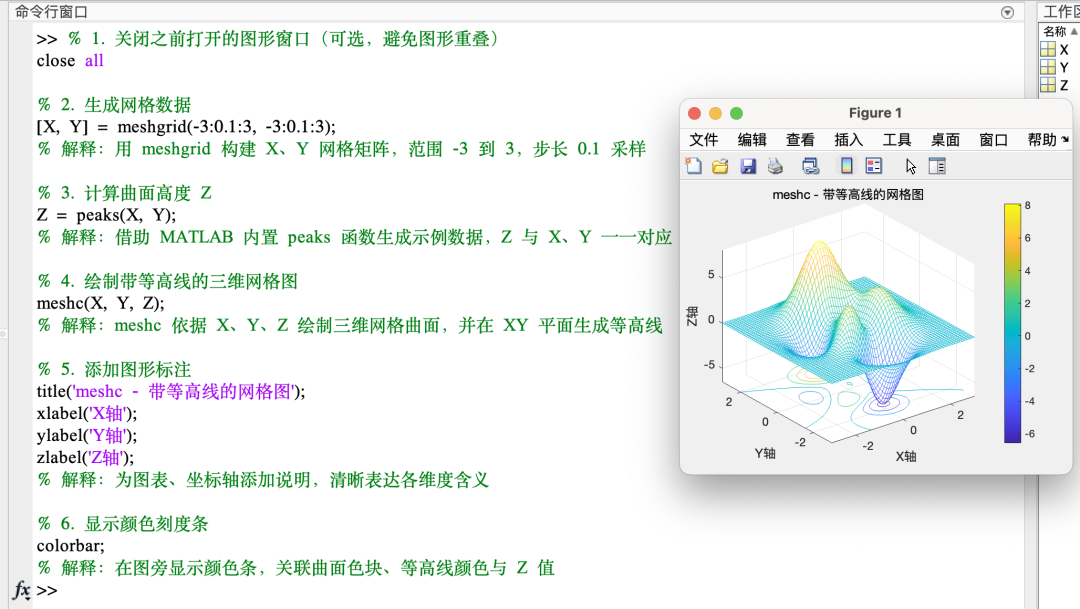
4.Surfc Function(The Surfc Function)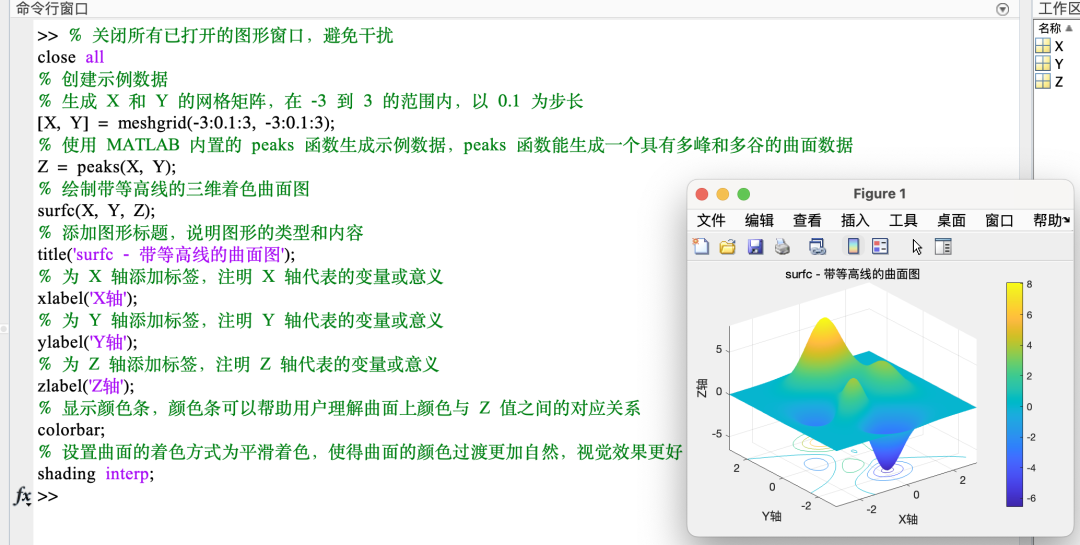
5.Contour3 Function(The Contour3 Function)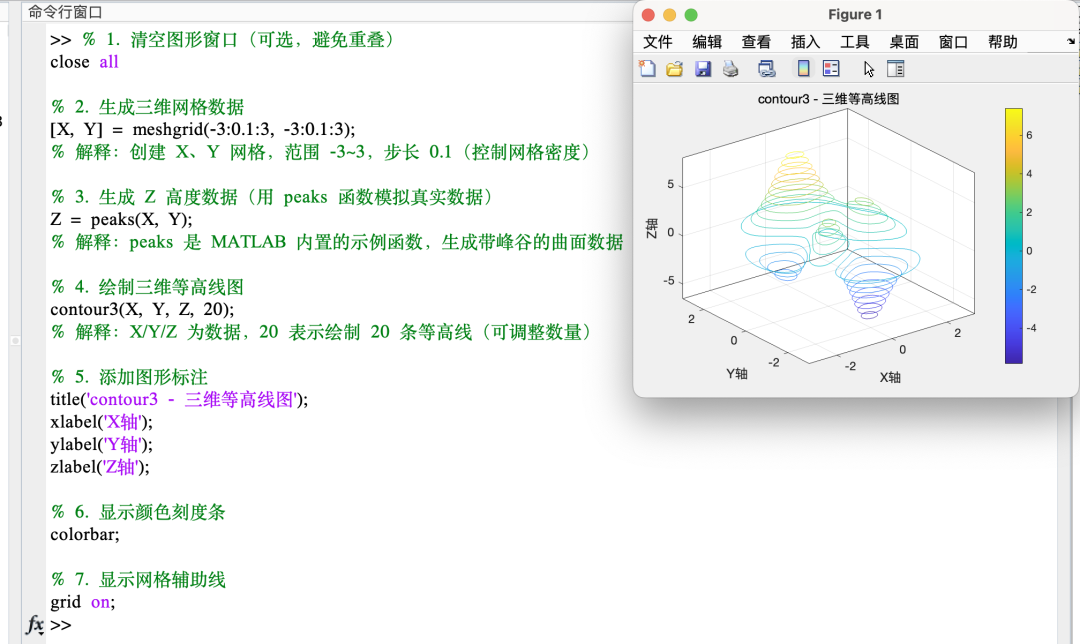
6.Fsurf Function(The Fsurf Function)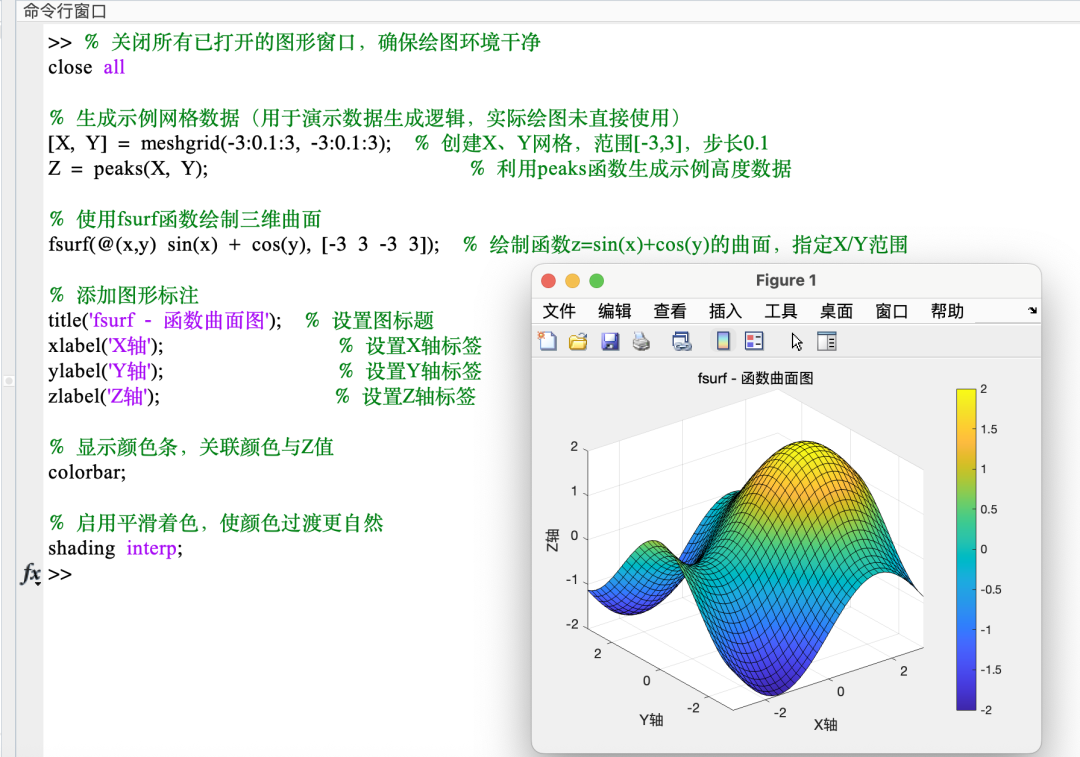
7.Waterfall Function(The Waterfall Function)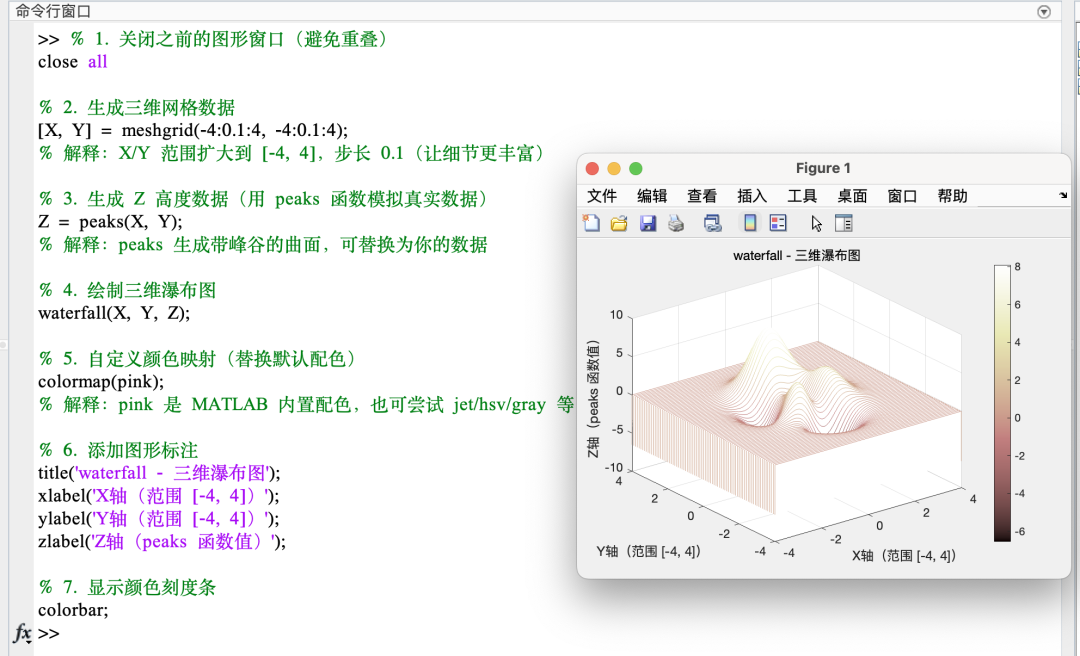
That’s all for today’s sharing.
If you have a unique idea about the article,
Please leave us a message.
And let us meet tomorrow.
I wish you a nice day!

Copywriter|hu
Layout|hu
Review|yyz
Translation: Google Translate
References: Baidu Encyclopedia, ChatGPT, bilibili
This article is organized and published by LearningYard, if there is any infringement, please leave a message in the background!