Computer Graduation Project by XiaoyueThank you for your attention!Big Data, Websites, Mini Programs, Android, Deep LearningData Analysis and Visualization System for Shared Bicycles Based on Big Data– Function IntroductionThis system is a data analysis and visualization platform for shared bicycles based on the Python big data technology stack, aimed at deeply mining the hidden value behind massive cycling data. The system uses Hadoop as the distributed storage foundation and leverages Spark’s powerful parallel computing capabilities to efficiently process and analyze the shared bicycle operation data from 2022 to 2023 across multiple dimensions. Core functionalities include peak hour identification based on time dimensions, comparison of usage patterns between weekdays and weekends, and analysis of the impact of environmental factors such as weather and temperature on cycling behavior. Furthermore, the system incorporates AI machine learning algorithms to intelligently classify cycling patterns through K-Means clustering, accurately identifying typical user profiles such as “commuting peak” and “weekend leisure”. All analysis results are encapsulated through a Django backend API and presented in a dynamic, interactive data visualization on the frontend using Vue and Echarts, transforming complex data into intuitive graphical representations. This provides scientific and robust data support for the refined operation, intelligent scheduling, and user growth strategies of shared bicycles, making it a comprehensive graduation project that integrates big data processing, AI analysis, and visualization.Data Analysis and Visualization System for Shared Bicycles Based on Big Data– Technical Introduction
Big Data Framework: Hadoop + Spark (Hive not used this time, customizable)
Development Languages: Python + Java (both versions supported)
Backend Framework: Django + Spring Boot (Spring + SpringMVC + Mybatis) (both versions supported)
Frontend: Vue + ElementUI + Echarts + HTML + CSS + JavaScript + jQuery
Detailed Technical Points: Hadoop, HDFS, Spark, Spark SQL, Pandas, NumPy
Database: MySQL
Data Analysis and Visualization System for Shared Bicycles Based on Big Data– Background and Significance
Background of the Topic
With the popularization of the concept of green travel in cities, shared bicycles have become an important tool to solve the “last mile” transportation problem, spreading across streets and alleys. Each scan and ride generates a record, and these records aggregate into a massive flow of data, containing the pulse of urban traffic patterns and citizens’ travel preferences. However, this raw data is vast and chaotic, making it difficult for traditional data processing tools to effectively handle its scale and complexity, resulting in a significant amount of valuable information being buried. How to utilize modern big data technology to extract valuable insights from this sea of data, thereby optimizing bicycle deployment, improving operational efficiency, and enhancing user experience, has become a highly relevant and technically challenging topic. This project was born in such a context, attempting to build a complete data analysis process that closely integrates theory with practical application, exploring the specific implementation path of big data technology in the field of smart city transportation.
Significance of the Topic
The significance of this topic mainly lies in two aspects: practical application and technical learning. From a practical perspective, although this is just a graduation project, the analytical framework it constructs can provide actual decision-making references for shared bicycle operators. For example, by analyzing the usage volume at different times, it can help operating companies more accurately schedule vehicles, deploying bicycles in demand hotspots during peak periods; by analyzing the impact of weather on cycling, it can provide early warnings for vehicle maintenance and user safety issues during adverse weather conditions. From a technical learning perspective, this project offers a valuable full-stack practical opportunity for computer science students. It is not merely about writing a website; rather, it encompasses the entire process from data collection, storage, and cleaning, to utilizing Spark for distributed computing, applying machine learning algorithms for pattern mining, and finally visualizing the results through frontend and backend technologies. This plays an irreplaceable role in deepening the understanding of the big data technology ecosystem, honing the ability to solve complex engineering problems, and enhancing practical project experience, making it an excellent exercise in transforming classroom knowledge into actual productivity.
Data Analysis and Visualization System for Shared Bicycles Based on Big Data– Video PresentationData Analysis and Visualization System for Shared Bicycles Based on Big Data– Image Presentation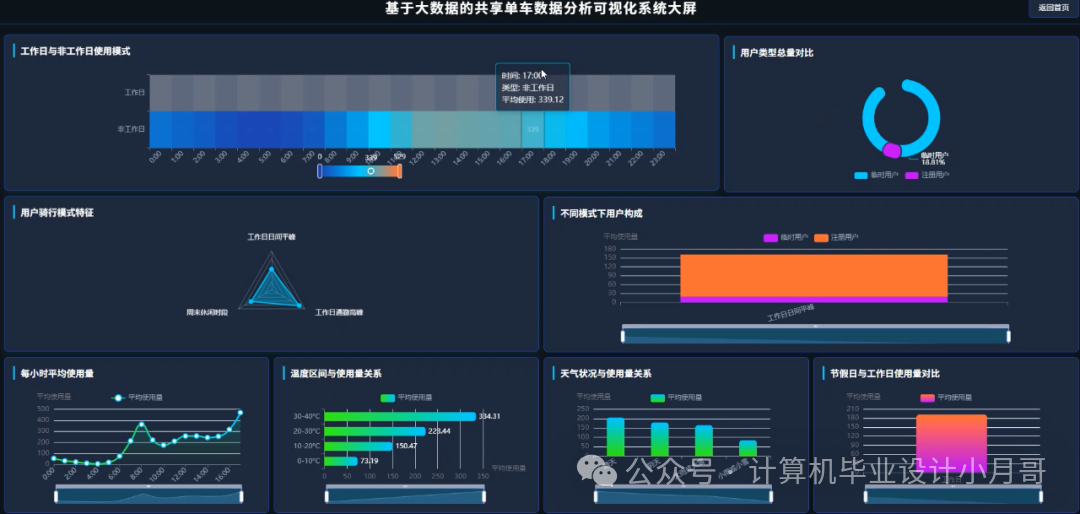 On the big screen
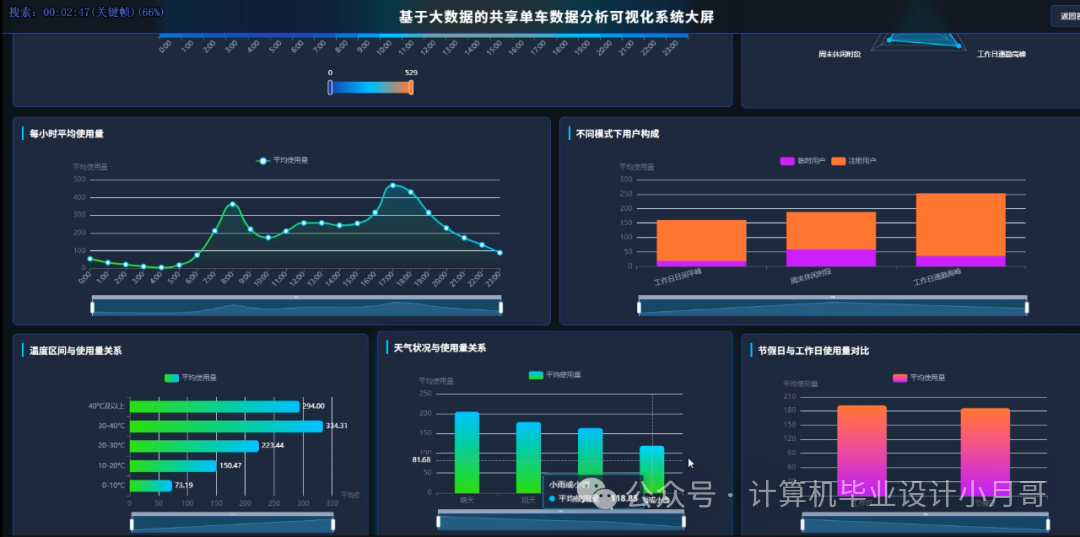 Below the big screen
 Login
Login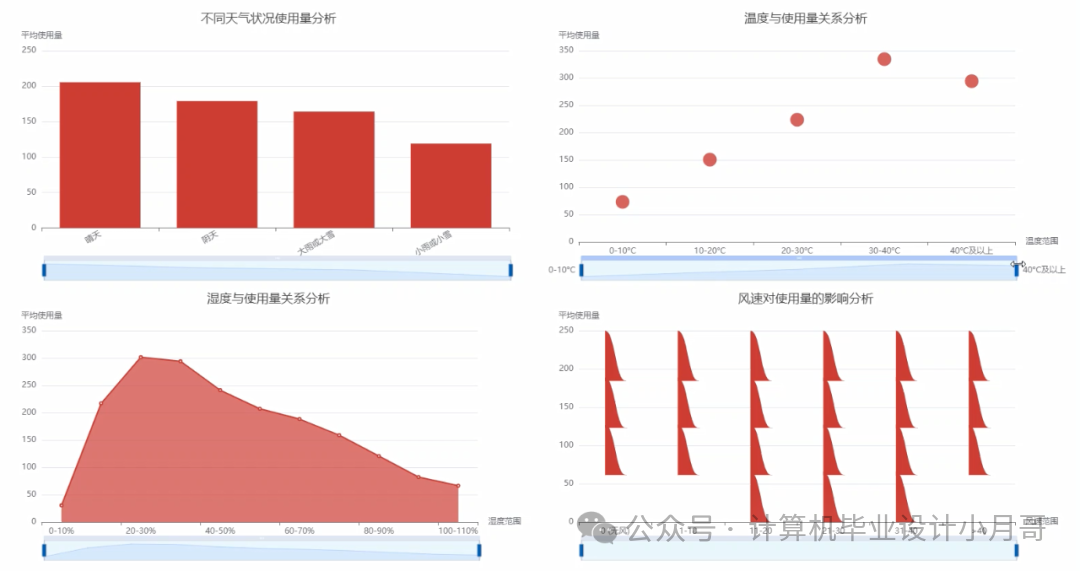 Environmental Dimension Analysis
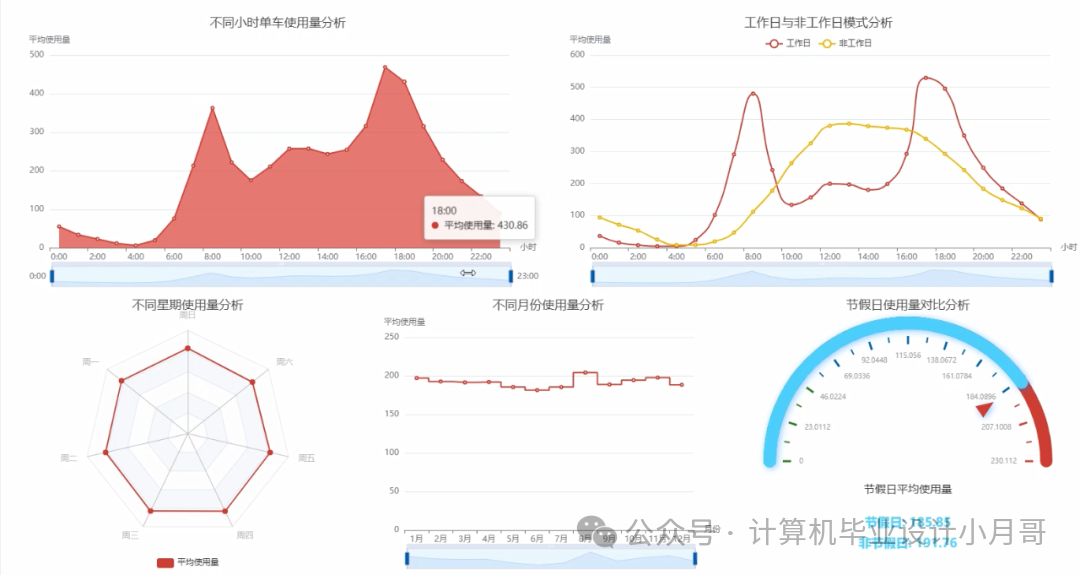 Time Dimension Analysis
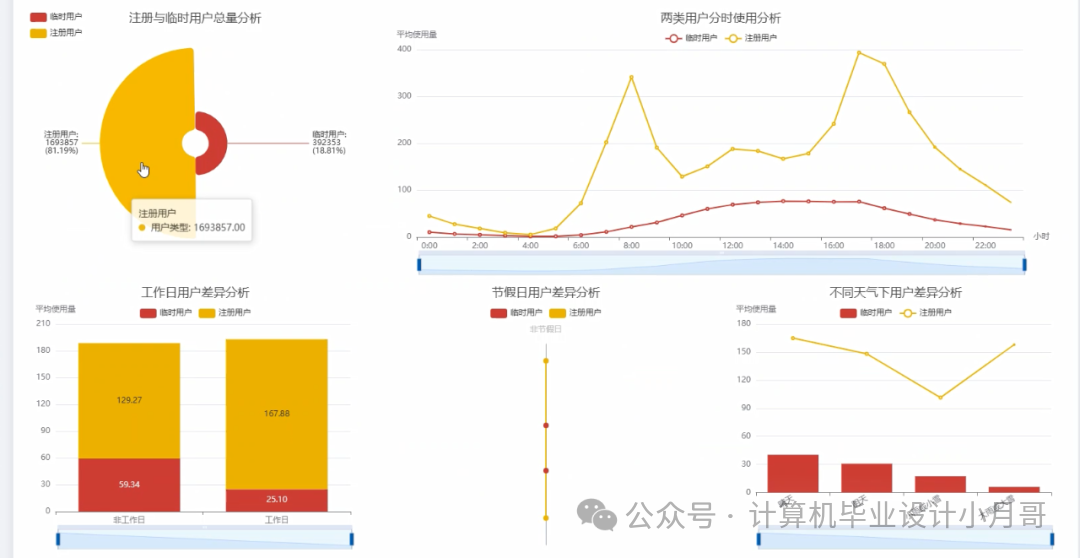 User Behavior Analysis
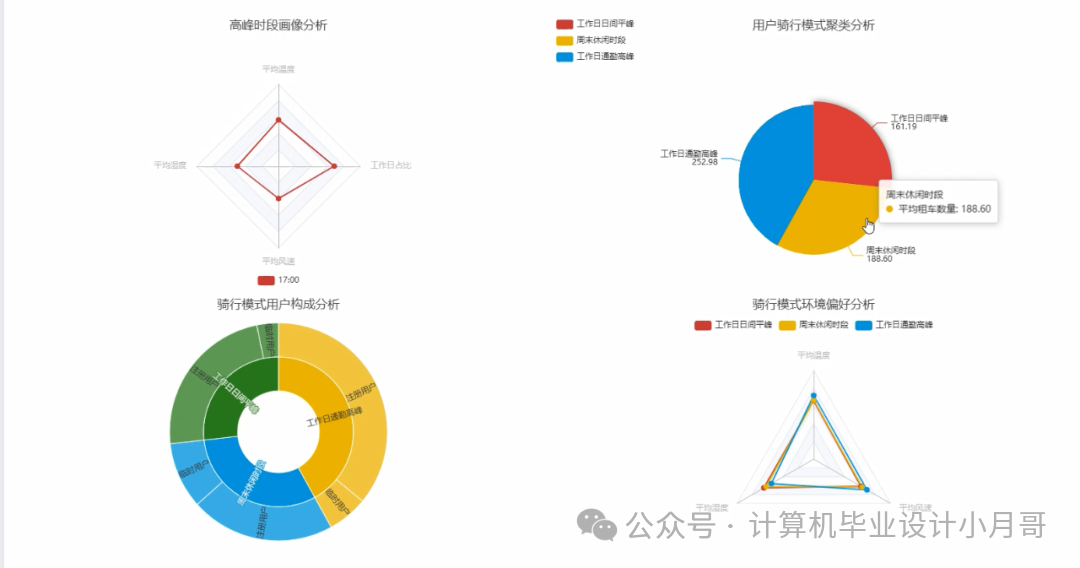 Comprehensive Demand AnalysisData Analysis and Visualization System for Shared Bicycles Based on Big Data– Code Presentation
from pyspark.sql import SparkSession
from pyspark.sql.functions import col, hour, sum as _sum, avg, when, round as _round, to_timestamp
from pyspark.ml.feature import VectorAssembler
from pyspark.ml.clustering import KMeans

spark = SparkSession.builder.appName("BikeDataAnalysis").getOrCreate()
df = spark.read.csv("hdfs://your_path/bike.csv", header=True, inferSchema=True)
df = df.withColumn("Datetime", to_timestamp(col("Datetime"), "yyyy/MM/dd HH:mm"))

# Core Function 1: Analysis of Bicycle Usage by Hour
hourly_usage_df = df.withColumn("hour_of_day", hour(col("Datetime")))
hourly_analysis = hourly_usage_df.groupBy("hour_of_day").agg(_sum("Count").alias("total_count")).orderBy("hour_of_day")
hourly_analysis = hourly_analysis.withColumn("total_count", _round(col("total_count"), 2))
hourly_analysis.toPandas().to_csv("hourly_usage_analysis.csv", index=False)

# Core Function 2: Comparison of Registered and Casual Users
user_type_df = df.agg(_sum("Casual").alias("total_casual"), _sum("Registered").alias("total_registered"))
user_type_df = user_type_df.withColumn("total_casual", _round(col("total_casual"), 2))
user_type_df = user_type_df.withColumn("total_registered", _round(col("total_registered"), 2))
user_type_df.toPandas().to_csv("user_type_comparison_analysis.csv", index=False)

# Core Function 3: Clustering Analysis of User Riding Patterns
cluster_df = df.withColumn("hour", hour(col("Datetime"))).withColumn("weekday", (col("Datetime").cast("long") % 7 + 1).cast("int"))
assembler = VectorAssembler(inputCols=["hour", "weekday", "Count"], outputCol="features")
cluster_data = assembler.transform(cluster_df).select("features")
kmeans = KMeans(k=4, seed=1)
model = kmeans.fit(cluster_data)
predictions = model.transform(cluster_data)
clustered_data = assembler.transform(df).join(predictions.withColumnRenamed("features", "cluster_features"), "features")
cluster_profile = clustered_data.groupBy("prediction").agg(avg(col("hour")).alias("avg_hour"), avg(col("weekday")).alias("avg_weekday"))
cluster_profile = cluster_profile.withColumn("description", when((col("avg_hour") >= 7) && (col("avg_hour") <= 9) | (col("avg_hour") >= 17) && (col("avg_hour") <= 19), "Weekday Commuting Peak").when((col("avg_hour") >= 10) && (col("avg_hour") <= 16), "Daytime Leisure Riding").otherwise("Other Riding Times"))
cluster_profile.toPandas().to_csv("riding_pattern_cluster_analysis.csv", index=False)
Data Analysis and Visualization System for Shared Bicycles Based on Big Data– ConclusionEND

Long press to scan the code to follow