Background
This series of articles is based on the TMF Catalyst project initiated by American telecom giant Verizon, British Telecom BT Group, and UAE Telecom Etisalat: Unleash the potential of GenAI-powered 5G network slicing.
As the commercial deployment of 5G deepens, network slicing, as a core technology, provides customized network services for vertical industries (such as smart ports, ultra-high-definition live broadcasting, and autonomous driving). However, ensuring end-to-end SLA for these slices is a significant challenge. Traditional NOCs (Network Operation Centers) rely on domain-segmented, static threshold-based monitoring systems, leading to alarm storms, slow fault localization, and inefficient cross-team communication, making it difficult to meet dynamic and stringent SLA requirements.
A previous article by the author (Part I: Top-Level Design) deeply analyzed a highly challenging scenario—dynamic QoS assurance for eMBB slices during large sports events, and proposed a solution that aligns closely with the concept of “self-intelligent networks.” It elaborated on how to adopt a new AI+OSS paradigm, with a large language model (LLM) as the “cognitive core,” and four specialized AI agents working collaboratively to achieve a revolutionary transformation from passive “fault repair” to proactive, autonomous “experience assurance,” ultimately paving the way for the large-scale commercial implementation of 5G slicing.
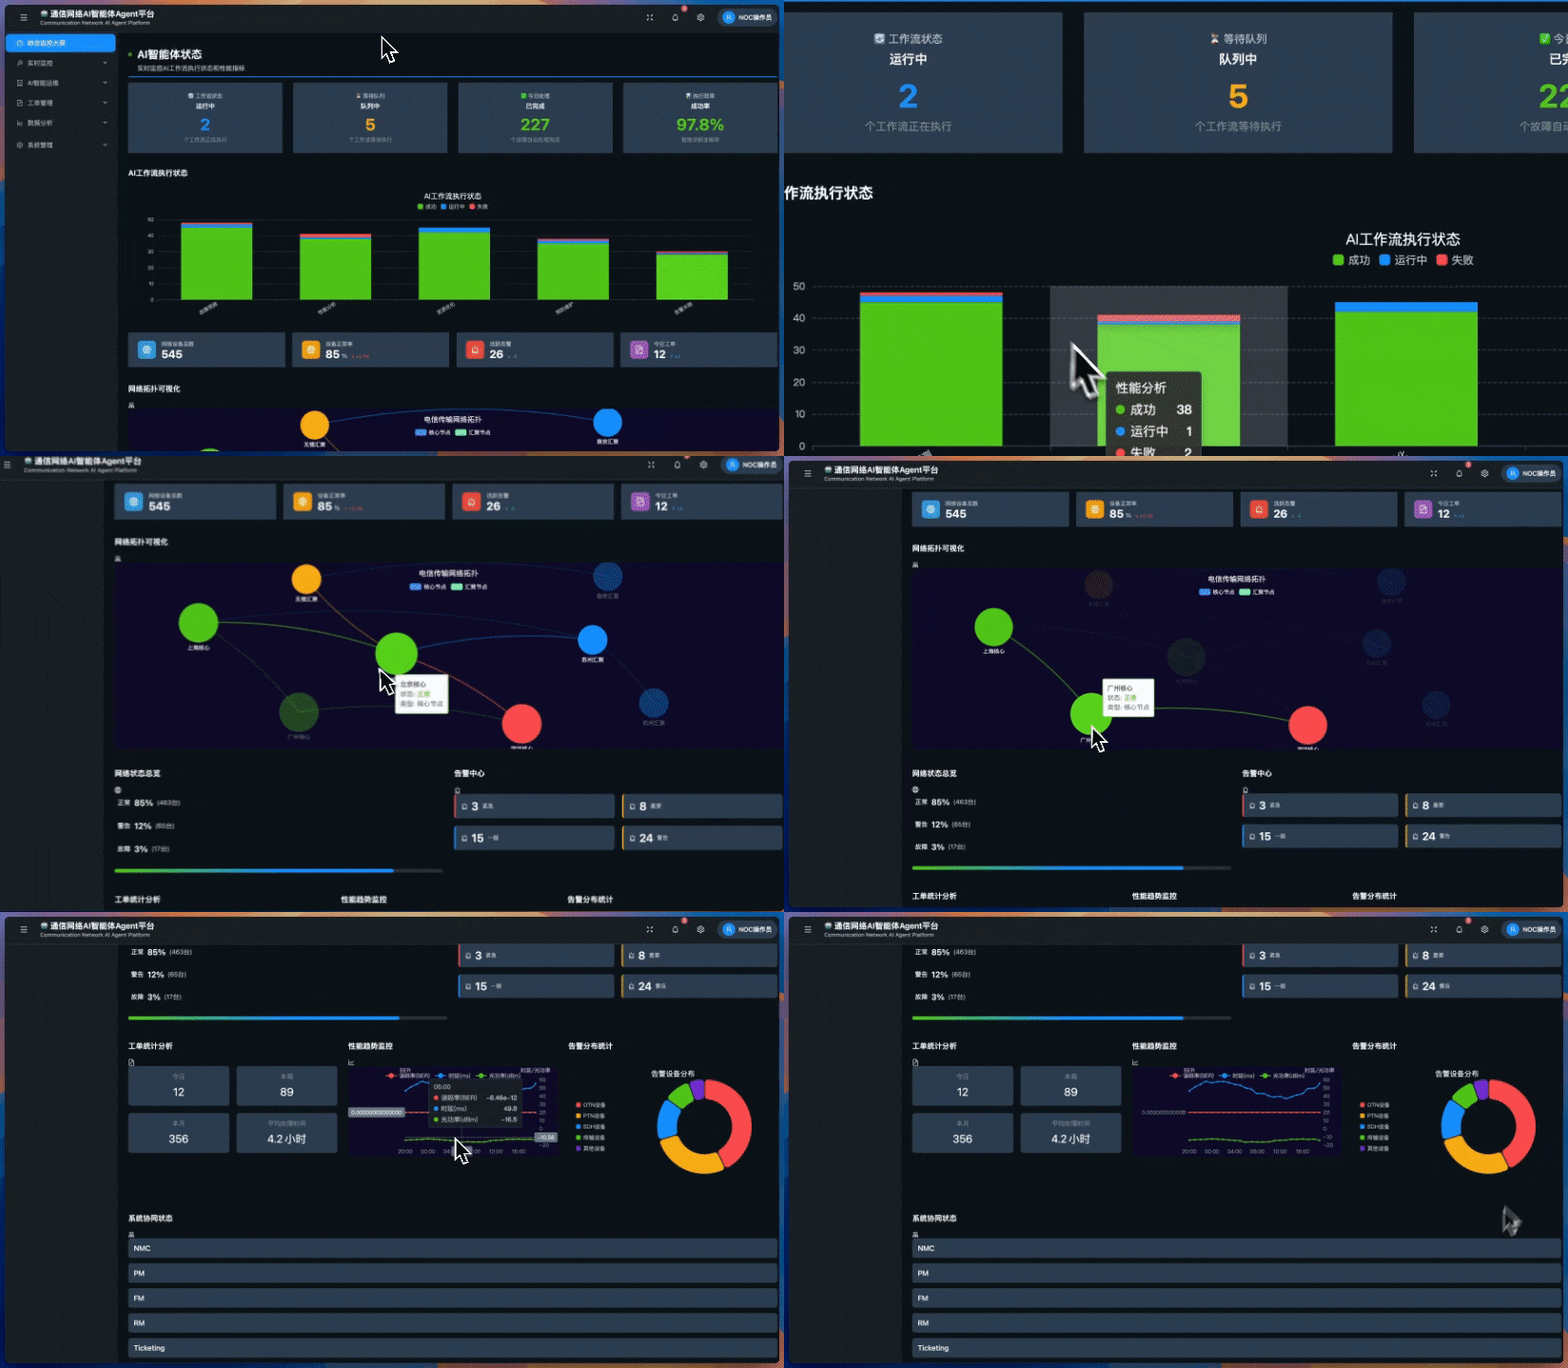
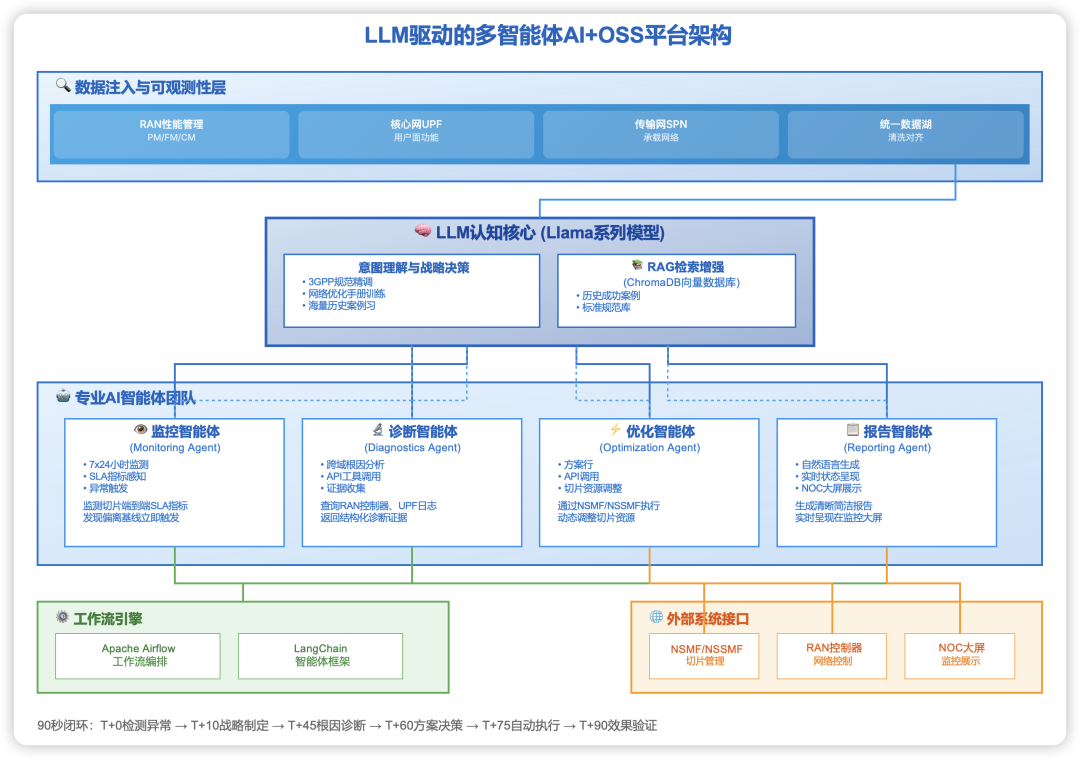
- 1. Monitoring Agent (Monitoring Agent): Responsible for 24/7 uninterrupted monitoring of network slice performance and SLA metrics, serving as the team’s “sentinel.”【The agent to be implemented in this article】
- 2. Diagnostics Agent (Diagnostics Agent): Responsible for cross-system and cross-domain data querying and correlation analysis upon receiving alerts to identify the root cause of issues, serving as the team’s “detective.”
- 3. Optimization Agent (Optimization Agent): Responsible for executing specific network adjustment operations (such as resource scheduling and configuration changes) based on diagnostic conclusions and LLM-approved plans, serving as the team’s “engineer.”
- 4. Reporting Agent (Reporting Agent): Responsible for reporting the entire event handling process and results to human experts in natural language, serving as the team’s “communicator.”
This article builds a set of Monitoring Agents and AIOps services for the SLA assurance scenario of 5G network slices based on the Agent platform and RAG knowledge base.
This Monitoring Agent can actively, intelligently, and quickly discover and initially diagnose potential SLA risks, which is crucial for ensuring service quality, enhancing customer satisfaction, and realizing the commercial value of 5G.
AI large models are profoundly transforming telecom network operations and maintenance. Their powerful perception, understanding, and reasoning capabilities can process heterogeneous big data from multiple domains in real-time, achieving intelligent monitoring and analysis of network performance, faults, and service quality throughout the entire process.
In 5G network operations and maintenance, AI large models can be used for intelligent alarm noise reduction, root cause analysis (RCA), performance trend prediction, resource optimization scheduling, etc., significantly improving network availability and mean time between failures (MTBF).
In the OSS field, large models excel at understanding the natural language intentions of operations personnel and can construct network knowledge graphs, supporting cross-system data fusion, intelligent Q&A, decision support, and automated operations script generation, accelerating the transformation from “data” to “insight” to “action.”
Especially when dealing with complex, cross-domain, unstructured fault information, large models break the limitations of traditional rule-based automation tools, providing solid support for achieving highly autonomous networks.
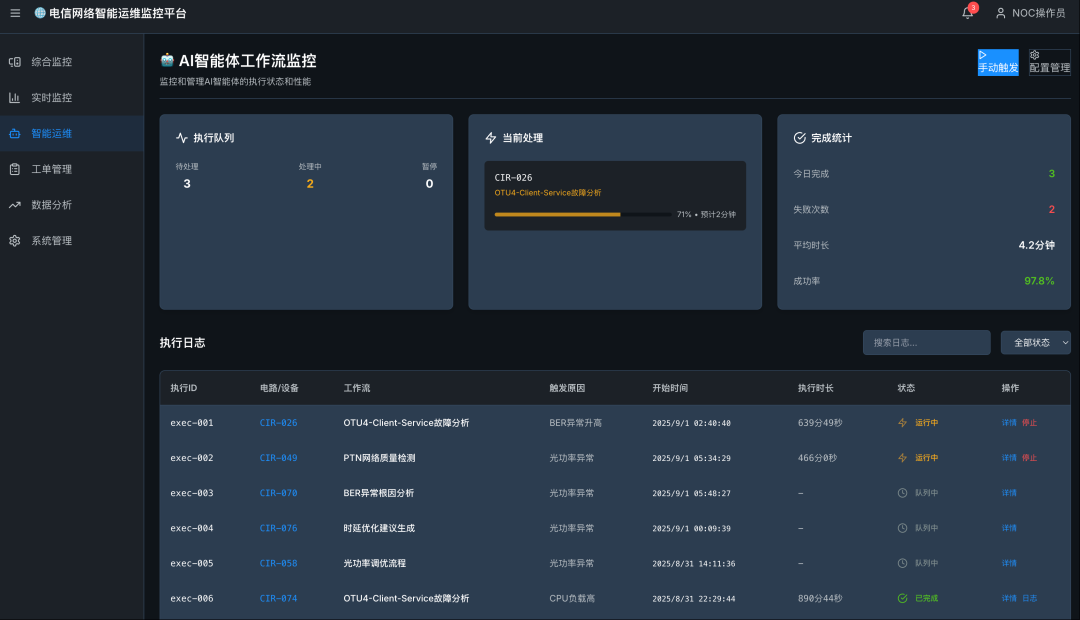
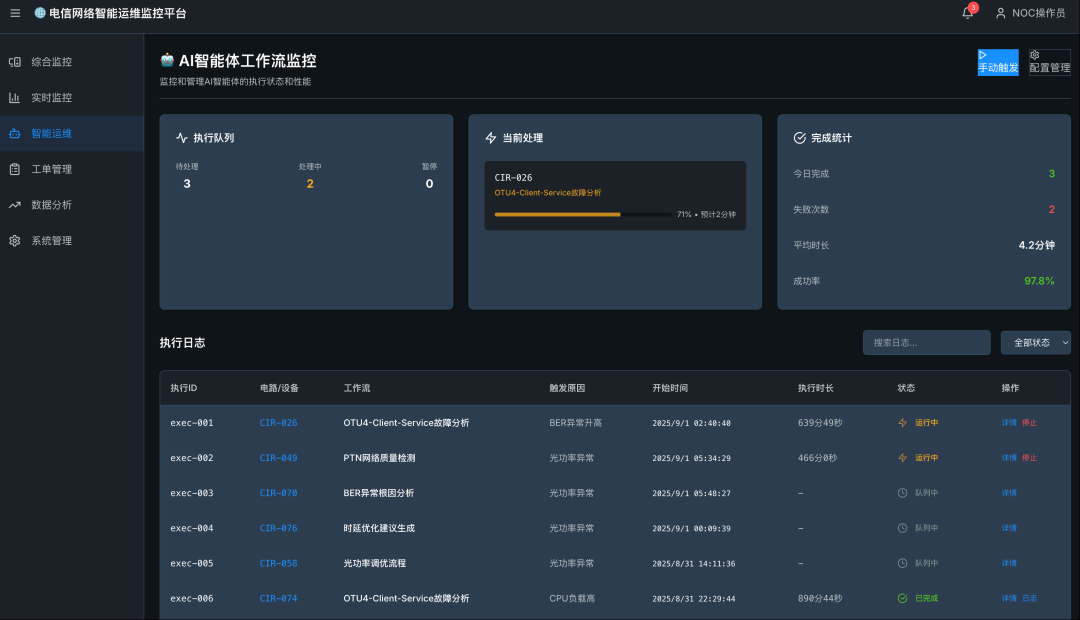
This case involves five core telecom operation support systems (OSS): Observability Platform, Orchestrator, Fault Management System (FM), Resource Management System (RM), and RAG Knowledge Base (RAGKB).
1. Scenario Description

Monitoring Object: eMBB Network Slice Instance (NSI-eMBB-Stadium-01)
1. Slice Type and Identifier
- • Type: Enhanced Mobile Broadband (eMBB)
- • Service Scenario: Live broadcasting in large sports venues
- • Slice Instance ID: NSI-eMBB-Stadium-01
- • Associated S-NSSAI:
<span>{"sst": 1, "sd": "00A1B2"}</span>
Why choose it?
- • High Commercial Value: Such scenarios are typical representatives of 5G toC/toB services, and SLA assurance directly relates to the operator’s brand reputation and revenue.
- • Rich and Complex Data: Involves multi-domain data from RAN, transport, and core networks, making it an ideal “testbed” for AIOps cross-domain analysis capabilities.
- • Diverse Fault Modes: Performance issues may arise from various causes such as coverage, capacity, interference, and congestion, requiring high intelligent diagnostic capabilities.
2. Business Scenario (Sports Event Live Broadcasting)
- • Business Type: 4K ultra-high-definition video streaming
- • User Behavior: A large number of users concurrently access high-bandwidth services in a concentrated area at a similar time.
- • Core SLA Requirements:
- • Downlink Throughput: > 100 Mbps
- • End-to-End Latency: < 20 ms
- • Packet Loss Rate: < 10^-5
- • Availability: 99.99%
3. Key Monitoring Parameters
These are the metrics that the AIOps platform needs to focus on collecting and analyzing, and their trend changes are the direct basis for intelligently assessing SLA health.
| Network Domain | Category | Key Monitoring Parameter | Unit | Normal Range (Example) | Abnormal Indication (Potential Issues) |
|---|---|---|---|---|---|
| RAN | Capacity | PRB Utilization (PRB Utilization) | % | < 80% | Persistently High (>90%): Wireless side congestion, insufficient capacity. |
| Quality | Average SINR (Signal to Interference plus Noise Ratio) | dB | > 15 | Persistently Low (< 5dB): Severe interference, possibly caused by PCI conflicts or external interference. | |
| Average RSRP (Reference Signal Received Power) | dBm | > -95 | Persistently Low (< -105dBm): Coverage holes or weak coverage issues. | ||
| Mobility | Handover Success Rate (Handover Success Rate) | % | > 99% | Decreased: Neighbor relationship configuration issues, unreasonable handover parameters. | |
| Transport Network | Performance | End-to-End Latency (End-to-End Latency) | ms | < 15 | Increased: Transport link congestion, overly long routing paths. |
| Jitter | ms | < 5 | Increased: Bottlenecks in transport device processing capacity, congestion. | ||
| Packet Loss Rate (Packet Loss Rate) | % | < 0.001% | Increased: Link quality issues, device failures, congestion. | ||
| Core Network (5GC) | Performance | UPF Downlink Throughput (UPF Downlink Throughput) | Gbps | Stable | Sharp Decline or Fluctuation: UPF overload, N6 exit congestion. |
| Session | PDU Session Success Rate (PDU Session Success Rate) | % | > 99.9% | Decreased: SMF/AMF signaling issues, user data issues. | |
| E2E Slice | Service | Slice Downlink Rate (Slice Downlink Rate) | Mbps | > 100 | Below SLA Commitment: Bottlenecks exist in the end-to-end link. |
| Video Stall Rate (Video Stall Rate) (via DPI) | % | < 1% | Increased: The most direct indicator of deteriorating user experience. |
By continuously and multidimensionally monitoring this eMBB network slice instance, our AI monitoring agent can capture subtle signs of performance degradation before its SLA experiences substantial deterioration, achieving a shift from passive alerts to proactive predictions.
2. On-Site Situation
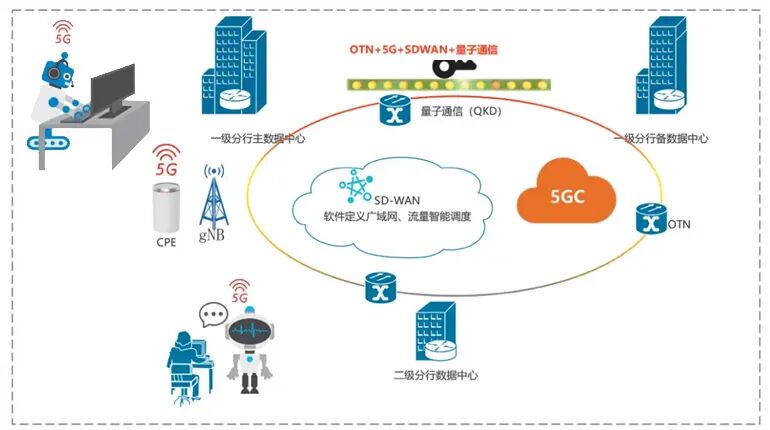
A provincial operator’s NOC is responsible for monitoring the 5G network in a certain city. The network is divided into three major domains: Radio Access Network (RAN), Transport Network (TN), and 5G Core Network (5GC), each with its own network management system (NMS/EMS) and performance monitoring tools. All data is ultimately aggregated into a unified OSS system.
- • Data Sources:
- • RAN: RAN controllers (OMC-R) in various cities report cell-level KPI data every 15 minutes.
- • Transport Network: SPN/OTN network management systems report link performance data every 5 minutes.
- • Core Network: 5GC network function elements report transaction-level signaling data and performance counters in near real-time.
- • Current Pain Points:
- • Data Silos: The data models and monitoring interfaces of RAN, transport, and core networks are completely independent.
- • Static Thresholds: Alarm thresholds are set coarsely, unable to adapt to business tidal effects, leading to alarm storms during the day and missed reports at night.
- • Manual Correlation: When users complain about video stalling, it requires frontline NOC, wireless experts, transport experts, and core network experts to investigate together, which is inefficient.
The goal of this case is to break down data silos through AI monitoring agents, achieving intelligent, automated cross-domain data correlation and anomaly detection.
3. System Architecture
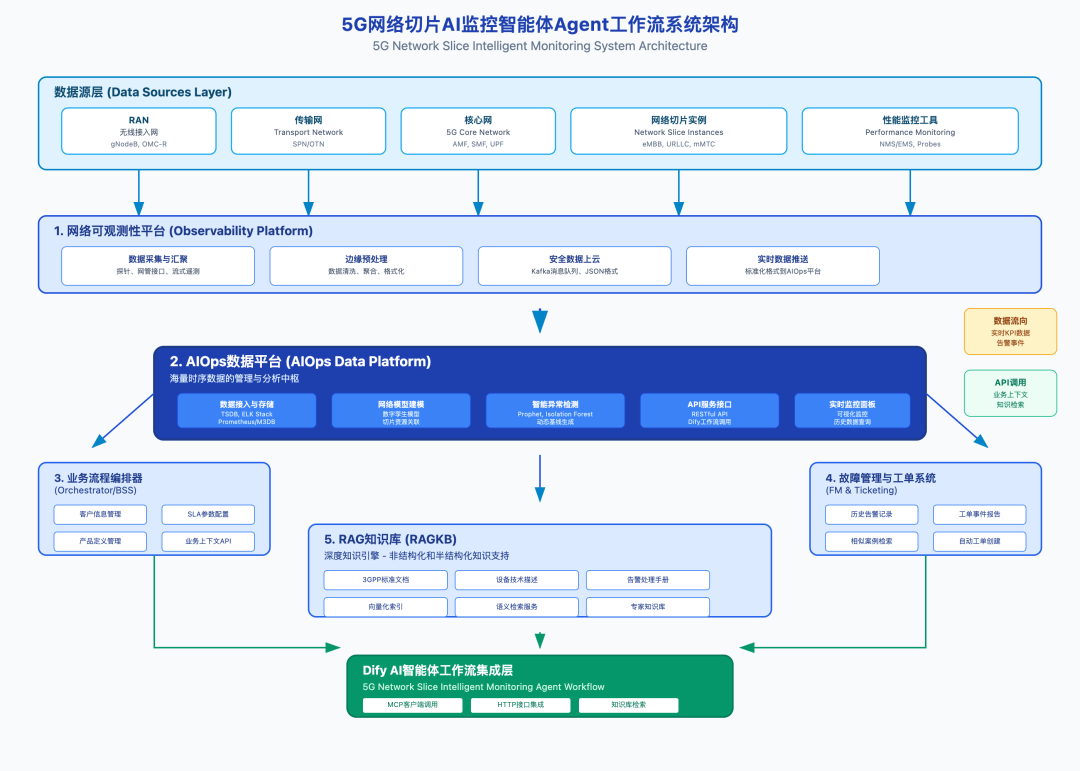
For the 5G network slice monitoring scenario in this case, to guide the design of the Agent workflow discussed later, we define the following five core systems.
1. Observability Platform
As the data collection nerve terminal, it is responsible for collecting massive, heterogeneous telemetry data from physical and virtual network functions, serving as the data foundation for AIOps.
- • Data Collection and Aggregation:
- • Through probes, network management interfaces (NMS/EMS), and streaming telemetry, collect performance indicators (KPIs), events, logs, and signaling data from RAN, transport, and core networks.
- • Edge Preprocessing: Perform initial data cleaning, aggregation, and formatting close to the data source to alleviate pressure on the central platform.
- • Secure Data Upload to Cloud: Collected data is pushed to the AIOps Data Platform securely and in real-time via message queues like Kafka, in standardized formats (e.g., JSON).
2. AIOps Data Platform
As the management and analysis hub for massive time-series data, it is responsible for the entire process from data access to initial insights, providing high-quality data services for upper-layer AI agents.
- • Data Access and Storage: Receives data streams from the observability platform, parses, and stores them in time-series databases (TSDB, such as Prometheus/M3DB) and log storage (e.g., ELK Stack).
- • Network Modeling and Data Modeling: Establishes a digital twin model of the network slice instance (NSI), associating discrete KPI data with specific slices, network functions, and physical resources to form a structured network data view.
- • Dynamic Baselines and Anomaly Detection:
- • Provides real-time visual monitoring dashboards for network status and historical data query functions.
- • Utilizes machine learning algorithms (e.g., Prophet, Isolation Forest) to automatically generate dynamic baselines for each KPI and perform intelligent anomaly detection.
- • Provides Core APIs for AI Monitoring Agents: Exposes standardized RESTful API interfaces, allowing Dify workflows to query historical and real-time KPI data for specified slices by slice ID and time range. This is the key entry point for triggering monitoring and diagnostic processes.
3. Orchestrator
As the bridge between business and network, it provides crucial business context for AI monitoring, helping to assess the business impact of technical anomalies.
- • Provides Business Context Data: When the monitoring process is initiated, the orchestrator provides business information associated with the slice instance to the Dify workflow via API:
- • Customer Information: Customer name, industry, importance level.
- • SLA Parameters: Key performance indicators (latency, bandwidth, reliability, etc.) promised by the slice.
- • Product Definition: Name and level of the slice product (e.g., “Gold Medal Event Live Slice”).
4. Fault Management and Ticketing System
As the historical record center for network events and operational activities, it provides valuable historical experience for AI diagnostics.
- • Operational Knowledge Base:
- • Historical Alarm Records: Provides historical alarm data related to the network functions (NFs) that constitute the slice.
- • Historical Work Orders/Incident Reports: Records descriptions of similar historical issues, root causes, solutions, and repair durations.
- • Serves the Monitoring Process:
- • Through API interfaces, provides the above historical data to the Dify workflow, offering historical similar cases for AI diagnostics.
- • Receives the “preliminary diagnostic report” generated by the Dify workflow, and can automatically create level-one alarms or work orders, dispatching them to the corresponding operational teams.
5. RAG Knowledge Base
As a deep knowledge engine for unstructured and semi-structured knowledge, RAGKB provides expert-level knowledge support for AI diagnostics beyond structured data.
- • Knowledge Storage and Vectorization:
- • Stores massive technical documents, such as: 3GPP standards (TS 23.501, 28.541, etc.), product technical descriptions, alarm handling manuals provided by equipment vendors, and internal expert-written network optimization guidelines.
- • Utilizes tools like RAGFlow to slice, clean, and generate high-quality vectorized indexes for these documents.
- • Provides Semantic Search Services:
- • When the Dify workflow queries specific anomaly phenomena (e.g., “PDU session establishment success rate decline”), RAGKB can accurately find the most relevant paragraphs from massive documents.
- • For example, it can return detailed descriptions of the reasons for PDU session establishment failures from 3GPP TS 23.501, or official handling suggestions for specific alarms from the alarm handling manual, providing authoritative basis for the LLM’s deep reasoning.
4. Technical Solution
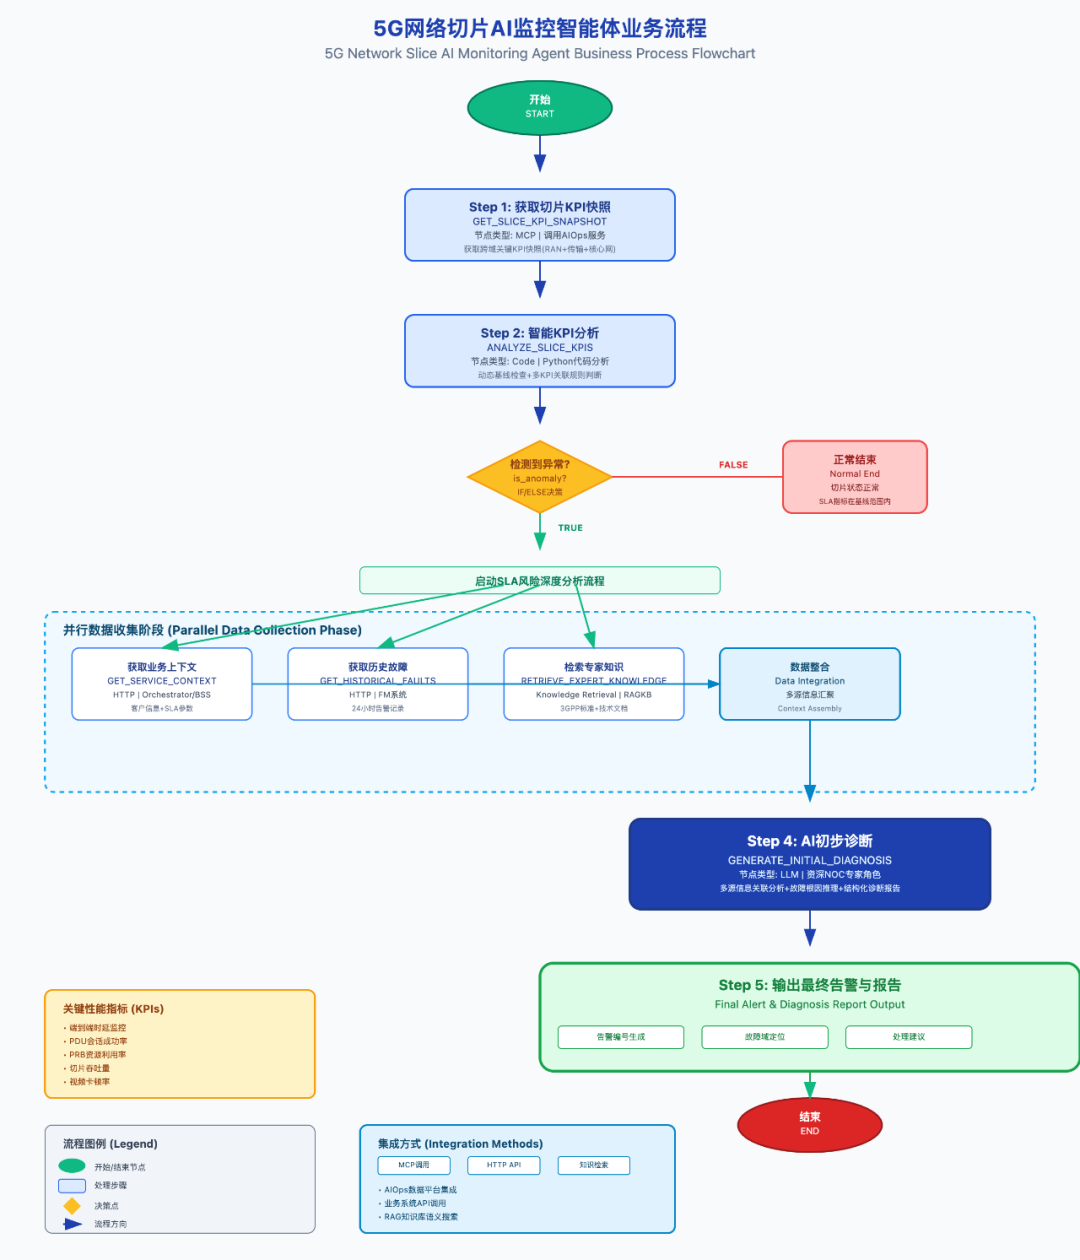
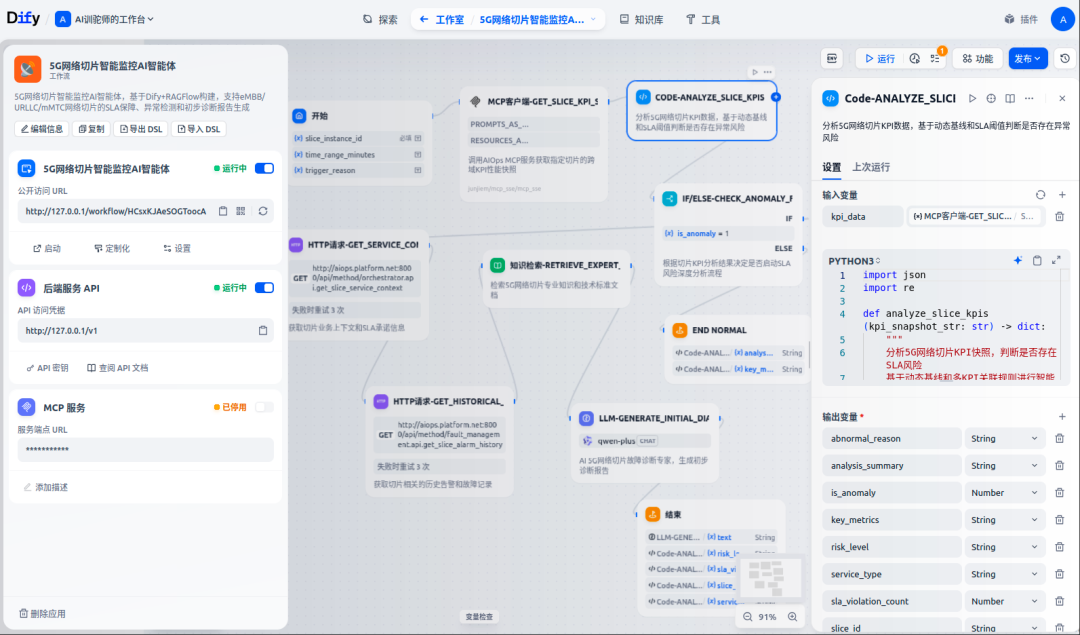
This case utilizes the powerful workflow orchestration capabilities of the AI agent platform to construct an end-to-end intelligent monitoring process for 5G network slices. Its core idea follows the classic AIOps paradigm: Intelligent Monitoring -> Context Enrichment -> AI Analysis -> Decision Output.
To efficiently integrate with complex OSS systems, this solution adopts a hybrid calling model:
- • MCP Mode: The AIOps service developed from scratch encapsulates the complex logic of querying and processing multi-domain, massive KPI time-series data from the AIOps data platform. The Dify workflow can obtain an aggregated, aligned slice health snapshot by calling the
<span>get_slice_kpi_snapshot</span>interface of the MCP service. - • HTTP Mode: Used for direct and efficient data exchange with systems providing standard RESTful APIs (e.g., Orchestrator, FM).
- • Built-in Knowledge Base Retrieval: Used for semantic queries with RAGKB.
Step 1: Obtain the KPI Snapshot of the Specified Slice
- • Node Type: MCP
- • Node Name:
<span>GET_SLICE_KPI_SNAPSHOT</span> - • Function: Calls the AIOps MCP service’s
<span>get_slice_kpi_snapshot</span>interface. This service queries the cross-domain key KPI snapshot of the slice at a specified time point from the time-series database of the AIOps data platform based on the input<span>slice_instance_id</span>. The MCP service performs data cleaning, correlation, and preliminary calculations in the background, returning a structured JSON object to Dify.
Step 2: Intelligent Judgment of SLA Risk
- • Node Type: Code
- • Node Name:
<span>ANALYZE_SLICE_KPIS</span> - • Function: This Python code node receives the KPI data returned from the previous step. It embeds dynamic baselines and multi-KPI correlation rules. For example, it checks whether “end-to-end latency exceeds two standard deviations of the dynamic baseline” and “PDU session establishment success rate is below 99.9%.” It outputs a boolean flag
<span>is_anomaly</span>and a brief anomaly description. This is the “intelligent sentinel” of the workflow, effectively filtering out single, uncorrelated metric fluctuations and focusing on truly potentially risky events.
Step 3: Process Diversion Based on Judgment Results
- • Node Type: IF/ELSE
- • Node Name:
<span>CHECK_ANOMALY_FLAG</span> - • Function: Decides the workflow direction based on the
<span>ANALYZE_SLICE_KPIS</span>output flag<span>is_anomaly</span>.
Step 3.1: IF Branch (is_anomaly == true) – Initiate SLA Risk Deep Analysis Process
- 1. Obtain Business and SLA Context:
- • Node Type: HTTP
- • Node Name:
<span>GET_SERVICE_CONTEXT</span> - • Function: Calls the API of the Orchestrator system, passing the slice ID to obtain customer information, product level, and detailed SLA commitment values for that slice.
- • Node Type: HTTP
- • Node Name:
<span>GET_HISTORICAL_FAULTS</span> - • Function: Calls the API of the FM system to obtain relevant alarms and historical fault orders for the network functions (NFs) constituting the slice within the past 24 hours.
- • Node Type: Knowledge Retrieval
- • Node Name:
<span>RETRIEVE_EXPERT_KNOWLEDGE</span> - • Function: Uses the anomaly phenomena identified by
<span>ANALYZE_SLICE_KPIS</span>(e.g., “URLLC slice latency exceeded”) as a query to perform semantic retrieval from the RAGKB knowledge base, finding relevant technical explanations and handling suggestions from 3GPP standards, device manuals, and optimization cases.
- • Node Type: LLM
- • Node Name:
<span>GENERATE_INITIAL_DIAGNOSIS</span> - • Function: This is the core AI reasoning node. It receives and integrates data from all previous nodes: real-time anomaly KPIs, SLA requirements, historical alarms, expert knowledge. Under the guidance of a carefully designed prompt template, the LLM acts as a “senior NOC expert,” performing multi-source information correlation analysis, reasoning out the most likely fault domain and root cause, and generating a structured preliminary diagnostic report.
- • Node Type: End
- • Function: Displays the complete report generated by
<span>GENERATE_INITIAL_DIAGNOSIS</span>, serving as the final outcome of this intelligent monitoring process.
Step 3.2: ELSE Branch (is_anomaly == false) – Process Ends Normally
- 1. Output Normal Status:
- • Node Type: End
- • Function: Returns information such as “Slice ID: NSI-eMBB-Stadium-01 status normal, SLA metrics within baseline range,” and ends the workflow.
5. Example of 5G Network Slice Anomaly Alarm and Preliminary Diagnostic Report
1. Alarm Information
- • Alarm ID:
<span>AIOps-ALERT-NSI-eMBB-Stadium-01-dfc2a198</span> - • Slice ID:
<span>NSI-eMBB-Stadium-01</span> - • Priority Level: High
2. Anomaly Summary
On 2025-08-13 20:30 UTC, the AI monitoring agent detected multiple key performance indicators of the eMBB slice NSI-eMBB-Stadium-01 serving the large sports event deteriorating in coordination, posing a high risk of SLA violation.
- • Core Issue: End-to-end latency sharply increased, while the PDU session establishment success rate significantly decreased.
- • Business Impact: This may lead to stalling and buffering of 4K live broadcasts for a large number of on-site viewers, AR applications failing to load, severely affecting user experience.
3. Key Metrics Evidence
| Metric | Current Value | Dynamic Baseline | Deviation | Status |
|---|---|---|---|---|
| Average E2E Slice Latency | 35 ms | 12 ms (±3 ms) | +192% | Severe Alarm |
| PDU Session Establishment Success Rate | 99.85% | 99.98% | -0.13% | Major Alarm |
| RAN PRB Utilization (Related Cell) | 95% | 70% | +35% | Warning |
| UPF Downlink Throughput | 4.8 Gbps | 5.0 Gbps | -4% | Normal |
4. AI Preliminary Diagnosis
Root Cause Hypothesis: Comprehensive analysis suggests that the root cause is likely (Confidence: 85%) due to RAN-side wireless resource congestion, rather than bottlenecks in the core or transport networks.
Chain of Thought:
- 1. Symptom Observation: Detected simultaneous deterioration of end-to-end latency (35ms) and PDU session success rate (99.85%).
- 2. Context Correlation:
- • Business Context (Orchestrator): Query reveals that this slice is a “Gold Medal Event Live Slice,” with SLA requirements of latency < 20ms and success rate > 99.95%. Current metrics clearly violate SLA.
- • Historical Alarms (FM): Within the past hour, the associated gNodeB (base station) for this slice has issued three minor alarms for “severe PRB resource congestion,” but they were not escalated.
- • Retrieved 3GPP TS 23.501 standards, confirming that PDU session establishment failures may relate to AMF’s inability to allocate resources or gNodeB rejecting access.
- • Retrieved the “5G Network Optimization Manual,” indicating that simultaneous deterioration of latency and session success rate in large gathering scenarios typically points to wireless air interface congestion.
- • Excluding Core Network: UPF throughput is stable, with no performance alarms, and core network metrics are normal.
- • Excluding Transport Network: Transport network monitoring shows link latency, jitter, and packet loss rates are all within normal ranges.
- • Confirming RAN Side: RAN PRB utilization is as high as 95%, far exceeding the dynamic baseline, consistent with historical alarm records, and highly correlated with SLA deterioration in timing.
5. Recommended Actions
- • Immediate Actions:
- 1. Initiate Deep Diagnosis: It is recommended to immediately dispatch the
<span>AI Diagnostics Agent</span>to conduct a deep analysis of the affected gNodeB cell cluster to confirm the specific cause of congestion (whether due to excessive users or high single-user traffic). - 2. Notify Relevant Teams: Automatically send this report to the RAN optimization team and VIP customer assurance team.
- • If confirmed as a capacity issue, the
<span>AI Optimization Agent</span>can prepare to execute predefined plans such as “dynamic spectrum sharing” or “adjusting slice resource reservation ratios.”
Report Generated By: AI Trainer – Monitoring Agent
Generation Time: 2025-02-13 20:31 UTC
6. System Extension Functions
- • Integrated Diagnostics Agent: The output of this monitoring agent can serve as input for the Diagnostics Agent, automatically triggering deeper root cause localization processes.
- • Automated Work Order Creation: The generated diagnostic report can be pushed to the fault management or ticketing system (e.g., ServiceNow) via API, automatically creating work orders with extended context information.
- • Closed-Loop Optimization: For high-confidence simple faults (e.g., specific software bugs), it can directly trigger the Optimization Agent to execute predefined repair actions such as restart or configuration rollback, achieving lightweight closed-loop self-healing.
- • NOC Dashboard Integration: Real-time push of diagnostic reports to the NOC monitoring dashboard, providing operational personnel with global situational awareness and decision support.
7. Data Structures Involved in the Case
AIOps Data Platform – Slice KPI Time-Series Data Structure
Description: Defines the format of a single slice KPI record stored in the AIOps platform’s time-series database.
| Field Name | 中文名称 | Data Type | Comment |
|---|---|---|---|
<span>timestamp</span> |
时间戳 | <span>Timestamp</span> |
Data collection timestamp. |
<span>SliceID</span> |
切片实例ID | <span>String</span> |
Unique identifier for the network slice instance, e.g., “NSI-eMBB-Stadium-01”. |
<span>KPIType</span> |
KPI类型 | <span>String</span> (Enum) |
<span>RAN</span>, <span>Transport</span>, <span>Core</span>, <span>E2E</span> |
<span>KPIName</span> |
KPI名称 | <span>String</span> |
For example, “PRB_Utilization”, “E2E_Latency_ms” |
<span>KPIValue</span> |
KPI值 | <span>Float</span> |
The value of the KPI at the current time point. |
<span>NetworkElementID</span> |
网元ID | <span>String</span> |
Specific network function or device ID that generated the KPI (optional). |
<span>Location</span> |
位置信息 | <span>GeoJSON</span> |
Geographical location information of the KPI (optional, mainly for RAN). |
-- InfluxDB/Prometheus-like data model representation
CREATE MEASUREMENT slice_kpis (
    timestamp TIMESTAMPTZ,
    SliceID TAG,
    KPIType TAG,
    KPIName TAG,
    NetworkElementID TAG,
    Location TAG,
    KPIValue FIELD
);
Orchestrator – Slice Service Definition Data Structure
Description: Defines the business attributes and SLA commitments of the slice.
| Field Name | 中文名称 | Data Type | Comment |
|---|---|---|---|
<span>SliceID</span> |
切片实例ID | <span>String</span> |
Primary key. |
<span>CustomerID</span> |
客户ID | <span>String</span> |
Customer ID who ordered the slice. |
<span>ProductName</span> |
产品名称 | <span>String</span> |
e.g., “Gold Medal Event Live Slice”. |
<span>ServiceType</span> |
服务类型 | <span>String</span> (Enum) |
<span>eMBB</span>, <span>URLLC</span>, <span>mMTC</span>. |
<span>SLAParameters</span> |
SLA参数 | <span>JSON</span> |
JSON object containing specific SLA commitment values, e.g., <span>{"latency_ms": 20, "downlink_mbps": 100}</span>. |
CREATE TABLE `tabSliceServiceDefinition` (
  `name` varchar(140) NOT NULL,
  `creation` datetime(6) DEFAULT NULL,
  `modified` datetime(6) DEFAULT NULL,
  `SliceID` varchar(140) DEFAULT NULL,
  `CustomerID` varchar(140) DEFAULT NULL,
  `ProductName` varchar(140) DEFAULT NULL,
  `ServiceType` varchar(140) DEFAULT NULL,
  `SLAParameters` json DEFAULT NULL,
  PRIMARY KEY (`name`),
  UNIQUE KEY `slice_id_unique` (`SliceID`)
) ENGINE=InnoDB;
Fault Management System (FM) – Alarm Data Structure
Description: Defines a standardized network alarm record.
| Field Name | 中文名称 | Data Type | Comment |
|---|---|---|---|
<span>AlertID</span> |
告警ID | <span>String</span> |
Unique alarm identifier. |
<span>Timestamp</span> |
时间戳 | <span>Timestamp</span> |
Time when the alarm occurred. |
<span>NetworkElementID</span> |
网元ID | <span>String</span> |
ID of the device or network function that generated the alarm. |
<span>Severity</span> |
严重等级 | <span>String</span> (Enum) |
<span>Critical</span>, <span>Major</span>, <span>Minor</span>, <span>Warning</span> |
<span>ProbableCause</span> |
可能原因 | <span>String</span> |
Standardized fault cause description, e.g., “PRB Congestion”. |
<span>Status</span> |
状态 | <span>String</span> (Enum) |
<span>Active</span>, <span>Cleared</span>. |
<span>RelatedSlices</span> |
关联切片 | <span>Array[String]</span> |
List of slice IDs that may be affected by this alarm. |
CREATE TABLE `tabFaultManagementAlerts` (
  `name` varchar(140) NOT NULL,
  `creation` datetime(6) DEFAULT NULL,
  `modified` datetime(6) DEFAULT NULL,
  `AlertID` varchar(140) DEFAULT NULL,
  `Timestamp` datetime(6) DEFAULT NULL,
  `NetworkElementID` varchar(140) DEFAULT NULL,
  `Severity` varchar(140) DEFAULT NULL,
  `ProbableCause` text DEFAULT NULL,
  `Status` varchar(140) DEFAULT NULL,
  `RelatedSlices` json DEFAULT NULL,
  PRIMARY KEY (`name`),
  KEY `timestamp_idx` (`Timestamp`)
) ENGINE=InnoDB;
8. Case Source Code
Dify Workflow YAML Source Code
# dify-workflow-telecom-monitor.yml
# Follow this public account (AI Trainer) and send a private message to obtain this Dify workflow YAML source code.
Workflow Code Node Code (<span>Code-ANALYZE_SLICE_KPIS.py</span>)
import json

def analyze_slice_kpis(kpi_snapshot_str: str) -> dict:
    """
    Analyzes a snapshot of slice KPIs against dynamic baselines and correlation rules.
    """
    try:
        kpis = json.loads(kpi_snapshot_str)

        # Example rules: latency exceeds baseline and PDU success rate below threshold
        latency = kpis.get('e2e_latency_ms', {})
        pdu_sr = kpis.get('pdu_session_success_rate', {})

        is_latency_anomaly = latency.get('value', 0) > latency.get('baseline', 999) * 1.5
        is_pdu_anomaly = pdu_sr.get('value', 100) < 99.95

        is_anomaly = False
        reason_parts = []

        if is_latency_anomaly:
            reason_parts.append(f"End-to-end latency {latency.get('value')}ms exceeds baseline {latency.get('baseline')}ms")
        if is_pdu_anomaly:
            reason_parts.append(f"PDU session success rate {pdu_sr.get('value')}% below threshold 99.95%")

        if is_latency_anomaly and is_pdu_anomaly:
            is_anomaly = True

        return {
            "is_anomaly": 1 if is_anomaly else 0,
            "abnormal_reason": " and ".join(reason_parts) if is_anomaly else "SLA metrics are normal within baseline range."
        }
    except Exception as e:
        return {"is_anomaly": 0, "error": f"Error analyzing KPIs: {str(e)}"}

def main(kpi_data: str) -> dict:
    return analyze_slice_kpis(kpi_data)
Workflow Prompt (<span>Prompt-LLM-GENERATE_INITIAL_DIAGNOSIS.md</span>)
# Role and Goal
You are a Tier-3 5G Network Operations Expert with 15 years of experience, specializing in end-to-end slice performance troubleshooting. Your primary goal is to analyze multi-domain network data to provide a quick, accurate, and actionable initial diagnosis for SLA degradation events.

# Core Task
Synthesize the provided real-time data, business context, historical events, and expert knowledge to generate an "Initial Diagnosis Report". The report must identify the most probable root cause domain and provide a clear line of reasoning.

# Critical Output Constraint
Your output MUST be a well-structured Markdown report following the example format.

---
### Input Data Packet for Slice `{{#GET_SERVICE_CONTEXT.body.SliceID#}}`

#### 1. Real-time Anomaly Data (from AIOps Platform)
-**Triggering Reason**: {{#ANALYZE_SLICE_KPIS.abnormal_reason#}}
- **Key Metrics Snapshot**:
{{#GET_SLICE_KPI_SNAPSHOT.text#}}


#### 2. Business & SLA Context (from Orchestrator)
-**Customer & Product**:
{{#GET_SERVICE_CONTEXT.body#}}

#### 3. Historical Alarms & Incidents (from FM)
-**Recent Alarms**:
{{#GET_HISTORICAL_FAULTS.body#}}


#### 4. Expert Knowledge & Standards (from RAGKB)
-**Relevant Insights**:
{{#RETRIEVE_EXPERT_KNOWLEDGE.result#}}

---
### Your Task: Generate the Initial Diagnosis Report

Based on all the information above, perform a step-by-step analysis (Chain of Thought) and generate the report.
Dify Workflow External Interfaces
# Follow this public account (AI Trainer) and send a private message to obtain this Dify workflow YAML source code.Selected Previous Articles
(I) Top-Level Design: Practical Application of AI Multi-Agent Collaborative Architecture in 5G Slicing OptimizationInnovative Points and Implementation Directions of AI Intelligent Operations and Maintenance Research in Telecom NetworksMethodology and Case Studies for AI Agent Design in Intelligent Operations and Maintenance AIOpsRevealed: Why ChatGPT Understands You More and More? The Answer to AI Assistants Suddenly Becoming Smarter Lies in These 5 StepsNew Play of AI Multi-Agent Collaboration: Closed-loop Automation from Monitoring → Diagnosis → Optimization → Reporting(Source Code Attached) First Public Disclosure! Complete Technical Solution for Automated Repair of 5G Slices Based on AI AgentsHow to Build an AI Diagnostics Agent to Ensure 5G Network Communication for Sports EventsFrom American Telecom Giant Verizon to Middle Eastern Digital Carrier Etisalat, Global Operators are Replicating the 5G Slice AI Agent Monitoring Paradigm(Source Code Attached) Building Intelligent Optimization AI Agents for Communication Transport Networks with Dify+RAGFlow, Quickly Achieving Network Fault Prediction and Automated OperationsBest Practices for Self-Intelligent Networks: Constructing a New Intelligent Operations and Maintenance Paradigm for the Commercialization of 5G SlicesEverything Can Be MCP: Teaching You How to Build MCP Services from Scratch, Turning AI Agents into Industry BrainsFrom Work Order-Driven to AI-Driven Paradigm Shift, Huawei’s AI Innovation Empowers the Evolution of OSS in the 5G EraWhen AI Agents ‘Understand’ 3GPP Standards, 5G Network Optimization Experts PanicBuilding AI+OSS Agent Platforms with Langchain+Airflow, Doubling NOC Efficiency for Telecom OperatorsLet AI+OSS Agents ‘Fish for Needles in the Haystack’ in Telecom Networks, Achieving Millisecond-level Correlation and Quality Optimization for Multi-Circuit Cascading Faults, Redefining Network Operations BoundariesConstructing a TMF-Compliant Communication Network Quality Optimization AI+OSS Agent Platform, Rapidly Generating Business Performance Optimization Plans, Achieving Intelligent Transformation from Passive Response to Proactive Prediction(Source Code Attached) Building Industrial Internet MCP Services and AI Agents with Dify+RAGFlow, Quickly Achieving Predictive Maintenance for Pump EnterprisesUnderstanding the Difference Between AI and Blockchain: AI is a Productive Tool, Blockchain is a Tool for Production RelationsQwen3 Large Model AI Agent’s Secret Weapon for Mimicking ‘Human Memory’—Open Source Dynamic Knowledge Graph Graphiti[50,000-word long article, including case studies] Perfectly Implementing Knowledge Graphs and Low-Code Development Based on DeepSeek Private Deployment RAGFlow Industry Knowledge Base and Intelligent AgentsHow to Rent Servers for Private Deployment of DeepSeek at Low CostLocal Deployment of DeepSeek-R1 Commercial-Level Knowledge Base with LangChain+RAG+Agent, Perfectly Achieving Low-Code Visual Workflow OrchestrationUnderstanding Transformers Principles Through the Llama Large Model Architecture DiagramLocal Deployment and Case Demonstration of Llama 3.2 90 Billion Parameter Visual Multimodal Large ModelAI Large Model LLM Fine-Tuning Technology—Activation Checkpointing