Ozone is a cross-platform code debugging software that supports Segger J-link and J-Trace debuggers. It can load executable files compiled by toolchains such as IAR, Keil, GCC, clang/LLVM, for debugging C/C++ source code and assembly instructions.
The structure of the Ozone project file is a script language similar to C, allowing users to configure the Ozone software’s user interface and automated debugging workflow by editing this script file. This article will introduce how to call the script functions supported by Ozone to achieve automated debugging.
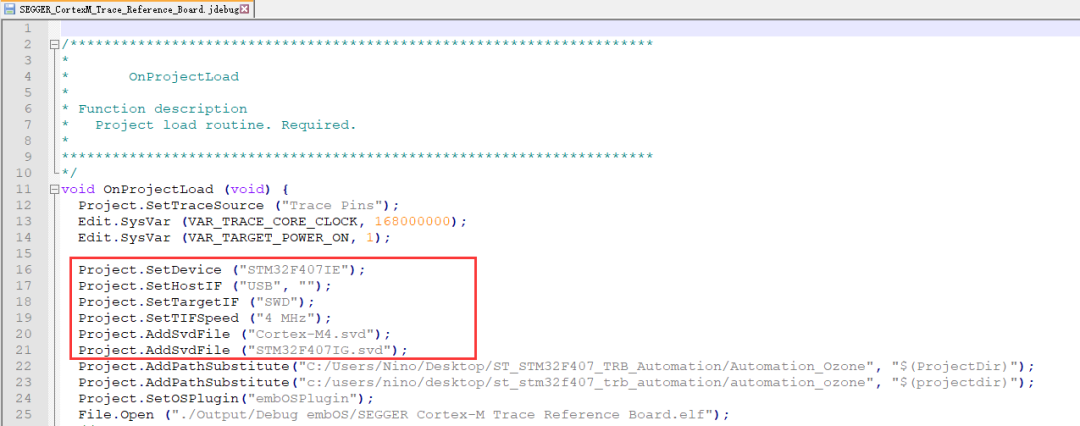
Most operations that can be performed through the Ozone software GUI have a corresponding script function, which can be called in the project file to achieve the same effect. For example, setting breakpoints, observing the value of a variable or register, exporting the result data of certain analysis views, etc. Additionally, specific operations that need to be executed before the Debug starts, after the Debug is paused, and after the chip is reset can all be achieved by editing the Ozone project file.
The detailed introduction to the functions and roles of the script functions supported by Ozone can be found in the Ozone user manual. Most functions can be clearly understood from their names regarding the operations they correspond to. Below are some examples of commonly used script functions.
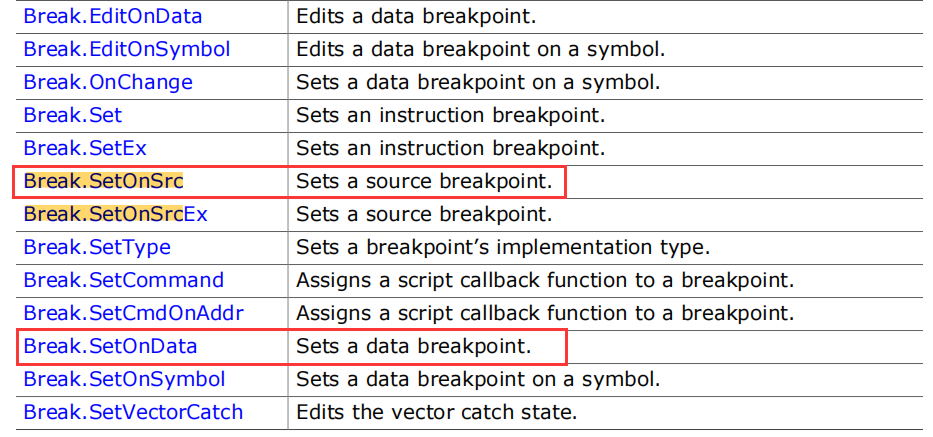
For example, by calling functions to set breakpoints, the script functions support operations for various types of breakpoints, including setting, enabling, and deleting breakpoints. It supports setting code breakpoints or data breakpoints at specific code locations, simply by calling the corresponding functions in the script file.
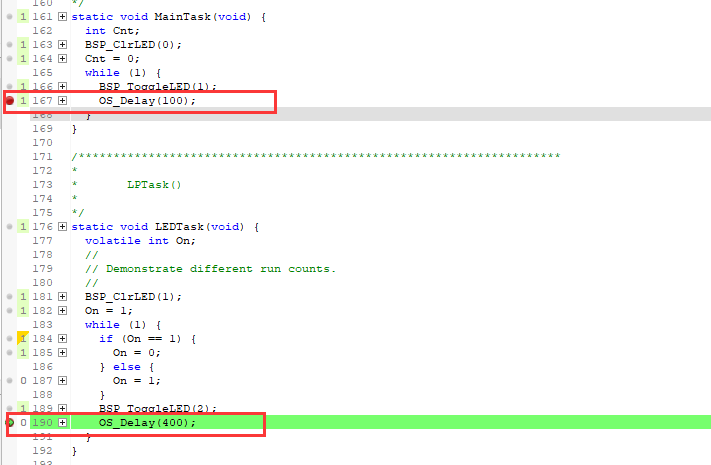
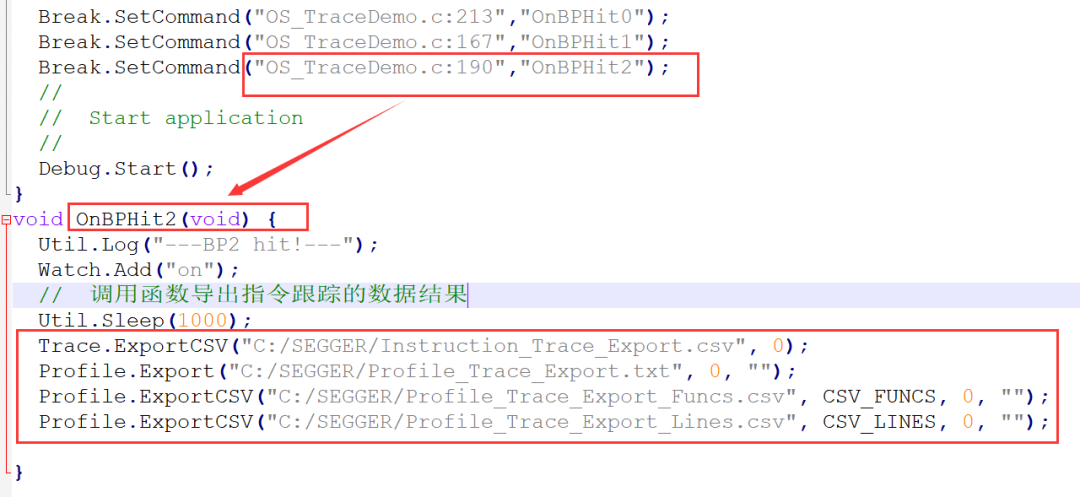
You can specify which C file and what code line to set a breakpoint, for example, setting a code breakpoint at line 190 of the OS_TraceDemo.c file.

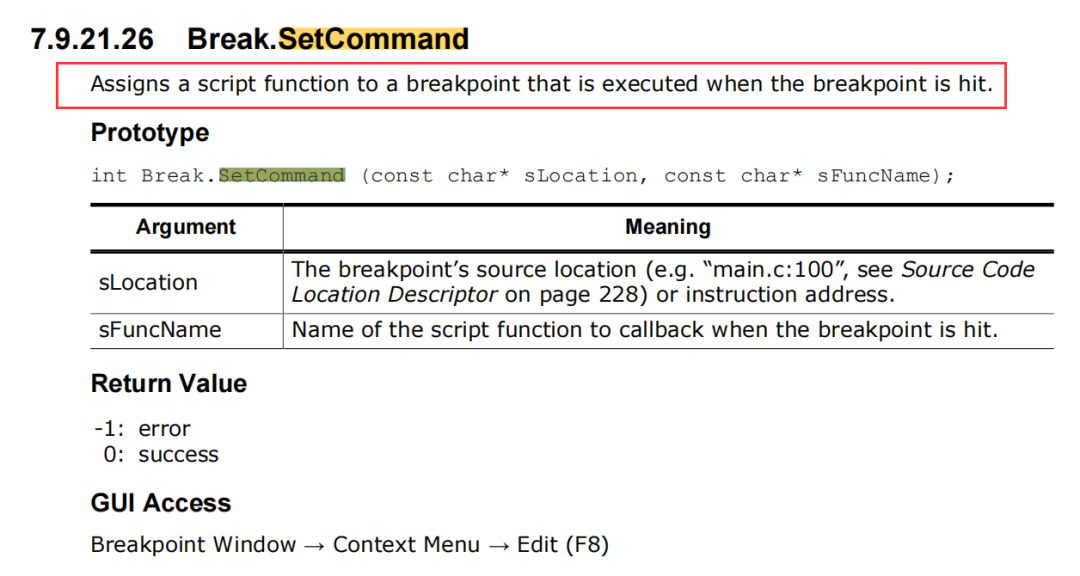
When the set breakpoint is triggered during the automated debugging process, you can specify the operation to be executed when the breakpoint is triggered using the Break.SetCommand function.
Corresponding operations can be set for each breakpoint location. For example, when the breakpoint at line 190 of OS_TraceDemo.c is triggered, call the OnBPHit2() function in the script file, where the instruction tracing debug results will be exported through the Profile series functions, supporting export in txt or csv formats.
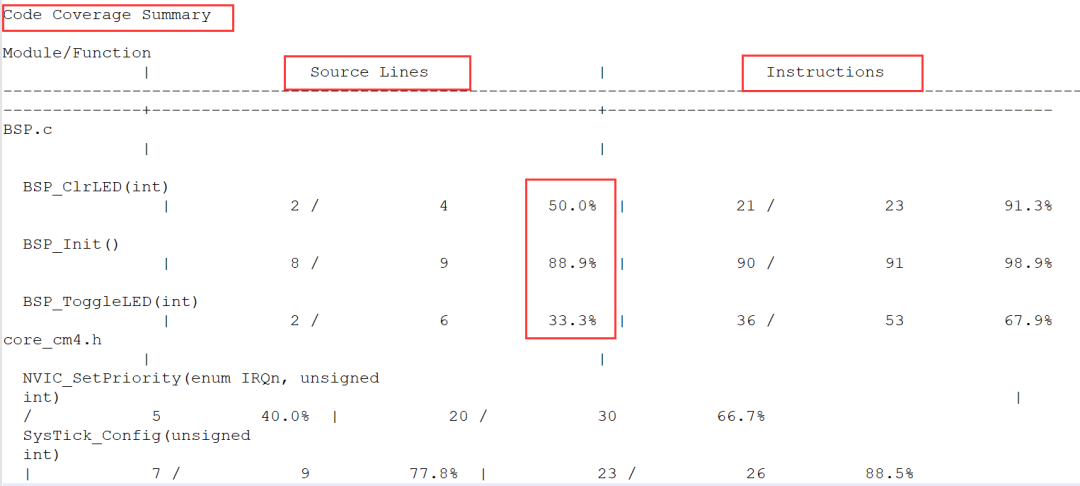
The exported instruction tracing analysis results can be found in the corresponding file path, and the code coverage analysis results are as follows.
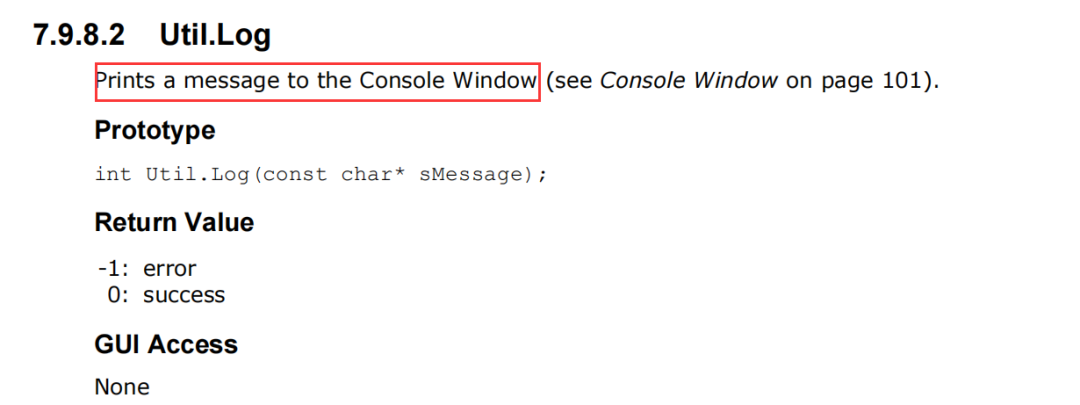
During the automated execution of the script, you can output relevant logs or error messages to the Ozone console window by calling the Util series functions.
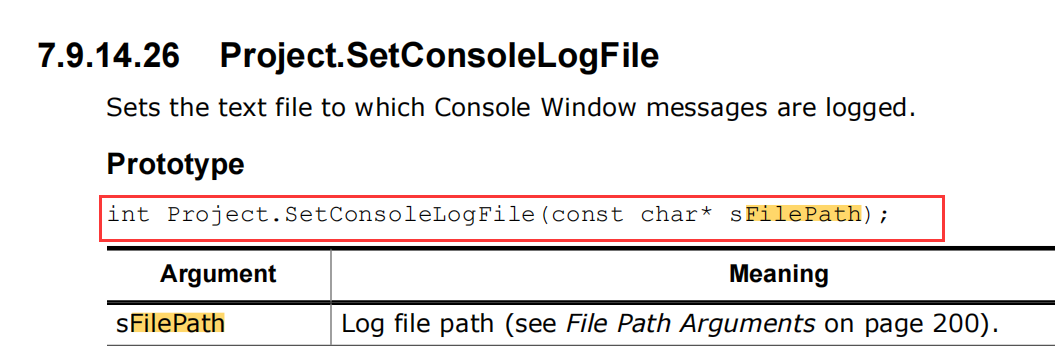
If you don’t want to view the output through the Ozone console window, you can also call functions to save the log information to a specified log file.
In the log file of the script, you can see the execution records of the automated debugging, including the trigger records of breakpoints and the corresponding operations executed after triggering. For example, by calling the Watch.Add function to observe the value of a certain variable in the watch window, the corresponding variable will be added to Ozone’s watch window after calling the function.
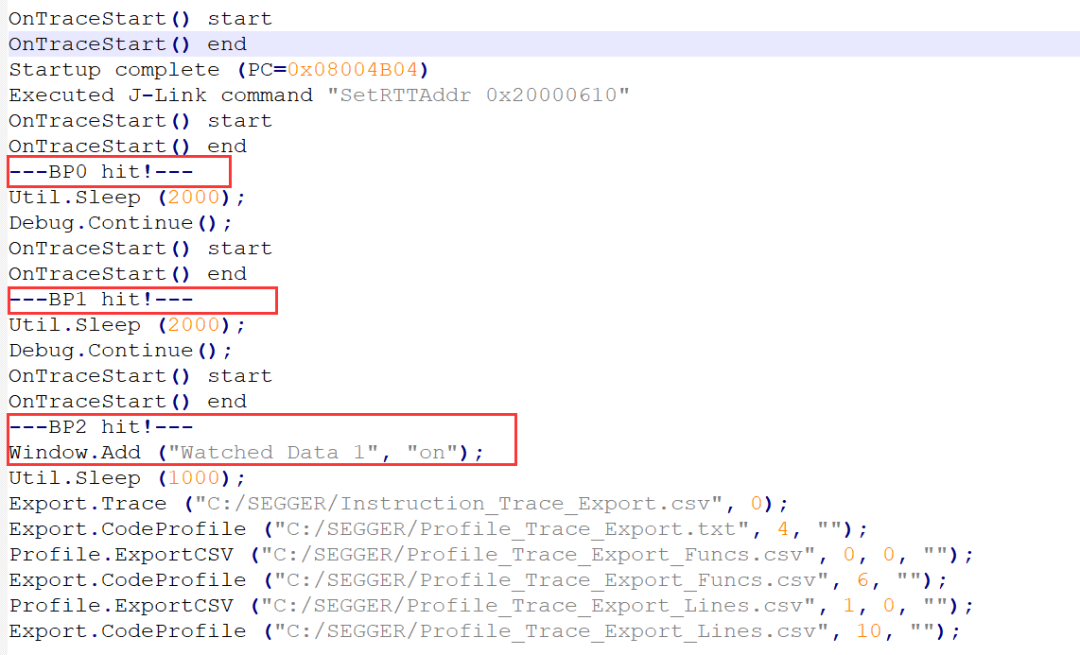
Here, the variable name added for observation is “on”, and when the set breakpoint 2 is triggered, the value of this variable is 1.

This article briefly introduces the script functions supported by Ozone and the automated debugging capabilities that can be achieved by calling these functions, including setting various types of breakpoints at specified locations, specifying operations to be executed when breakpoints are triggered, and automatically exporting Trace tracking data results. The numerous script functions and commands supported by Ozone allow users to perform automated debugging when large-scale debugging work is needed, which can alleviate the workload of customer testing engineers. For a complete introduction to the script functions supported by Ozone, please refer to the Ozone user manual. The complete project example used in this article can be downloaded via the following link, and interested users can try it out themselves:https://wiki.segger.com/Automated_Tests_with_Ozone
Welcome to follow our WeChat public account 【Microtech Technology】
Reply “segger free software” to obtain the download link as prompted.
Reply “join group” to join the technical exchange group as prompted.
Product inquiries:
Beijing: 010-62975900
Shanghai: 021-62127690
Shenzhen: 0755-82977971

Share, view, and like, at least I want to have one.