❖
The programs of microcontrollers are generally stored in Flash memory. After the chip is powered on, the CPU reads instructions from Flash and executes them. Compared to SRAM, writing to Flash is much slower, especially since a time-consuming erase operation is required before writing data to Flash. In some cases, there is a need to run or debug programs in SRAM.
The following two images compare the download speeds of SRAM and Flash in STM32 when using the J-Link debugger. The download speed for SRAM reached 109.7KB/s, while the download speed for Flash was only 10.3KB/s, showing a significant difference in writing speed.


During the debugging process of frequently modified code, running the code in SRAM can save a lot of time, eliminating the need for the erase and write times associated with Flash. From a power consumption perspective, running the application in SRAM allows the bootloader program to copy the application from Flash to SRAM each time the system is powered on, and then turn off the power to Flash, which can reduce the system’s power consumption.
When debugging code in SRAM, software breakpoints are used when adding breakpoints in the IDE, meaning that the number of breakpoints is not limited. However, when debugging in Flash, the breakpoints added must be hardware breakpoints, which are generally limited to only 4 to 8. If the number of breakpoints exceeds this limit, no additional breakpoints can be added.
Although the erase and write lifespan of Flash is generally over 10,000 times, it is unlikely that debugging will cause failure due to reaching this limit. However, it can indeed serve as a reason to debug code in SRAM.
Of course, while there are many benefits to debugging and running programs in SRAM, this is only suitable for on-chip SRAM. If it is external memory, the speed is much slower than on-chip SRAM, and the power consumption advantage is also lost. On the other hand, the capacity of on-chip SRAM is generally limited and much smaller than Flash, which is another drawback.
Methods to Achieve Debugging in SRAM
The implementation methods generally differ depending on the architecture of the processor, but the basic idea is consistent. Modify the linker settings to change the link address of the code to SRAM and also change the address of the vector table to an appropriate location in SRAM. As for how to boot from the code in SRAM, there are two approaches. Taking STM32 as an example, you can control the BOOT pin to start from SRAM upon reset.
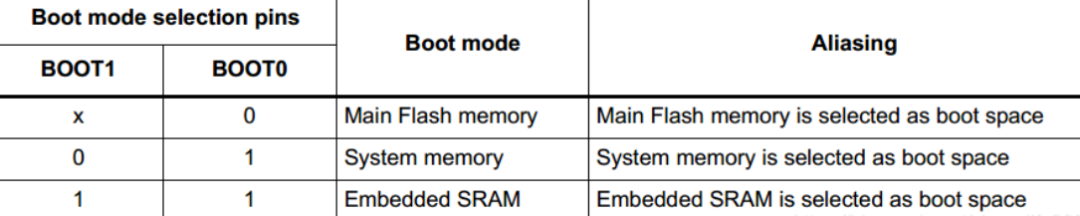
The other method is to directly use the debug and download buttons in the IDE, where the IDE debugging software automatically downloads the code to the SRAM area and sets the PC to execute the program. This is generally the method used for debugging programs in SRAM. Below, we will demonstrate debugging code in SRAM using SEGGER’s Embedded Studio for ARM (SES) and STM32F1 series MCUs.
1. Modify Linker Configuration
In SES, you can avoid modifying the linker script, since directly changing the script is a bit more work. Instead, directly modify the memory mapping file:

In the memory mapping file, directly change the address of Flash to the earlier part of SRAM, leaving the rest for program RAM.

2. Modify the Address of the Vector Table
Since Cortex-M requires the vector table to be placed at address zero, it can be changed after startup. Therefore, place the vector table at the starting address of SRAM. In the linker script, locate the section where the vector table is to the starting address of SRAM. However, the method used here does not require modification, as the address of Flash is now effectively the address of SRAM.

3. Set the Vector Table Base Address Register
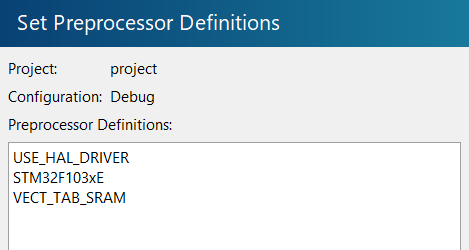
The VTOR register of the Cortex-M system control block controls the base address of the vector table, so you also need to configure the value of this register to the starting address of SRAM. If you are using ST’s HAL library, there is already implemented code in the CMSIS driver files, and you only need to define a macro named “VECT_TAB_SRAM” in the compiler macro definitions.

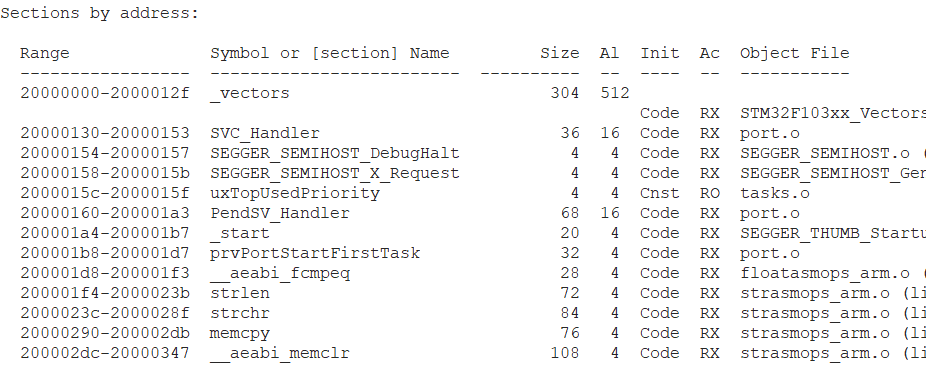
Through the linker mapping file, check the addresses of the linked code, and you can see that they are indeed located in SRAM, with the vector table also at the starting address of SRAM.
Next, you can debug the code in SRAM.

Welcome to follow our WeChat public account 【MicTech Technology】
Reply “segger free software” to get the download link as prompted
Reply “Join Group” to join the technical discussion group as prompted
Product Consultation:
Beijing: 010-62975900
Shanghai: 021-62127690
Shenzhen: 0755-82977971

Share, View, and Like, at least I want to have one