Who in hardware doesn’t love instruments? However, there is a problem; it seems that not many people understand common oscilloscopes. Therefore, I decided to write some content on this topic. Just a side note:
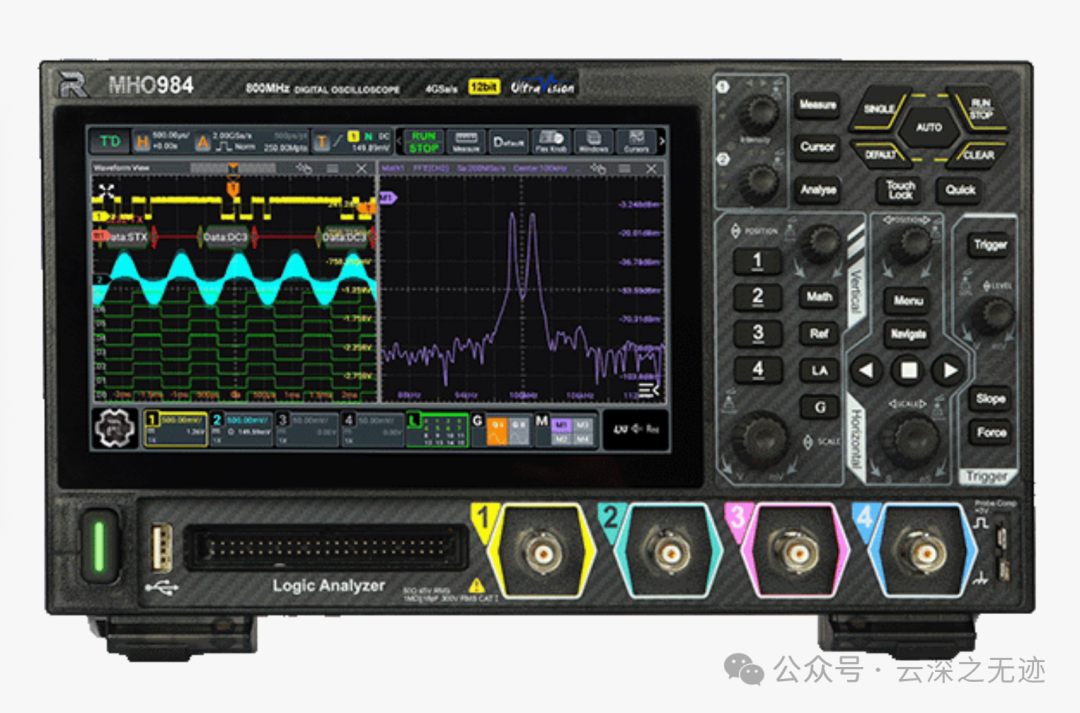
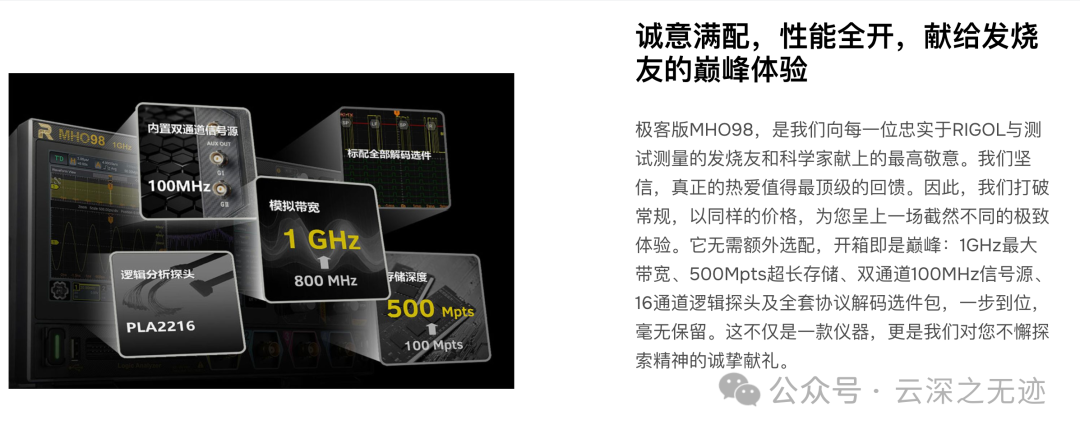
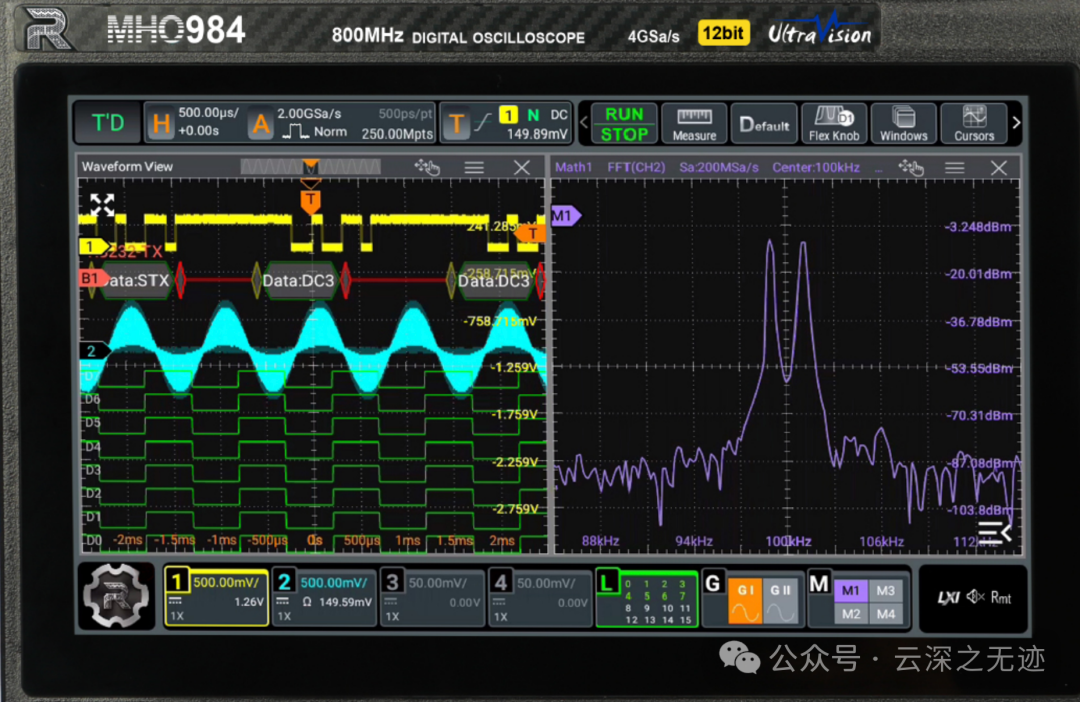
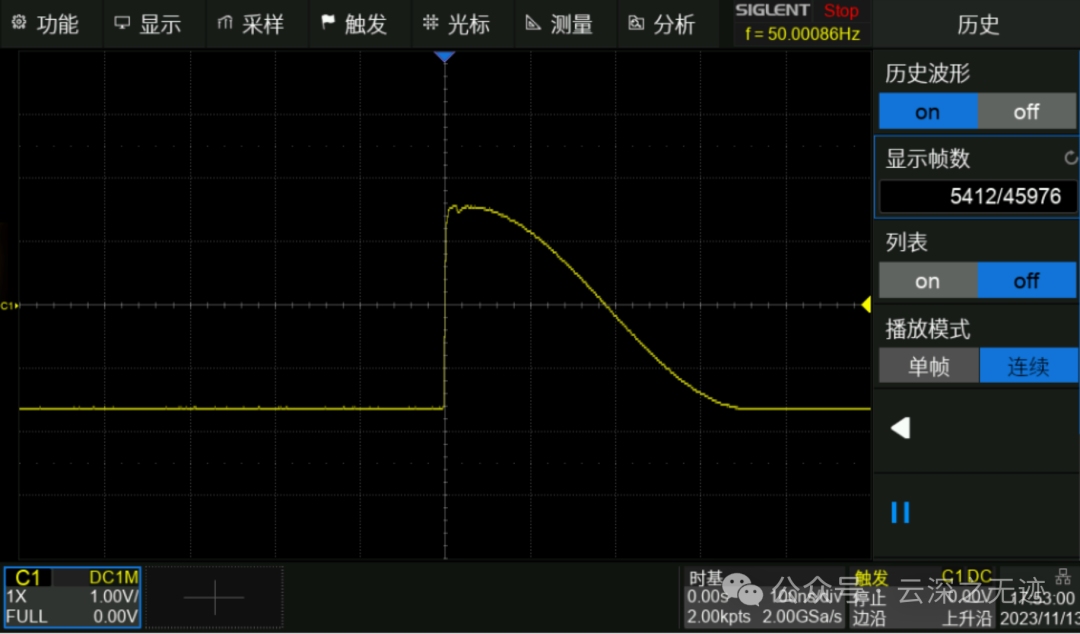
Alright, let’s wipe off the drool and continue looking at Dingyang’s small oscilloscope:
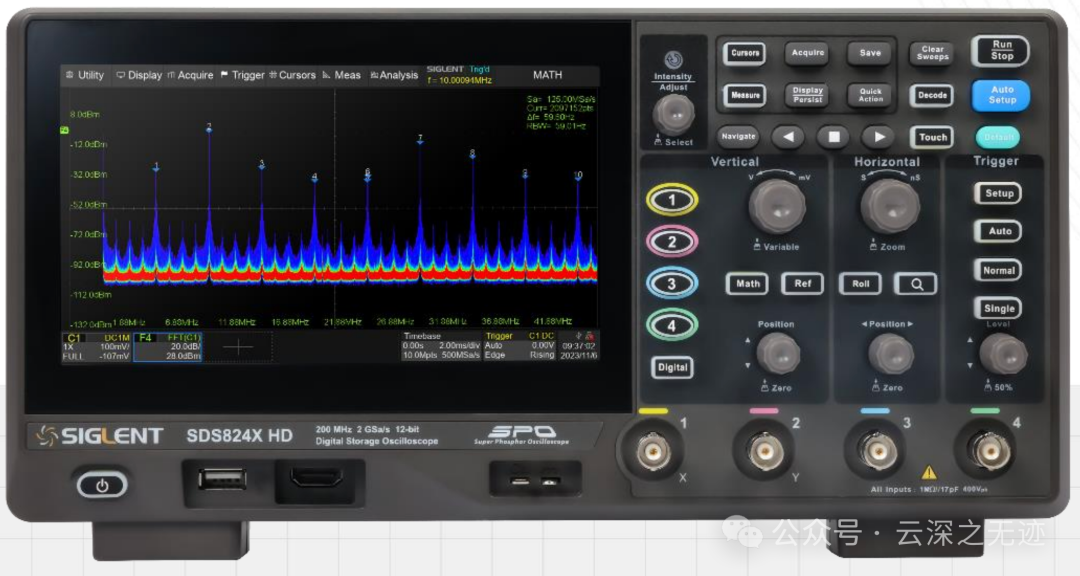
First, I want to mention that the spectrum analysis function actually has dedicated spectrum analyzers, but they are too expensive. Today’s oscilloscopes provide part of this functionality.
FFT is part of the Mathematical Operations (Math) functionality.
Any analog channel, digital channel, or reference waveform can be used as an input source; based on the time-domain waveform, a frequency-domain display is generated for spectrum observation. Users can access it through the front panel <span>Math</span> button → touch screen Math → FFT menu.
There are some parameters that can be set for FFT. As I mentioned before, the frequency domain is unfamiliar to us, so these settings may also be uncomfortable.
Center Frequency (HCENter)
Determines the “midpoint” of the frequency spectrum’s horizontal axis; similar to the time base offset in the time domain of the oscilloscope, the center frequency is equivalent to the “focal point” of the spectrum. If you want to observe the modulation signal of a certain carrier, you can set the center frequency to the carrier frequency, allowing the sideband signals to be symmetrically displayed on both sides of the center. Additionally, when analyzing low-frequency noise, the center frequency can be set to 0 Hz (DC) to observe the spectrum starting from DC.
Frequency Span (HSCale / SPAN)
Determines the coverage range of the horizontal axis, which is the displayed bandwidth; the frequency resolution of FFT is determined by the formula:
SamplingRatePointsCount
The frequency range visible on the screen is determined by SPAN (span).
If SPAN is set very wide, a large range of the spectrum can be viewed, but the details may not be clear.
If SPAN is set very narrow, adjacent frequency components can be distinguished more clearly, but the overall picture may not be visible.
Amplitude Scale (SCALe)
Determines the display scale of the vertical axis, such as 10 dB/div or 0.1 Vrms/div.
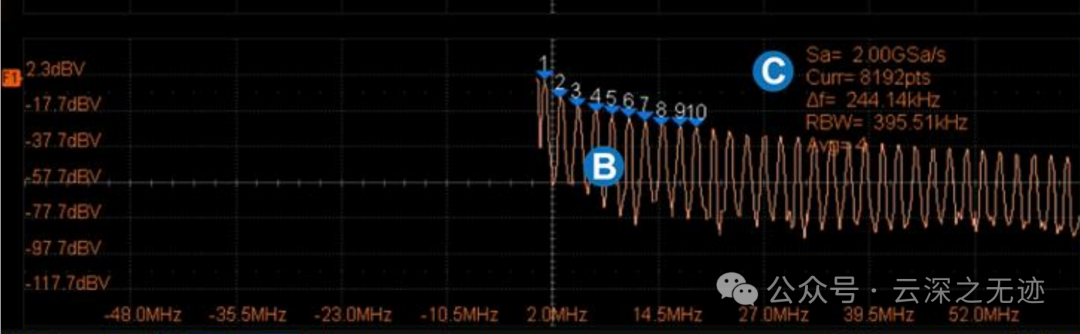
dB/div mode → more suitable for spectrum analysis (the signal dynamic range is large, making it easier to compare the fundamental frequency with harmonics and noise).
Linear amplitude mode → displays actual amplitude more intuitively (e.g., Vrms).
In EMI testing → use dBµV or dBm; for audio and power ripple → using Vrms is more intuitive.
Reference Level (RLEVel)
Sets the “zero point” position of the vertical axis, equivalent to treating a certain amplitude as the 0 dB reference.
The reference level determines the amplitude range on the screen. For example: if the reference level = 0 dBm, with 10 dB/div, and 8 divisions on the screen → the maximum display on the screen = 0 dBm + 80 dB.
If the signal is too small, the reference level can be lowered; otherwise, details may not be visible.
If the signal is too large, the reference level can be raised to avoid the waveform hitting the edge of the screen.
Points (POINts)
Determines the number of calculation points for FFT.
The more points, the higher the frequency resolution (able to distinguish closer frequency components).
However, the more points, the slower the refresh rate, leading to decreased real-time performance; in noise analysis → high resolution is needed, so select a larger number of points.
Draw a schematic diagram (frequency spectrum axis + annotations for these five parameters) to visually see their relationships.
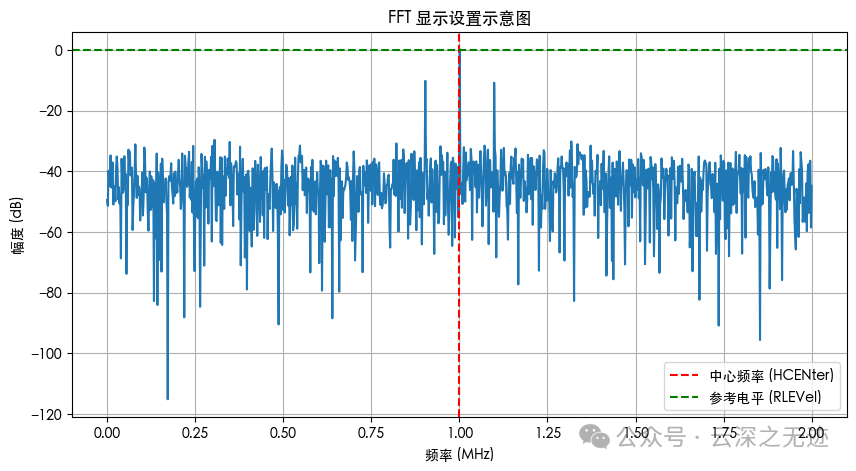
Simulate an FFT display settings schematic:
Red dashed line → Center frequency (HCENter), the midpoint of the frequency spectrum’s horizontal axis.
Horizontal range → Span (SPAN/HSCale), determines how wide a frequency band you can see.
Vertical axis scale → Amplitude scale (SCALe), determines how much each division represents in dB or Vrms.
Green dashed line → Reference level (RLEVel), sets the position of 0 dB.
Curve detail resolution → determined by points (POINts), the more points, the finer the detail, but the slower the refresh rate.
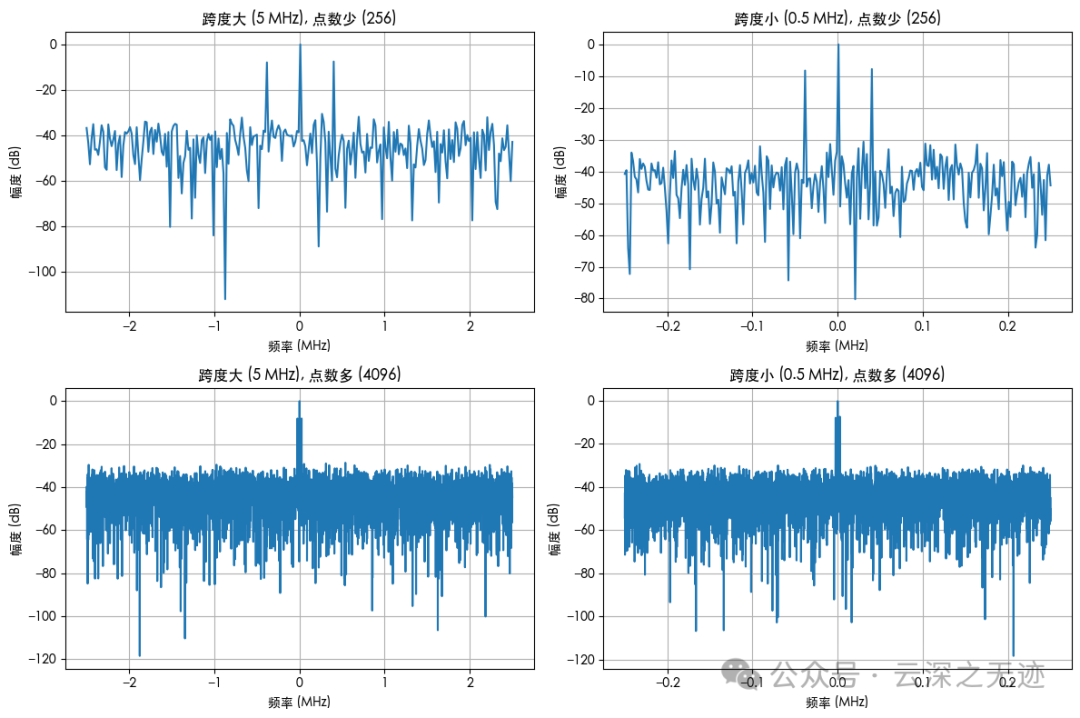
This comparison chart shows the different combinations of Span (SPAN) and Points (POINts) and their impact on frequency spectrum display:
Top left: wide span + few points → can see a wide frequency band, but resolution is poor, details are blurred.
Top right: narrow span + few points → only see a narrow band, but details are still unclear.
Bottom left: wide span + many points → wide range + high resolution, but refresh speed will be slower.
Bottom right: narrow span + many points → narrow range + high resolution, best for detailed signal structure analysis.
If any manufacturers are willing to provide instruments, please contact me!