 The oscilloscope is rated as the most commonly used electronic debugging tool, widely applied due to its powerful features and versatility. However, with the development of electronic technology, the complexity of testing has greatly increased, and engineers face faster signals, more complex mixed-signal debugging, and even the need for spectrum analysis of many signals. Many engineers believe that using oscilloscope FFT for spectrum analysis is unreliable and has many drawbacks:
-
Oscilloscope FFT analysis changes the RBW by adjusting the horizontal time base, making it impossible to achieve both waveform observation and spectrum analysis.
-
Testing scenarios with very small RBW require increasing the horizontal time base, which severely affects the oscilloscope’s processing speed.
-
The operation method is not user-friendly, and it is impossible to directly set the conditions for spectrum analysis.
-
It only displays the analysis results of full-screen signals, and it is not possible to obtain optimal signal presentation in both time and frequency domains simultaneously.
-
Limited dynamic range.
-
……
These issues increasingly trouble engineers. Do we really need to buy a new professional spectrum analyzer to solve these problems?
The Tektronix 4 Series MSO Oscilloscope’s Spectrum View feature can perfectly solve these issues!
Based on the TEK049 innovative platform, the Spectrum View spectrum analysis feature uses digital downconversion technology. After obtaining digital IQ signals, FFT is performed, ensuring flexibility and speed in spectrum testing. Figure 1 shows the schematic diagram of signal acquisition and processing architecture. The analog signal is converted into a digital signal by the ADC, and time and frequency domains are processed in parallel, allowing independent settings for time and frequency domain capture times.
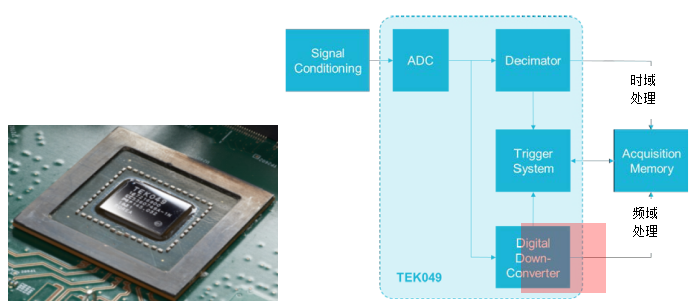
Figure 1. Schematic Diagram of TEK049 Signal Acquisition and Analysis Architecture
Digital downconversion is widely used in wireless communication systems. The downconversion process is shown in Figure 2, which includes functions such as digital IQ demodulation, low-pass filtering, and sample extraction (or resampling). The local oscillator frequency of the digital IQ demodulator is the same as the center frequency set in Spectrum View, completing the carrier cancellation to obtain a zero intermediate frequency signal. The low-pass filter is used to eliminate high-order mixing products, and finally, the IQ signal is obtained through sample extraction.
Spectrum View processes digital IQ signals, which is a significant feature compared to traditional FFT. The frequency carried by IQ signals is much lower than that of the original acquisition signals. Resampling of IQ data does not require a high sampling rate, significantly reducing the data volume, while the capture time (Spectrum Time) is unaffected. Even with a lower RBW, it still has a very high processing speed.
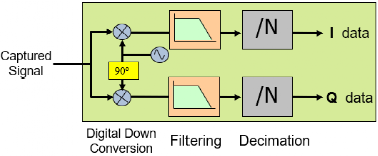
Figure 2. Obtaining IQ Data After Digital Downconversion
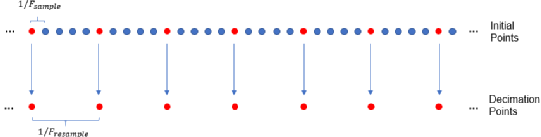 Figure 3. Schematic Diagram of Resampling I/Q Sample Data
For better understanding, Figure 3 provides an example of I/Q sample resampling. Assuming the resampling rate is 1/5 of the original sampling rate, the resampling process involves extracting one sample point from every five original sample points, without changing the relative timing relationship. This means that after sample extraction, the same number of sample points has a larger Spectrum Time, thus achieving high frequency resolution.
The Spectrum View featurecan achieve: better spectrum analysis performance, time domain and frequency domain analysis and control do not interfere with each other, and customizable frequency domain analysis on the signal time axis according to spectrum analyzer operation methods, significantly improved dynamic performance.
In addition to the brand new Spectrum View feature, the 4 Series MSO mixed-signal oscilloscope also provides exceptional insight with up to 6 analog channels, a brand new touch user interface, and ultra-high resolution display,eliminating the complex setup menus of traditional oscilloscopes and allowing one-click access to the settings interface, greatly improving operational efficiency.
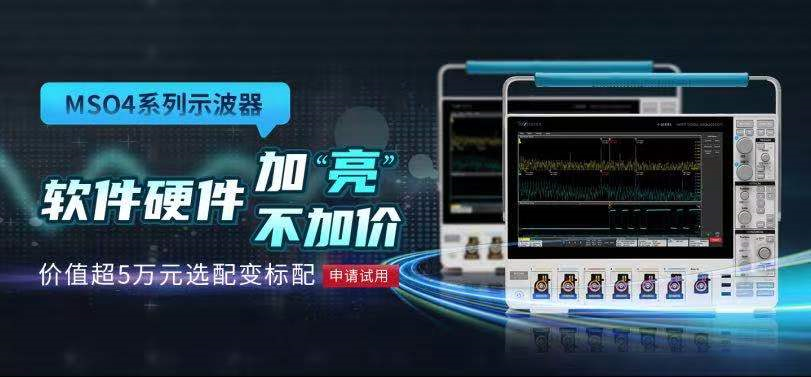
The Tektronix 4 Series Oscilloscope has been upgraded, continuously enhancing its features without increasing prices.
【Highlight One】: Software enhancement, the optional Spectrum Viewbasic analysis softwarehas become standard:
-
Fast EMI testing to locate interference points.
The new Spectrum View spectrum analysis feature eliminates the drawbacks of traditional FFT analysis methods.【Highlight Two】: Hardware enhancement, 1GHz and above bandwidth oscilloscopes now come standard with a 1GHz passive probe:
-
This doubles the overall performance of the 1GHz oscilloscope test system, improving the rise time from 700ps to 350ps, allowing testing of signals at tens or even hundreds of MHz high-speed signals.
-
Multiple application testing scenarios: high-speed bus signals such as Ethernet, USB; high-speed ripple signals; rise time testing of third-generation semiconductor devices like GaN (optional accessories required).
【Highlight Three】: Function enhancement, software analysis capabilities are stronger.
-
Custom filtering software:
Customers can customize signal filtering frequencies (supporting low-pass, high-pass, and band-pass filtering).
The Tektronix 4 Series MSO Oscilloscope is suitable for testing complex systems, offering better performance and higher specifications. When test results are uncertain, the 4 Series MSO can serve as a standard. It features an exceptionally large display and a higher number of usable channels than similar products, providing unprecedented insight in limited space, creating a brand new operating experience for oscilloscopes. With a depth of 6.1 inches (15.5 cm), it fits limited workspace; outstanding detail design and up to 6 FlexChannel input channels, any channel can display waveforms, spectra, or both, and any input channel can connect logic probes to view eight digital channels, with bandwidths up to 1.5GHz and sampling rates of 6.25GS/s.
 Click “Read the Original” to learn about the latest technology.