Some signal features are difficult to determine in the time domain, but can be easily analyzed in the frequency domain. For example, the noise characteristics of a DC power supply require the use of Fourier analysis to convert time-domain signals into frequency-domain signals.
The ZDS2022 oscilloscope features up to 4Mpts of FFT analysis sample points, with a frequency resolution of up to 250Hz. We will demonstrate how to perform Fourier analysis on a square wave input signal.
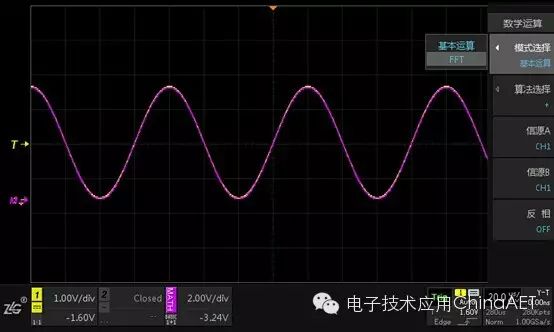
Figure 1: Select FFT Operation
First, input a sine wave signal to stabilize the display on the screen, then press the 【Math】 key and select FFT from the mode options. The ZDS2022 oscilloscope utilizes optimized algorithms and powerful DSP processors, significantly enhancing data processing capabilities. In an instant, the FFT analysis spectrum and results are automatically displayed. By rotating knob B, you can view the top 20 frequency points listed in the spectrum table. Observing the spectrum graph allows you to visually see the various frequency components of the waveform.
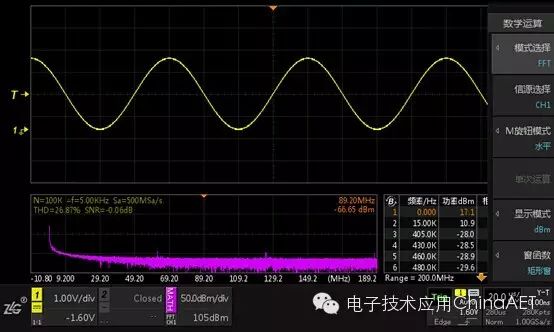
Figure 2: FFT Operation Result Display
Rotating knob M1 adjusts the vertical or horizontal range of the spectrum graph. A short press on knob M1 switches between horizontal and vertical directions. Rotating knob M2 adjusts the vertical or horizontal offset of the spectrum graph. A short press on knob M2 resets the vertical or horizontal offset, which is very beneficial for specific spectrum analysis!
The 4M point FFT analysis capability of the ZDS2022 oscilloscope rivals that of a spectrum analyzer! Whether troubleshooting crosstalk issues or identifying distortion problems caused by amplifier nonlinearity in analog waveforms, it is an extremely practical feature!

Reading this article took: 
 minutes
 seconds, forwarding only takes 1 second.
❀Reposting is a form of wisdom❀ Sharing is a virtue❀