Traditionally, we have a profound understanding of the importance of four conventional indicators of oscilloscopes, such as bandwidth, sampling rate, storage, and triggering. This article will explore the impact of the oscilloscope’s background noise on the debugging and testing of high-speed serial signal eye diagrams.
First, let’s take a look at where the oscilloscope’s background noise comes from.
Oscilloscope Background Noise
The typical architecture of a digital oscilloscope is shown in Figure 1:
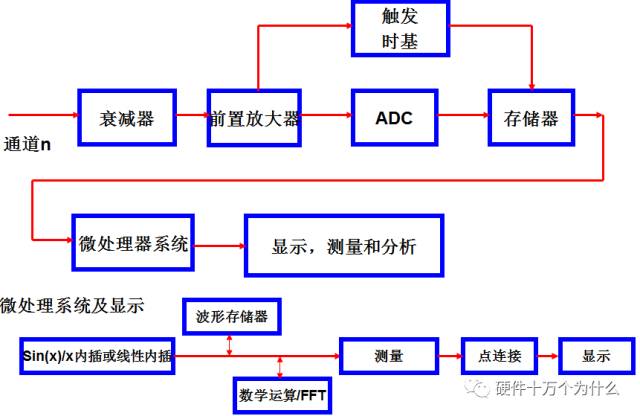
▲ Figure 1 Typical Structure of an Oscilloscope
The analog bandwidth of an oscilloscope mainly depends on the attenuator, which serves to attenuate large signals to the optimal working range of the ADC, while the amplifier is intended to amplify small signals to the optimal working range of the ADC. The background noise of the oscilloscope mainly originates from the attenuator and the front-end amplifier, which is a noise that cannot be completely eliminated by any circuit or component. This background noise will superimpose on the signal, making it indistinguishable during ADC sampling, meaning that the ADC will quantize everything, and this background noise will also be treated as part of the signal. After the signal is attenuated by the attenuator, the oscilloscope re-amplifies the signal during signal processing after sampling, and this re-amplification process will also amplify the background noise from the front-end attenuator.
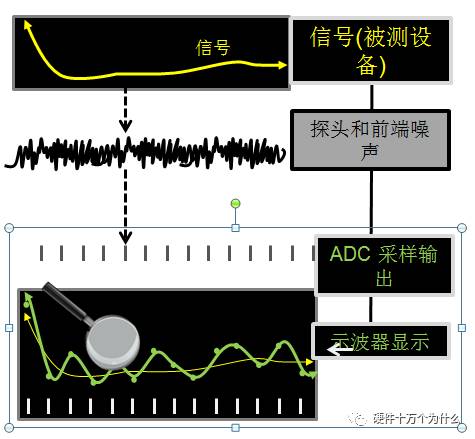
▲ Figure 2 How Background Noise is Introduced
Therefore, the value of background noise, as a performance metric for the front-end components of the oscilloscope, has become a necessary specification to be marked in the oscilloscope product manual.
So how significant is this parameter on the testing of high-speed serial signal eye diagrams?
Eye Diagram Testing
One of the essential parameters for eye diagram testing is eye height:
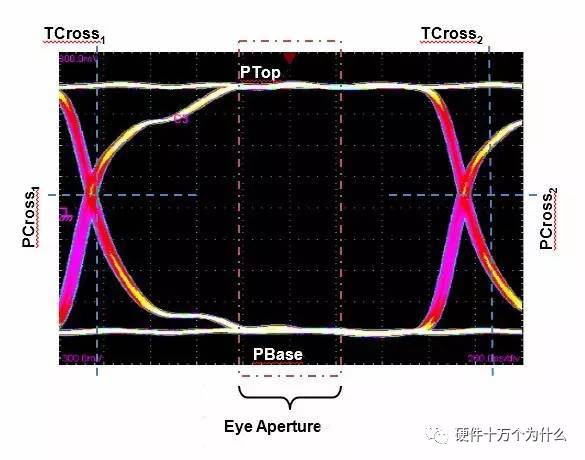
▲ Figure 3 Schematic of Eye Diagram Testing
The above figure shows a typical schematic of the parameters for eye diagram testing. The eye height is defined as follows:
Eye Height = (PTopmean-3*PTopsigma)-(PBasemean+3*PBasesigma)
PTopsigma is the standard deviation or root mean square value of the noise at the top of the eye diagram waveform, while PBasesigma is the standard deviation or root mean square value of the noise at the bottom of the eye diagram waveform. It can be seen that the final result of the eye height is directly related to the waveform noise standard deviation. Moreover, the waveform noise standard deviation is not only related to the waveform itself but is also closely associated with the oscilloscope’s background noise, as mentioned earlier.
As shown in the figure below, even for oscilloscope products of the same brand and bandwidth, the level of background noise is different. Here are the eye diagrams of two 4 GHz bandwidth oscilloscopes testing the same signal. Both oscilloscopes have identical bandwidth and vertical/horizontal settings. You can see that the right image of the Infiniium S series oscilloscope, due to its low background noise and 10-bit ADC characteristics, more accurately reproduces the signal’s eye diagram, with the eye height being 200 mV higher than the left image, providing a measurement result with smaller errors and higher precision.
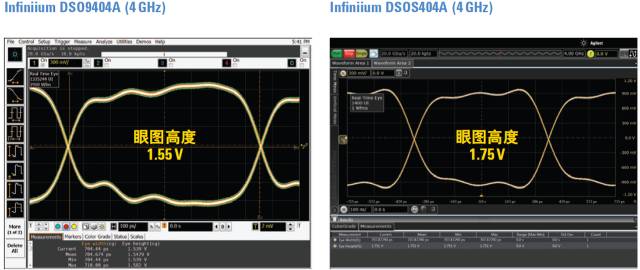 ▲ Figure 4 Differences in Eye Diagram Testing Effects with Different Background Noise Levels
We have discussed the direct impact of the oscilloscope’s background noise on the accuracy of serial signal eye diagram testing.
In many compliance tests of high-speed serial signal physical layers, such as USB3.x/HDMI2.0/DP/SATA/PCIE3.0/SFP+, fixtures are typically used in conjunction with high-frequency cables to connect signals to the oscilloscope for standardized and compatible testing. As the signal rate continues to increase, the limited bandwidth of the fixtures is becoming one of the sources of error in high-speed signal testing. Taking HDMI2.0 testing as an example, the following image shows the HDMI2.0 TPA-P fixture provided by Wilder Company. According to Wilder’s data, after removing the losses caused by the connectors in the fixture (De-Embedding), the -3dB bandwidth can reach 26.5GHz, which is a significant improvement compared to before removal. This means that in actual testing systems, additional testing errors are introduced due to the limited performance of the fixture. In fact, the fixture itself is not part of the actual operating system but is merely for normalizing the test environment and facilitating testing. In today’s high-speed serial signal testing, as the signal rates increase, the system margins are becoming increasingly tight, and the testing errors introduced by fixtures have become a non-negligible factor. Therefore, de-embedding of fixtures is becoming part of high-speed serial signal compliance testing.
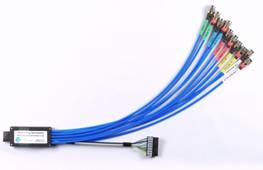
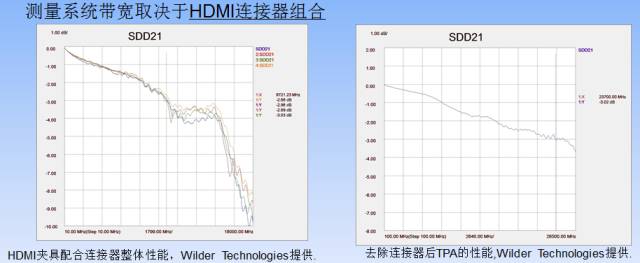
▲ Figure 5 Wilder Company’s HDMI2.0 Fixture and De-Embedding EffectSchematic Diagram
Since de-embedding is so important, what is the principle behind it?
Principle of De-Embedding
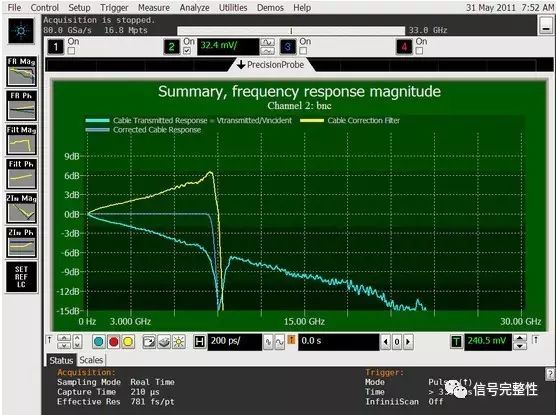
▲ Theoretical Schematic of Fixture De-Embedding
As shown in the figure above, the curve at the bottom is the frequency response curve of the fixture itself, with its -3dB frequency point around 5GHz. By using the yellow curve for reverse amplification, the final middle curve is obtained, which has a -3dB frequency point around 9GHz, significantly compensating for the losses of the fixture between 5GHz and 9GHz. The process described above is the de-embedding of the fixture (De-Embedding), meaning that through this signal processing, the signal loss or error caused by the fixture, which was introduced for convenience and standardization, is compensated for. In this amplification process, in addition to amplifying the signal, the oscilloscope’s background noise will also be amplified, thus introducing more additional testing errors and uncertainties. Therefore, oscilloscopes with low background noise will result in higher eye diagram opening, i.e., eye height.
The de-embedding processing discussed above can also sometimes be applied to cables. The Infiniium series oscilloscopes have an option that can automatically complete de-embedding for fixtures and cables.
As shown in Figure 7, the left eye diagram is the result of testing before de-embedding cable losses, while the right eye diagram is the result obtained after de-embedding cable losses. It is evident that the eye opening has significantly increased by about 35mV. However, it can also be seen that the thickness of the eye’s eyelids has increased, indicating that noise has inevitably been amplified in this process. Oscilloscopes with low background noise will achieve even better testing results during this de-embedding amplification process. More information about fixture and cable de-embedding methods can be found in reference 5.
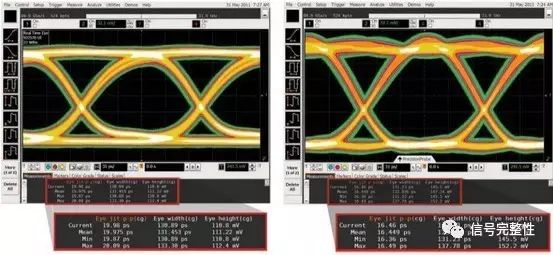
▲ Figure 7 Comparison of Eye Diagram Testing Effects Before and After De-Embedding
In today’s processing of serial high-speed signals, in addition to the influence of the de-embedding of fixtures and cables on the amplification of background noise mentioned above, there is another more common factor, which is the equalization in the receiver of high-speed serial links, including Feed-Forward Equalization (FFE) and Decision Feedback Equalization (DFE). A typical example is the CTLE (Continuous Linear Equalizer, a type of FFE) in the receiver of USB3.x Gen1 5Gbps:
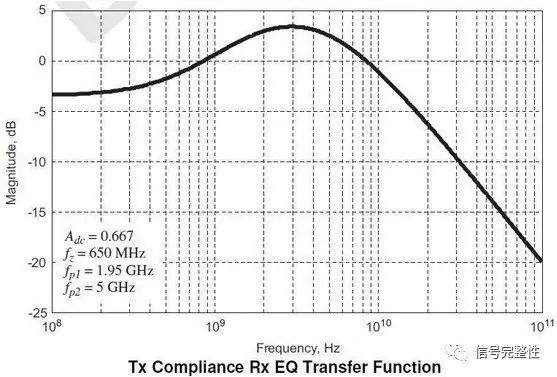
▲ Schematic of USB3.0 Receiver CTLE Equalization
In the above figure, it can be seen that within the frequency range of 800MHz-8GHz, the CTLE in the receiver amplifies the signals by about 3dB. This amplification is mainly to compensate for losses caused by the limited bandwidth of the transmission link. In actual testing processes, neither the fixture nor the oscilloscope’s probes can detect the equalized signals in the receiver. Therefore, this equalization processing needs to be completed by the analysis software in the oscilloscope. For example, for USB3.x testing, as shown in the figure below, the red dashed line indicates that the CTLE On in the oscilloscope’s consistency analysis software will activate the equalization algorithm in the receiver:
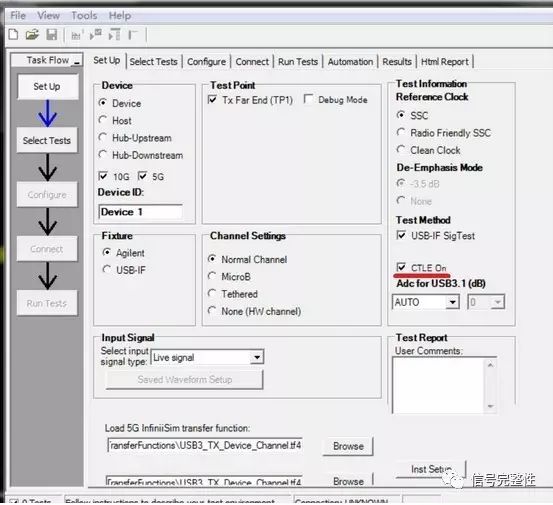
▲ USB3.1 Consistency Testing Software Settings Interface
When the oscilloscope software executes the equalization algorithm, it will also amplify the instrument’s background noise, thus reducing the reserved margin. Similar to the de-embedding of fixtures, in the process of equalization amplification, in addition to amplifying the signal, the oscilloscope’s background noise will also be amplified, introducing more additional testing errors and uncertainties. Therefore, similarly, oscilloscopes with low background noise will lead to higher eye diagram opening, i.e., eye height.
In many standard compliance tests, fixtures are introduced for standardized compliance testing. However, in some cases, probes are also needed for testing, such as in high-impedance testing scenarios or multi-link testing like HDMI2.0. Probes themselves will also have some attenuation. When the probe attenuates the signal outside the oscilloscope, the oscilloscope will re-amplify the signal, and this amplification process will also amplify the oscilloscope’s background noise, thus reducing the reserved margin of the system, which ultimately results in reduced eye diagram opening, i.e., eye height.
Conclusion
This article provides a preliminary introduction and discussion on the impact of the oscilloscope’s background noise on the results of high-speed serial signal eye diagram testing, focusing on the following points:
❶ The oscilloscope’s background noise itself has a direct impact on the eye opening, i.e., eye height.
❷ The reverse amplification or compensation during the de-embedding process of fixtures and cables will amplify the oscilloscope’s background noise, thus affecting eye height.
❸ The testing software on the oscilloscope, when widely using equalization algorithms in simulated high-speed serial links, will amplify the instrument’s background noise while amplifying the signal, thus affecting eye height.
❹ When using probes, the amplification process in the oscilloscope after probe attenuation will also amplify the oscilloscope’s background noise, thus affecting eye height.
Of course, there are other minor settings during the use of the oscilloscope that may also affect measurement accuracy, such as range and vertical offset, which will not be discussed further in this article.
Therefore, this article not only discusses how the oscilloscope’s background noise affects eye opening but also provides some ideas or perspectives on how to address issues when encountering insufficient eye opening, i.e., failed eye height tests.
The background noise of the oscilloscope and the entire measurement system significantly impacts the eye diagram opening, i.e., eye height testing results. It will also greatly affect other evaluation indicators of the entire system, such as jitter and Bit Error Ratio (BER). Due to space limitations, this article will not discuss these further.
In today’s trend of increasing serial signal rates, the characteristics of low voltage and high transition rates inevitably lead to a tightening of the system’s reserved design margins. On the other hand, market-driven cost-cutting pressures will also continue to compress design margins. Therefore, using oscilloscopes with low background noise for testing has become a wise choice for many industry professionals to reserve more margin for system design. Consequently, the background noise of oscilloscopes is becoming the fifth important indicator for high-speed oscilloscopes, following bandwidth, sampling, storage, and triggering, and is one of the most important evaluation criteria when purchasing and selecting equipment.
Appendix: References:
[1]: Evaluating the Signal Fidelity of Oscilloscopes, Keysight Technologies, 5991-4088CHCN
[2]: HDMI Type-A v2 Test Adapter User Manual, Wilder Technologies, 910-0040-000 Rev.B
[3]: Universal Serial Bus 3.1 Specification, Rev 1.0
[4]: Precision Probe for Bandwidths up to 33 GHz, Keysight Technologies, 5990-7940EN
[5]: Keysight N5465A InfiniiSim Waveform Transformation Toolset for Infiniium Oscilloscopes, Keysight Technologies, 5990-4059EN
This article is authored by: Keysight Huang Teng
17 years of experience as a hardware engineer; graduated in 2000 from Nanjing University of Science and Technology, Department of Automatic Control (Master’s Degree);
formerly a senior hardware engineer at ZTE Communications Nanjing Research Institute, engaged in data communication hardware development;
with extensive theoretical and practical experience in time-domain and digital circuit testing.
More documents related to signal integrity and testing can be downloaded through Hard Ten Classroom.