Definition of SOC for Lithium-Ion Batteries
SOC, as a key technical indicator managed by the Battery Management System (BMS), is obtained through estimation methods and parameter correspondence. The main function of SOC in the power batteries of new energy vehicles is to provide an intuitive display of the remaining energy in the vehicle, similar to a fuel gauge in a car or the remaining battery life in a mobile phone. SOC, as the most important parameter of lithium-ion batteries, represents the state of charge within the battery, which cannot be directly measured by physical methods. Currently, it can only be estimated relatively accurately through specific algorithms. SOC is equal to the ratio of remaining charge to rated capacity. When SOC is 100%, it indicates that the battery is fully charged; however, SOC > 100% can also occur in algorithms. When SOC is 0%, it indicates that the battery is depleted.
Chapter 2 Characteristics Testing and Modeling of Lithium-Ion Batteries
2.1 Introduction to Lithium-Ion Batteries
The development history of secondary batteries has gone through lead-acid batteries, nickel-cadmium rechargeable batteries, nickel-metal hydride rechargeable batteries, and lithium rechargeable batteries. Fuel cells, as a more promising solution than lithium-ion batteries, are currently still at the proton exchange membrane stage and require greater investment in scientific research, along with more time and funding to achieve commercialization. Supercapacitors are also a good alternative, but improvements in supercapacitor technology and cost reduction will still take some time. Therefore, lithium-ion battery technology, as a common energy solution for new energy vehicles in this era, has several advantages over other batteries: large capacity, no pollution, no memory effect, and high safety, making it a suitable secondary battery for various mobile devices. Currently, lithium-ion batteries are the best alternative for electric vehicle power batteries and are feasible.
To develop electric vehicles, it is essential to first develop the power batteries for electric vehicles, as the power battery is the energy provider for the vehicle’s movement. The quality of the battery determines the overall performance of the electric vehicle, making it the heart of the entire vehicle, while the battery management system acts as the brain of the electric vehicle.
The quality of the battery is a key indicator in the operation of new energy vehicles. The closer the energy storage characteristics are to traditional energy sources, the more widely they can be applied. Therefore, batteries need to have high energy density, high specific output power, convenient and time-saving charging, and low cost to be more readily accepted. At the same time, the battery must have a long service life, allow for long driving distances, and maintain stable performance to ensure safety during operation and compliance with relevant standards. Compared to other types of batteries, lithium-ion batteries have advantages such as low weight, small size, very low self-discharge current, and low energy loss. Lithium-ion secondary batteries can be recycled, have long operating times, and high energy density. Additionally, the materials used to manufacture lithium-ion batteries do not cause environmental pollution, making lithium-ion batteries the preferred choice for automotive batteries, and the use of lithium-ion batteries as power batteries for electric vehicles is a trend in the development of electric vehicles.
Lithium-ion batteries are products that follow lithium metal batteries and are safer than lithium metal batteries. The introduction of lithium-ion batteries, the commercialization of lithium-ion electric vehicles, and the formation and monopoly of the lithium-ion electric vehicle industry have been completed in several major economies worldwide. The United States, Japan, South Korea, Europe, and China are the main countries and regions for the research, production, and sales of lithium-ion batteries. The industry standards for lithium-ion batteries in China have been implemented, and the national development strategy for lithium-ion batteries (2018 Automotive Industry Blue Book) has been officially released in Beijing. The lithium-ion electric vehicle industry encompasses disciplines including chemistry, materials science, physics, automation, computer science, automatic control, electrical engineering, algorithms, and integrated circuits. Advanced lithium-ion BMS can significantly extend the lifespan of lithium-ion batteries and enhance the overall convenience of electric vehicles. Currently, integrated lithium-ion battery management systems are still under development, and there are not many types of lithium-ion battery management chips available. The technology for fast charging lithium-ion batteries is also kept confidential. The most advanced lithium-ion battery management methods are still at the theoretical stage, and implementing these theories in engineering practice remains very challenging.
Lithium-ion batteries are safer than lithium metal batteries. The model of lithium-ion batteries, such as 18650, indicates that the battery has a diameter of 18mm and a length of 65mm. The most valuable voltage range for lithium-ion batteries is 3.2-4.2 V. This voltage curve and SOC exhibit a basic linear relationship. After 3.2 V, the voltage of lithium ions will drop sharply, and it is also within the range of voltage rebound when the lithium-ion battery is at rest. Above 4.2 V, the voltage of lithium-ion batteries will surge, leading to irreversible damage due to overcharging.
The 18650 lithium-ion battery is a cylindrical battery with a diameter of 18mm and a length of 65mm, as shown in Figure 2.1, which illustrates the appearance of the 18650 lithium-ion battery.

Before disassembling the 18650 lithium-ion battery, it is necessary to completely discharge the battery. In this paper, the lithium-ion battery was discharged through a series resistor for 24 hours, and the battery was disassembled in an over-discharged state in the air. If the battery is disassembled while it still has charge, it may cause local temperature rise, smoke, or even fire.
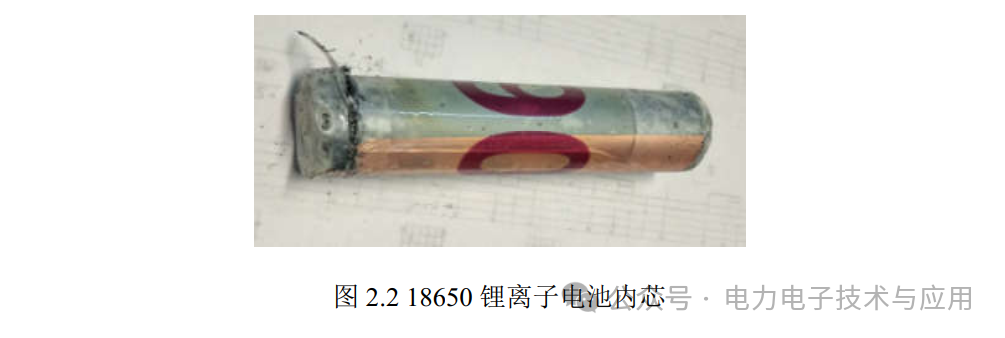
After removing the metal casing of the 18650 lithium-ion battery, multiple layers of metal foil can be obtained, where electrochemical reactions occur in the lithium-ion battery. The multi-layer metal foil increases the contact area for chemical reactions.

The dissection process of the lithium-ion battery is shown in Figure 2.3, where lithium salts are attached to the copper film, and the middle layer is an organic separator for the electrolyte, with a carbon layer attached to the aluminum layer below.
The electrochemical action of charging and discharging lithium-ion batteries involves the intercalation and deintercalation of lithium ions through the electrolyte between the positive and negative electrodes, as expressed by the chemical equation for standard lithium cobalt oxide batteries:

Lithium-ion batteries can be classified according to their chemical materials: lithium manganese oxide batteries, lithium iron phosphate batteries, lithium cobalt oxide batteries, lithium nickel oxide batteries, and ternary (nickel-cobalt-manganese) lithium batteries. Among these, lithium manganese oxide batteries are the cheapest; lithium iron phosphate batteries are the safest with the lowest voltage; lithium cobalt oxide batteries have the highest voltage; and ternary lithium batteries are the most expensive with the best overall performance.
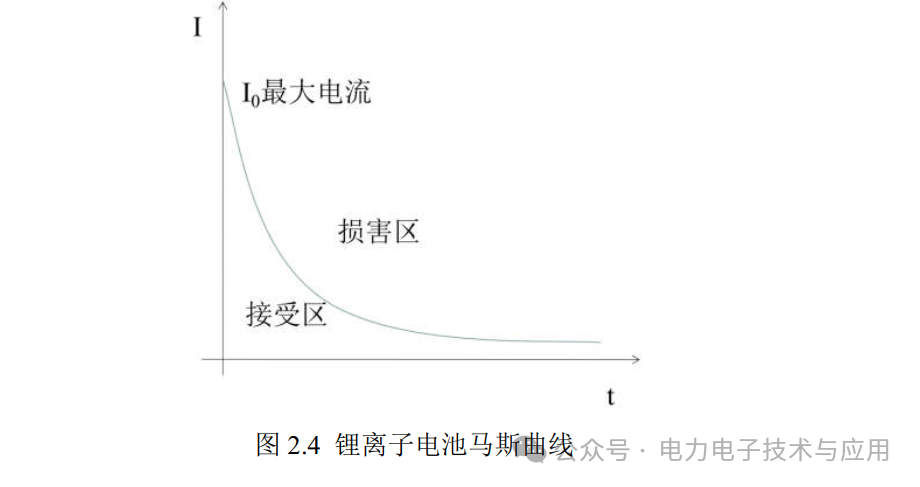
The charging methods for batteries can be broadly divided into: float charging, constant current constant voltage, constant voltage current limiting, pulse charging, and fast charging. Float charging is suitable for lead-acid batteries, where the maximum voltage of the battery is directly applied, allowing current to flow into the battery without restriction. This method is not suitable for lithium-ion batteries, as float charging is very dangerous for them. Constant current constant voltage charging maintains a consistent current until the charging voltage reaches the maximum cutoff voltage, after which the voltage is kept constant while limiting the charging current to achieve safe charging. Pulse charging has been patented by a U.S. company. The principle of fast charging is based on the Mas curve (as shown in Figure 2.4), where lithium-ion batteries can accept the maximum current within a unit time. Therefore, in the initial stage, a large current can be used to charge the lithium-ion battery in a short time.
2.2 Testing Characteristics of Lithium-Ion Batteries
The charge of lithium-ion batteries is related to temperature, making it difficult to directly measure the charge of lithium-ion batteries. The internal structure of lithium-ion batteries is complex, and estimation methods must be used to determine their charge. The overall capacity of a battery pack is the sum of the minimum charge held by each individual battery at a given moment and the minimum charge that can be added. Through scatter plots of battery pack capacity and charge, the relationship between battery pack capacity and individual battery capacity is visually presented. According to the results of this paper’s battery pack capacity graph and charge scatter plot, the capacity and charge calculated after the scatter plot of the battery pack are both less than that of each battery unit, similar to how a wooden barrel’s water capacity is less than that of the shortest plank. The overall performance of the battery pack is significantly worse than that of the worst individual battery within the pack. Therefore, balancing of lithium-ion batteries is particularly important. Not only does balancing meet the operational needs of the battery, but it also improves the efficiency of the battery pack and extends its lifespan. Consequently, many experts and scholars have researched various balancing methods for lithium-ion battery packs and discussed the future development of battery pack balancing technology.
The power supply batteries for new energy vehicles consist of dozens to hundreds of individual batteries connected in series and parallel. Only when the performance of all individual batteries is kept as consistent as possible can the entire battery pack operate stably and normally, achieving the best working state for electric vehicles. The principle of lithium-ion battery balancing can be likened to the barrel effect, where the shortest plank determines the maximum capacity of the barrel. Therefore, monitoring each individual battery in the battery pack is crucial. Monitoring each battery unit can effectively estimate the SOC of the battery, improving the overall energy utilization of the vehicle, ensuring driving safety, and extending the battery’s lifespan.
Electric vehicles require multiple individual lithium-ion batteries to be connected in series and parallel to provide power energy. Different electric vehicles with varying operating powers and different discharge rates have different requirements for the capacity of the battery pack. However, various environmental factors can affect the production processes of batteries, and even among batteries produced in the same batch, there are inevitable inconsistencies between individual units. When assembling battery packs, it is advisable to select individual batteries with similar performance together to ensure consistency in the initial working state, but it cannot guarantee that the capacity degradation differences among individual batteries will synchronize during long-term use. This difference will become more pronounced over time during operation. If balancing is not performed and the situation deteriorates, it may lead to individual batteries being overcharged or over-discharged, potentially causing battery runaway, fire, or explosion.
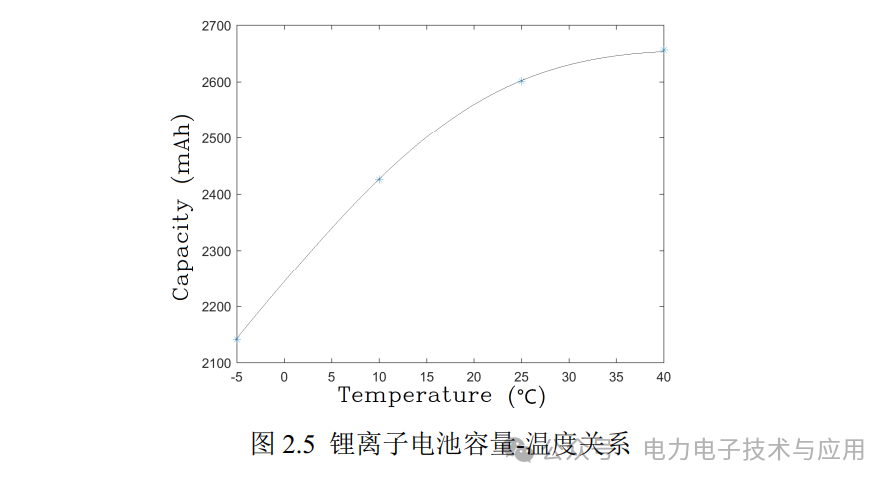
Temperature has a significant impact on the charge of lithium-ion batteries, and the relationship between battery capacity and temperature is shown in Figure 2.5, where the capacity parameters of lithium-ion batteries are measured at temperatures of -5 °C, 10 °C, 25 °C, and 40 °C. From the figure, it can be seen that as the temperature decreases, the capacity of lithium-ion batteries continues to shrink. As the temperature increases, the capacity of lithium-ion batteries will continue to rise. When the ambient temperature reaches 35 °C, the increase in capacity with temperature will slow down. This lithium-ion battery is a Panasonic 18650 battery with a nominal capacity of 2600 mAh, and 25 °C is the most suitable temperature for this battery. At the same time, the capacity of lithium-ion batteries is also related to the state of health (SOH) of the battery, with capacity decreasing as the battery ages.
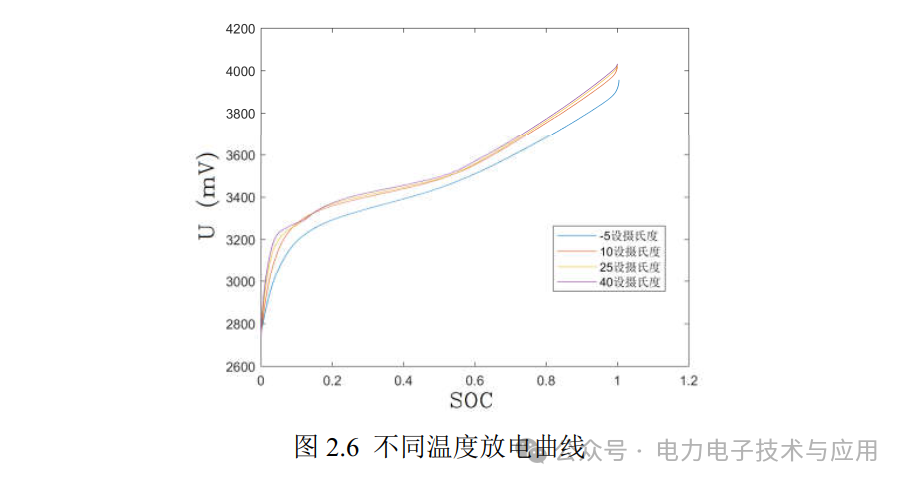
Figure 2.6 shows the discharge characteristic curves of lithium-ion batteries at -5 °C, 10 °C, 25 °C, and 40 °C at a 0.3 C discharge rate. From the figure, it can be seen that in cold environments below -5 °C, the performance of lithium-ion batteries is poor, and the output voltage is significantly lower. Above zero degrees, as the temperature increases, the output voltage of lithium-ion batteries increases, and as the discharge process continues, the battery itself generates heat, improving its performance.
The discharge characteristics of lithium-ion batteries exhibit a voltage hysteresis effect, which is due to the significant lag of the voltage of lithium-ion batteries behind the output voltage due to voltage division. Moreover, the larger the discharge rate, the more pronounced the hysteresis effect.
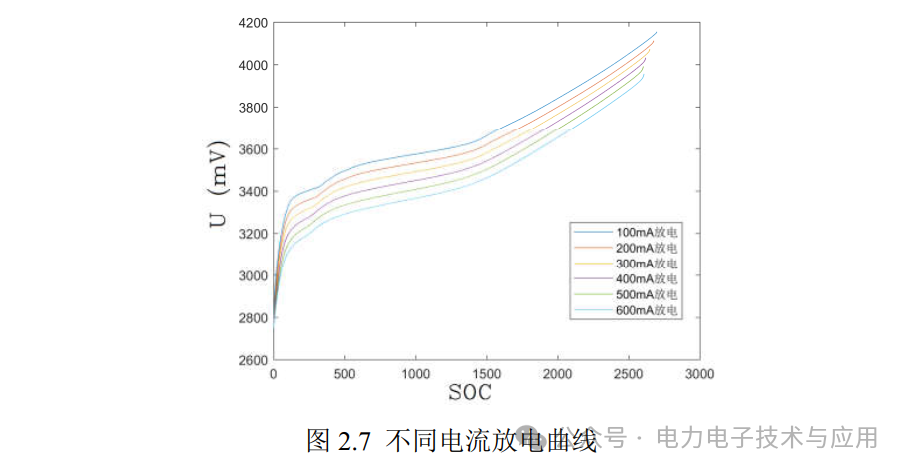
Figure 2.7 shows the discharge curves of lithium-ion batteries at different currents, with six different current discharge characteristic curves at a temperature of 25 °C. Discharge occurs from 4.2 V to 2.75 V, and the discharge SOC is calculated using the ampere-hour integration method. The discharge characteristics indicate that the larger the output current of the lithium-ion battery, the smaller the output voltage.
2.3 Establishment of Lithium-Ion Battery Models
Due to the complexity of the electrochemical model of lithium-ion batteries, there is currently no fully fitted circuit model that can reflect all the characteristics of lithium-ion batteries. This paper briefly describes four types of lithium-ion battery models, with a focus on the Thevenin model. All model components include: resistors, capacitors, and voltage sources. The testing standards and measurement methods for various parameters of battery models are not fixed, and the model fitted at the factory differs from the model fitted after multiple uses of the battery.
The proposed model must have theoretical or practical value. Currently, the applicable range of various models varies, and the precision and computational load required by different algorithms determine which model to choose. The internal resistance model is the simplest battery model, as shown in Figure 2.8, which is equivalent to a voltage source in series with an internal resistance. It is also the most classic model; when the output resistance equals the internal resistance, the battery will output maximum power. The internal resistance of the internal resistance model changes and is related to SOC, temperature, battery life, etc. Therefore, it can be generalized to the internal resistance polarization model, which is an internal resistance in series with a polarization resistance.

The internal resistance model is the simplest lithium-ion battery model, as it ignores many circuit parameters and cannot describe the polarization and charge accumulation phenomena of lithium-ion batteries during operation. Therefore, the internal resistance polarization model, as shown in Figure 2.9, is adopted.

The main process for calculating the testing method of the internal resistance model is as follows: first, measure the open-circuit voltage curve, then calculate the internal resistance using the load output voltage and output current.
The following equation will hold:

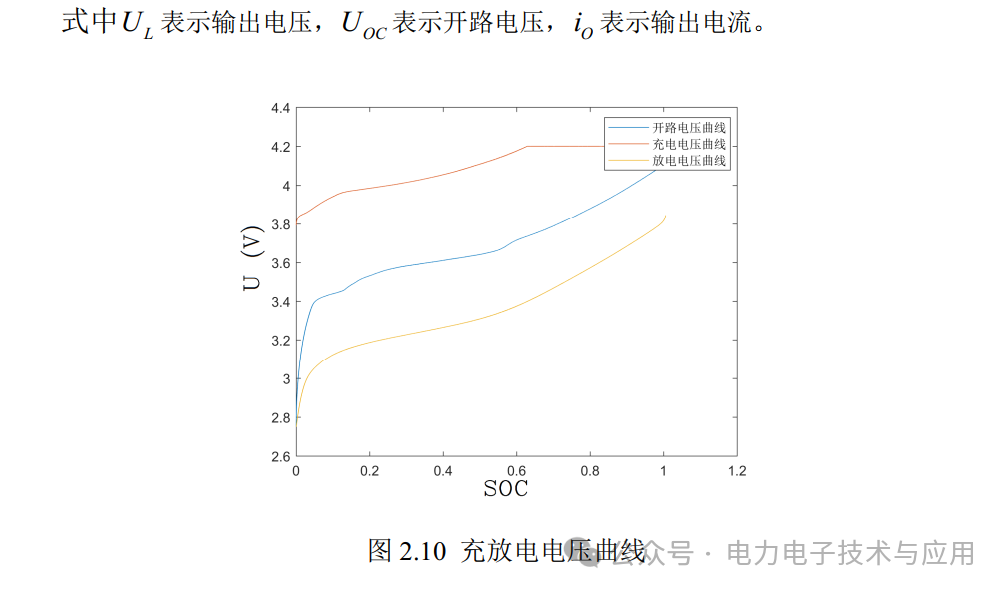
Figure 2.10 shows the charging and discharging voltage curves, where the experimental data indicates that the charging current is 800 mA, and the charging process uses constant current constant voltage charging; the discharging current is 800 mA, and discharging occurs from SOC 100% down to a voltage of 2.75V. During the charging and discharging process, the voltage range is from 2.75 V to 4.2 V, and at this time, the SOC range is not from 0% to 100%, so the calculated internal resistance value is not the true internal resistance in the complete sense.
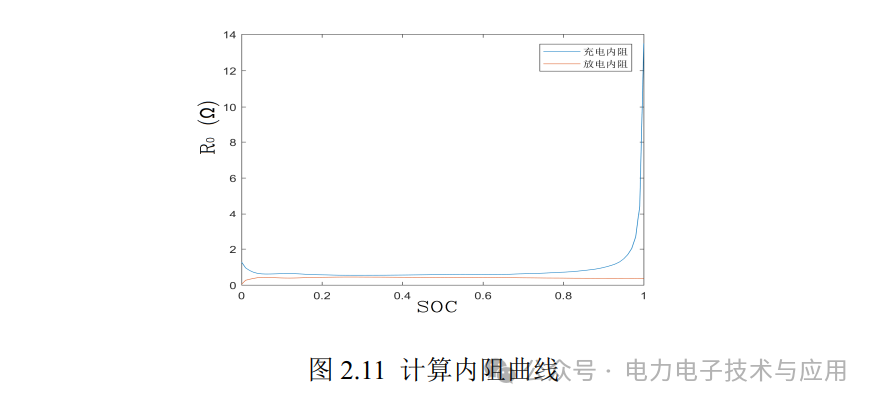
The internal resistance curve of the lithium-ion battery calculated using Equation 2.2 is shown in Figure 2.11, indicating that the charging internal resistance is greater than the discharging internal resistance, and the charging internal resistance curve rises sharply in the later stages of constant voltage charging, indicating that the current flowing in decreases sharply as the lithium-ion battery approaches full charge. These phenomena are caused by the lithium-ion battery’s capacity rebound, hysteresis, polarization, and other chemical phenomena, so the initial and final internal resistances do not equal the true internal resistance. According to national standards for testing lithium-ion batteries, distinguishing between the charging and discharging phases of lithium-ion battery parameters is beneficial for improving estimation accuracy.
The PNGV model is more complex than other models, as it is derived from pulse discharge. The PNGV model requires the main principles of circuit analysis. The PNGV model is shown in Figure 2.12, where Cp represents the open-circuit voltage change caused by the cumulative load current over time, R0 is the internal resistance, C1 is the polarization capacitance, and R1 is the polarization resistance.

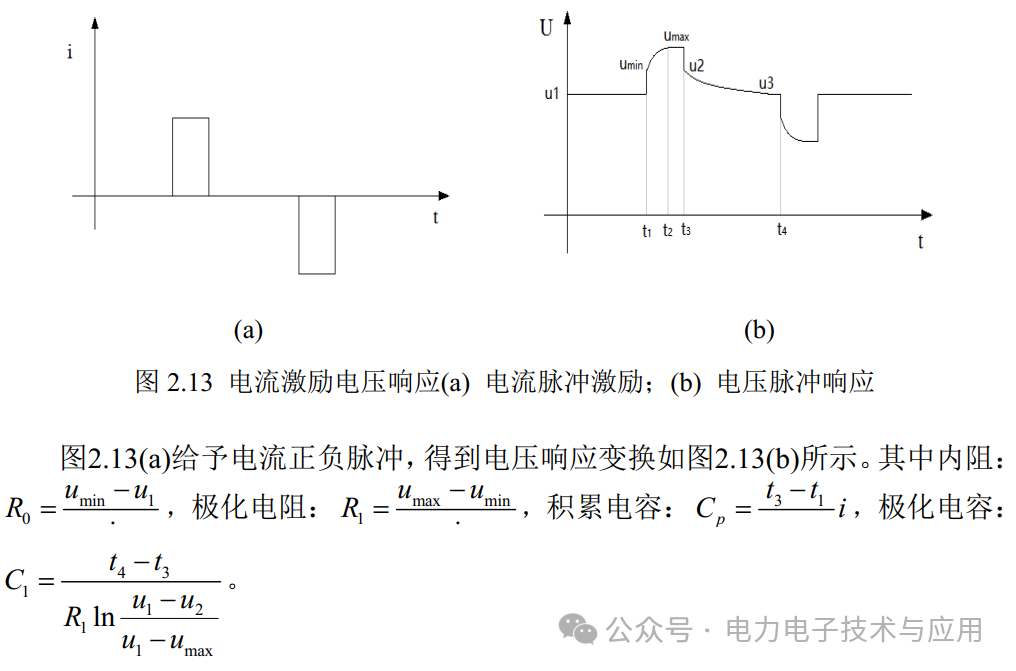
The measurement method for the PNGV model, as shown in Figure 2.13, involves applying rectangular current pulses to the lithium-ion battery, where current serves as the excitation and voltage as the response. By obtaining the voltage response of the lithium-ion battery, the main parameters of the PNGV model can be quickly calculated.
The measured current excitation voltage response is shown in Figure 2.14. The measured pulse graph can calculate the parameters of the battery model. However, it is evident that the effects of polarization resistance and polarization capacitance are minimal in a short time, and the effect of the battery’s Cp accumulation voltage is prominent.
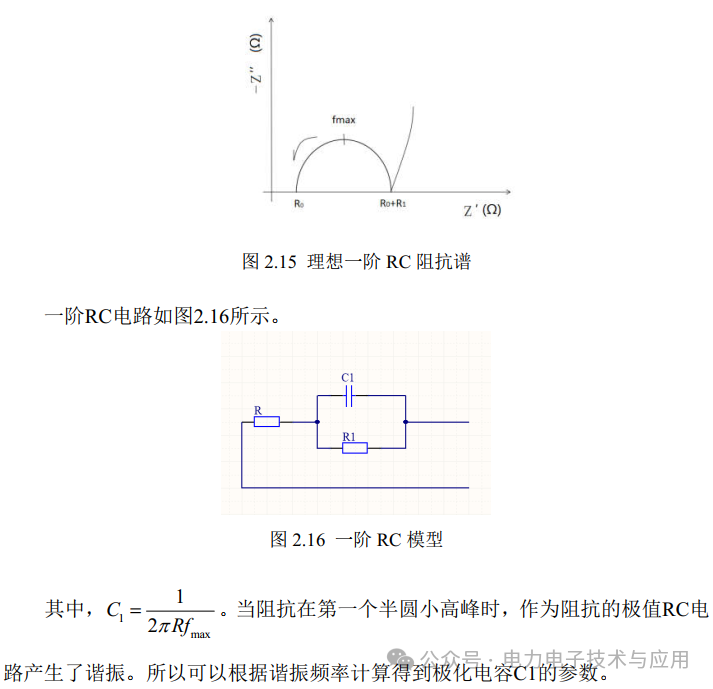
The Thevenin equivalent circuit model of lithium-ion batteries is shown in Figure 2.17. This paper extends the Kalman filtering algorithm using this model, which can represent the polarization effects generated during the charging and discharging of lithium-ion batteries.
2.4 Testing Methods for Battery Model Parameters
There are various methods for measuring the circuit model parameters of lithium-ion batteries, with the main method being circuit characteristics fitting to build the circuit model. Different testing methods for model parameters can lead to inconsistent standards. The circuit model mainly includes resistors, inductors, capacitors, and power sources. Open-circuit methods, impedance methods, charge and discharge measurements, and excitation state responses are all optional methods. However, the complex electrochemical reactions of lithium-ion batteries make it difficult to fully simulate them with just a few electronic components. Therefore, various testing methods for model parameters can refer to each other.
The impedance spectrum method involves applying a frequency-varying sine AC voltage to the model and measuring the model’s impedance under the action of a bridge. The impedance is calculated at each frequency, and a point is plotted, connecting the measured points to create an impedance spectrum. The impedance spectrum of lithium-ion batteries at the factory is very standard, and during use, SOC and temperature will affect the parameters of the impedance spectrum. By using online impedance spectrum data, one can refer to tables to determine the charge state and environmental conditions of lithium-ion batteries.
The pulse method is based on excitation response, where excitation stimulates the circuit to produce electrical phenomena, and then the response is measured to derive the circuit parameters. There are many types of excitation, and to simplify calculations, using rectangular current pulse excitation is the best approach. By applying positive and negative pulses to excite the lithium-ion battery, the response graph can be analyzed to derive model parameters.
2.5 Genetic Algorithm Optimization of the Thevenin Model for Lithium-Ion Batteries
Although the model parameters have been fully measured, the compatibility and adaptability of the model parameters and algorithms need to be improved based on the different states of lithium-ion batteries. This paper adopts optimization algorithms to ensure that the measured model parameters can adapt well to the SOC estimation algorithm, improving the practicality and accuracy of the entire system. Usable improvement algorithms include genetic algorithms and simulated annealing algorithms, both of which operate by generating random subsets and selecting the optimal results.
This paper mainly uses genetic algorithms for optimization, and the flowchart for optimizing parameters using genetic algorithms is shown in Figure 2.22. The main steps include: generating the initial population, calculating the optimal value, eliminating inferior individuals, exchanging chromosomes, mutating, and producing the next generation population. Through continuous iteration and reproduction, the best individual is obtained, with the error reduced to a point where it does not significantly change the population, reaching the optimal value point. The values of the best individuals will serve as the standard values for the model parameters.
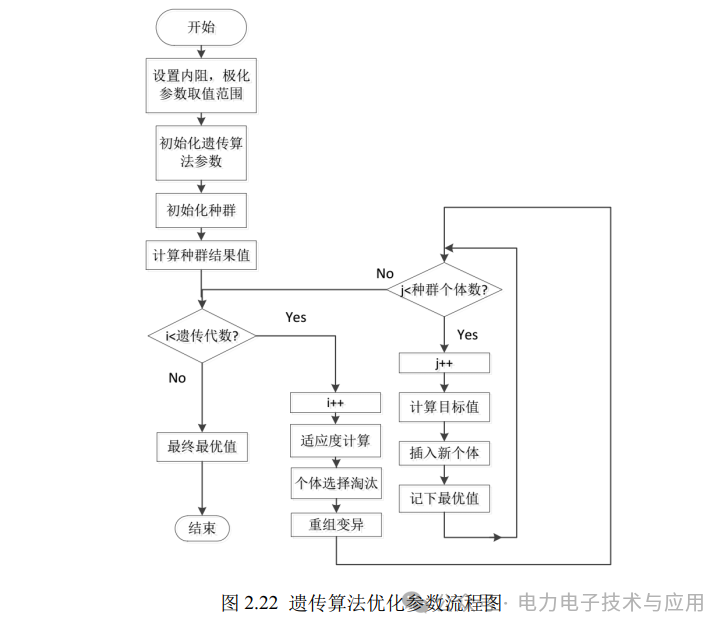
Table 2.1 shows the measured impedance parameters of the battery at the factory. The internal resistance, polarization capacitance, and polarization resistance can be observed through the impedance spectrum. Through iterations using the genetic algorithm and the accuracy of the extended Kalman filter model results, these serve as the fitness criteria for the genetic algorithm. The best parameters of the improved Thevenin model obtained through evolution are as follows.

After obtaining the internal resistance value R0*, polarization resistance R1*, and polarization capacitance C1* from Table 2.1, charging and discharging data are used to optimize the circuit parameters using the genetic algorithm. The circuit adopts the lithium-ion battery charging and discharging isolation model shown in Figure 2.23, where the diode is an ideal diode that conducts unidirectionally without voltage drop. The elimination criteria use the error between the extended Kalman filter and the standard values from the new battery testing machine. The optimal genetic algorithm individual is the best circuit parameters compatible with the extended Kalman filter, so the optimal genetic algorithm individual is not the optimal value of the lithium-ion battery model, but rather the optimal value of the lithium-ion battery model that is compatible with the extended Kalman filter.
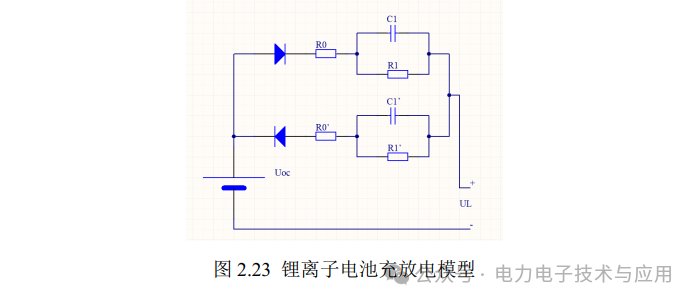
Figure 2.23 shows the lithium-ion battery charging and discharging model. The results of the genetic algorithm indicate that in the extended Kalman filter estimation SOC algorithm, the charging internal resistance is much greater than the discharging internal resistance, and the charging polarization resistance is also greater than the discharging polarization resistance.
The principle of implementing the genetic algorithm is to use the parameters from the factory impedance spectrum as the initial parameters for the initial population. Through continuous mutation and chromosome exchange, the internal resistance and polarization parameters are adjusted into the extended Kalman filter function for optimization. The filter function uses the variance of the error between the extended Kalman filter and the standard values from the battery testing machine as the fitness evaluation criterion. The variance of the error serves as the requirement for eliminating inferior individuals, with the individual having the smallest error variance being the optimal individual of this population. This genetic algorithm calculation takes about 2 days on a desktop with an i5 processor to complete 100 generations, resulting in the optimal individual being very close to the best performance point.
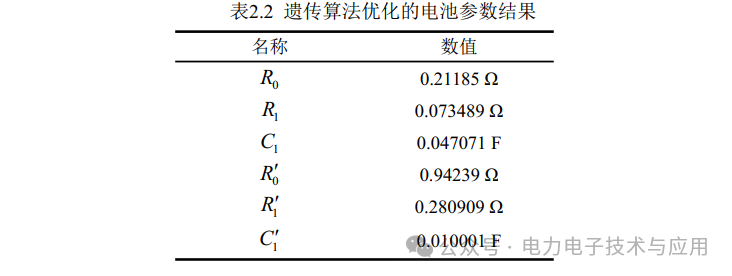
The results of the battery parameters optimized by the genetic algorithm are shown in Table 2.2.
Chapter 3 Improved Extended Kalman Filter Estimation of Lithium-Ion Battery SOC
Some content omitted…….
3.3 Implementation and Testing Data Analysis on Various Platforms
The SOC estimation algorithm for lithium-ion batteries will be implemented on the MATLAB platform, and the mathematical matrix expressions will be broken down into arithmetic expressions for implementation in C language. The computational efficiency of C language is much higher than that of MATLAB, and it is convenient for deployment on various embedded chips. The implementation process of the algorithm includes the battery charging and discharging arrays measured from the battery testing machine, as well as the lithium-ion battery management system built using Hall elements and battery inspection instruments to achieve real-time online estimation of the SOC of lithium-ion batteries on LabVIEW.
3.3.1 Implementation on DSP Platform
After implementation on the MATLAB platform, the code is implemented in C language. The project is then burned into the FLASH of the DSP development board using CCS6.1.1, as shown in Figure 3.15 DSP platform, and runs on the F2812 chip.
In this experiment, the voltage and current data from the battery testing machine are stored in FLASH in the form of static arrays, using the watchdog timer interrupt of the F2812 to call one voltage and one current at regular intervals, and the SOC is calculated using the extended Kalman filter, as shown in Figure 3.16, which is the DSP program flowchart. The SOC is displayed in real-time on a 4-digit 8-segment display, and a charging indicator light will continuously show whether the charging state has ended. This process demonstrates the feasibility of transplanting Kalman filtering into embedded systems.
When implementing in C language, a function is used, and the parameters of the extended Kalman filter are declared as global variables. Each time the function runs, the parameter data of the extended Kalman filter in the global variables is updated. The embedded chip is set with a timer to execute the extended Kalman filter function once every time the predetermined time is reached, achieving data refresh.
3.3.2 Extended Kalman Filter
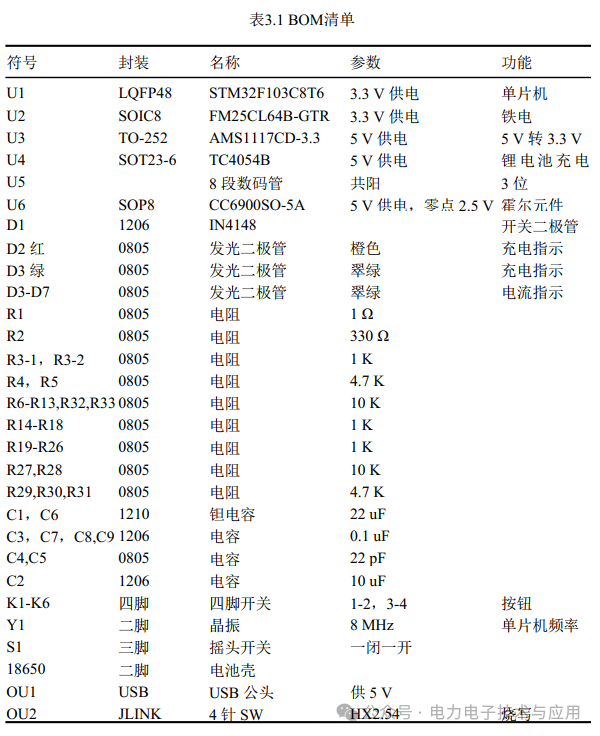
The extended Kalman filter is implemented using the STM32 microcontroller. Figure 3.17 shows the schematic diagram of the Kalman filter, indicating that the external interfaces of this Kalman filter include a JLINK microcontroller debugging 4-pin connector, a USB-5V power supply header, and the entire system is powered by 5 V. The circuit chip is powered by 3.3 V provided by a voltage regulator chip, and the voltage signal acquisition uses a 10 K resistor voltage divider circuit to supply voltage to the MCU’s ADC. The current signal acquisition uses a Hall element outputting a voltage signal with a zero point of 2.5 V to supply voltage to the MCU’s ADC. The lithium-ion battery charging circuit uses a lithium-ion battery charging chip for supply. The display includes 5 LED green lights indicating current size, showing charging speed. A 3-digit common anode 8-segment display shows the current SOC value. It also includes a ferroelectric chip to record charging data and battery status for calibration and key data storage. The functions of the 6 buttons implement switching and calibration between open-circuit voltage, ampere-hour integration, and Kalman algorithm. One 18650 battery shell is used to load and unload the lithium-ion 18650 battery. The key circuits of the entire system include the three essential elements for the microcontroller operation, a 3.3 V power supply circuit, an 8 MHz crystal oscillator circuit, and the MCU power-on reset circuit. BOOT0 is grounded with a 10 K resistor, which helps reduce power consumption. A toggle switch can manually switch the charging current; when the charging current is below the minimum current, the lithium-ion battery charging chip will light up the green LED. When the charging action is in progress and the current is greater than the minimum current, the lithium-ion battery charging chip will light up the orange LED.
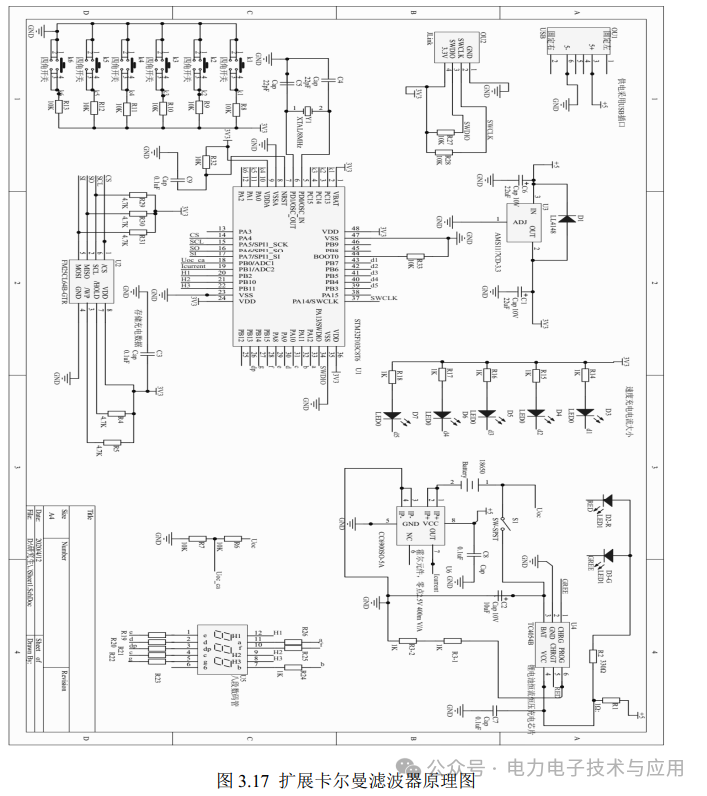
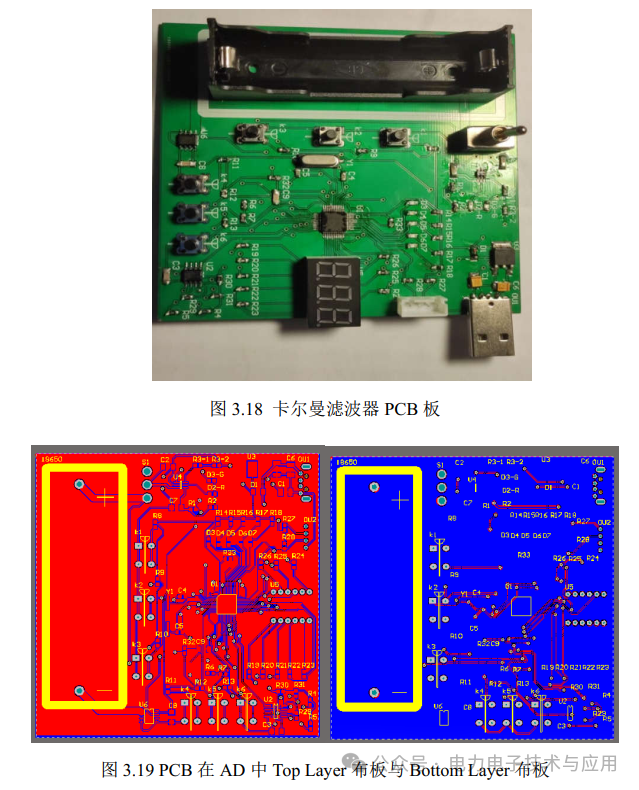
Figure 3.18 shows the PCB board of the Kalman filter, a two-layer Kalman filter PCB board measuring 10*10CM. The top and bottom layers are laid out as shown in Figure 3.19. The STM32 microcontroller circuit is complex, using vias to reduce wiring density. The minimum package is 0805, facilitating manual soldering. The board has lithium-ion 18650 battery charging capabilities and can switch online between open-circuit voltage algorithms, ampere-hour integration algorithms, and extended Kalman filter algorithms. The ferroelectric chip can record the entire charging process of the lithium-ion battery, including current and voltage data. The communication protocol between the ferroelectric chip and the microcontroller is SPI, and the ferroelectric chip has a storage capacity of 8 K, capable of recording over 8192 sets of 8-bit data, fully meeting the data needs of this system. As this Kalman filter is the first version, improvements are still needed for the collection of voltage and current data. The voltage can meet the requirements using a voltage divider circuit, but the current measurement using a Hall element has a significant error. Therefore, continuous improvements are needed in practice, such as using operational amplifiers for high-end voltage sampling resistor circuits to achieve accurate current sampling.
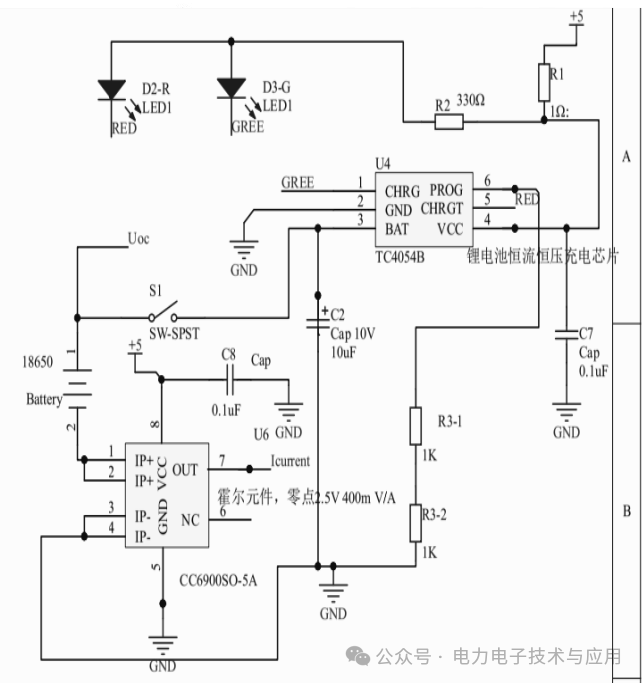
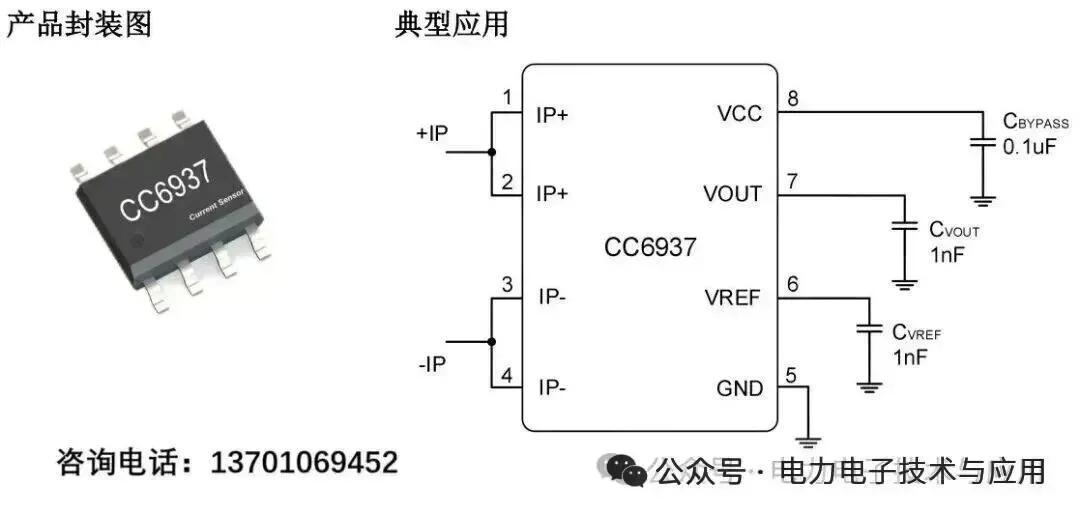
The CC6900SO in the circuit is a high-performance single-ended output linear current sensor produced by Chengdu Xinjing Electronics, which can effectively detect AC or DC current, widely used in industrial, consumer, and communication devices.
The product has now been upgraded to CC6937,CC6937 internally integrates a high-precision, low-noise linear Hall circuit and a low-impedance main current conductor. The ultra-low impedance conductor of 0.5mΩ minimizes power loss and thermal dissipation.
Features
-
Reference has both built-in VREF output and external VREF input modes:
-
When using built-in VREF output, VOE can be programmed to < 5mV
-
When using external VREF input, VOUT static output voltage remains consistent
-
Wide measurement range, with multiple ranges available from 5A to 60A
-
High isolation voltage, with a safety isolation voltage of 3750VRMS between the wire pins and signal pins
-
High bandwidth (230kHz), low noise, single-ended analog output
-
Low loss, with a wire resistance of 0.5mΩ
-
Step response time of 1.5us
-
Common temperature error of ±1%, with sensitivity temperature drift reaching ±2.5%
-
Good temperature stability, using Hall signal amplification circuits and temperature compensation circuits
-
Differential Hall structure, with strong resistance to external magnetic interference
3.3.3 Stage-Based Estimation of Lithium-Ion Battery SOC Based on LabVIEW
The stage-based management technology for lithium batteries proposes using different SOC estimation algorithms at different stages. When the lithium-ion battery is at rest, using the open-circuit voltage method to estimate its SOC is the appropriate estimation method for this stage, and the SOC value at this time can serve as the initial value for starting the extended Kalman filter, being very accurate and convenient. The constant voltage charging stage can ensure that the lithium-ion battery is fully charged, and using ampere-hour integration during the charging stage is feasible. The SOC value corresponding to the minimum cutoff current time can be converted to determine the current capacity of the lithium-ion battery.
Using the extended Kalman filter during the charging stage is optimal, as the fully charged lithium-ion battery charging process can ensure the convergence of the extended Kalman filter error. The extended Kalman filter performs poorly during the discharging stage because the SOC does not equal 0 when the discharge voltage reaches the minimum cutoff voltage, while the lithium-ion battery management system must disconnect for protection, leading to prediction failure of the extended Kalman filter. Therefore, during the discharging stage, using the online open-circuit voltage method is more appropriate.
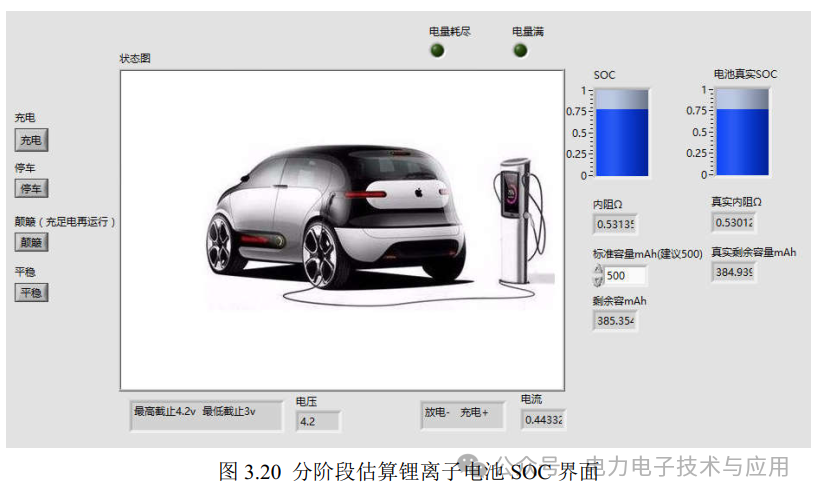
Figure 3.20 shows the interface for stage-based estimation of lithium-ion battery SOC. According to the analysis of the test results from the virtual instrument, when the lithium-ion battery switches between online open-circuit voltage and extended Kalman filter for stage-based management, the SOC value can achieve continuous transformation, and during charging, parking, and stable operation stages, the SOC value remains stable and reliable, with smooth data display.
Chapter 4 Design and Implementation of Control Circuit for Low SOC Lithium-Ion Battery Replacement
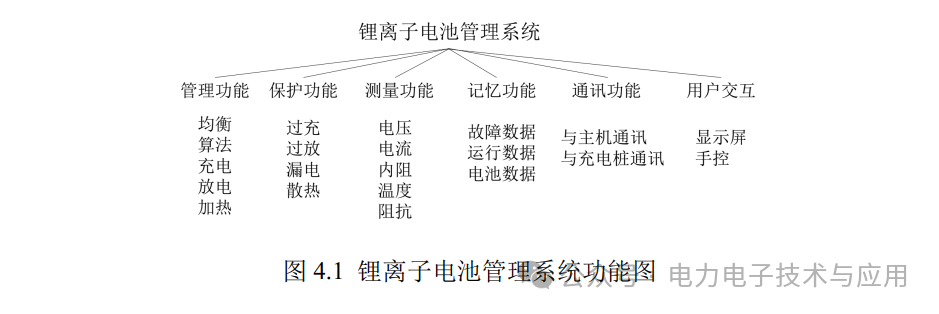
Currently, there are mature large-scale lithium-ion battery management system products and projects available for sale on the market, and various small enterprises design small lithium-ion battery management boards that can be easily purchased online. Therefore, the basic structure of lithium-ion battery management systems has formed, as shown in Figure 4.1, which illustrates the functional diagram of the lithium-ion battery management system. A complete and ideal lithium-ion battery management system should include management functions, protection functions, measurement functions, memory functions, communication functions, and user interaction functions. The complete concept of an ideal lithium-ion battery management system is as follows:
4.1 Battery Balancing Protection System
The role of the balancing circuit is to achieve energy balance, which is externally manifested as equal voltage across each lithium-ion battery, as shown in Figure 4.2, which illustrates the balancing principle. The purpose of balancing is to extend the service life of the lithium-ion battery pack and improve the operational efficiency of the lithium-ion battery pack. Balancing is beneficial for the entire battery management system, ensuring that each battery unit remains balanced after multiple charge and discharge cycles, preventing any single battery from being overcharged or over-discharged in a series configuration. The barrel effect indicates that the shortest plank determines the water capacity of the entire barrel, and the energy storage capacity of the lithium-ion battery pack is similar to the result of the barrel effect. Discharge balancing can improve the SOC utilization and total amount of the entire series of lithium-ion batteries, while charge balancing can shorten charging time.

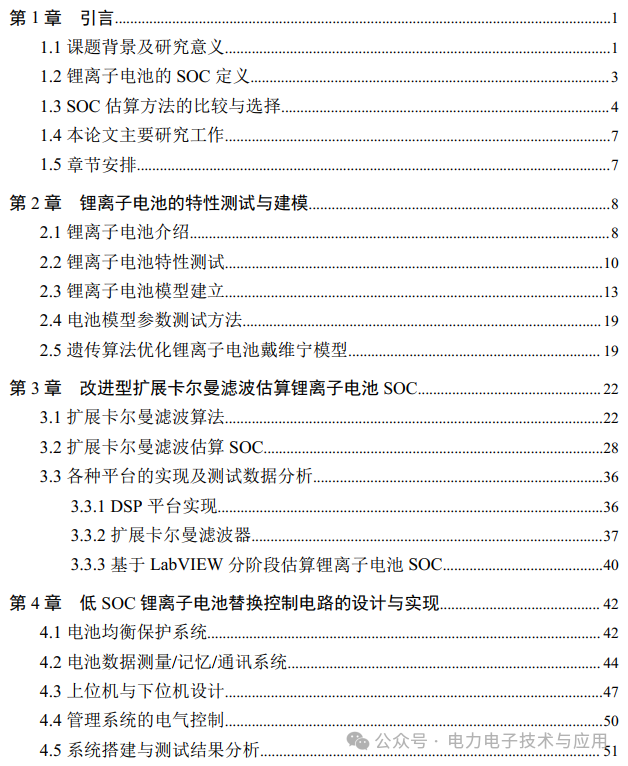
Due to space limitations, only part of the content is displayed in this article.
If you need the original text, please contact [email protected] for a free copy, for learning and reference only.
This article is compiled by the author from content on the internet, and thanks are given to the original authors. If there are any infringements, please contact the author for removal.
For more information on power electronics, please contact 13701069452 or follow the public account.