Paper
S
N
◀
Recommended Paper
▶
Equivalent Circuit Models Assist Machine Learning: A New Method for Battery SOC Estimation Based on EIS Data


01
Abstract
This paper focuses on the estimation of the state of charge (SOC) of batteries, proposing a lightweight SOC estimation method that combines machine learning with equivalent circuit models, based on electrochemical impedance spectroscopy (EIS) data, to address the pain points of existing technologies in practical applications. Accurate SOC estimation is crucial for the reasonable management and safe operation of systems such as electric vehicles, smart grids, and portable electronic devices. An excessively high or low SOC can irreversibly damage the battery and pose safety risks. Lithium batteries are a mainstream choice in many applications, but their SOC cannot be accurately measured outside the laboratory, necessitating reliance on indirect estimation methods in real-world scenarios.
02
Background
Limitations of Existing Technologies:
Direct measurement methods have poor practicality: The coulomb counting method suffers from cumulative error issues, while the open-circuit voltage lookup method is only applicable to batteries in a static equilibrium state, failing to meet online estimation needs.
Traditional estimation methods have shortcomings: Model-driven methods rely on precise battery models and are significantly affected by measurement noise and parameter drift; purely data-driven machine learning methods (especially deep learning) require large amounts of data, are time-consuming to train, are prone to overfitting with limited data, and do not adequately consider individual differences among batteries of the same model.
Insufficient application of EIS data: EIS contains rich information about battery material characteristics and interfacial phenomena, but the effectiveness of combining EIS data with equivalent circuit models (ECM) has not been clearly validated in existing research, and the accuracy of directly applying raw impedance data is limited.
To address the shortcomings of existing SOC estimation methods in terms of data requirements, training efficiency, generalization ability, and practical applicability, this study develops a low-complexity, efficient SOC estimation scheme suitable for real-world scenarios (such as online estimation in vehicle systems) by leveraging the informational advantages of EIS data, while also validating the role of ECM in enhancing the utilization and accuracy of EIS data.
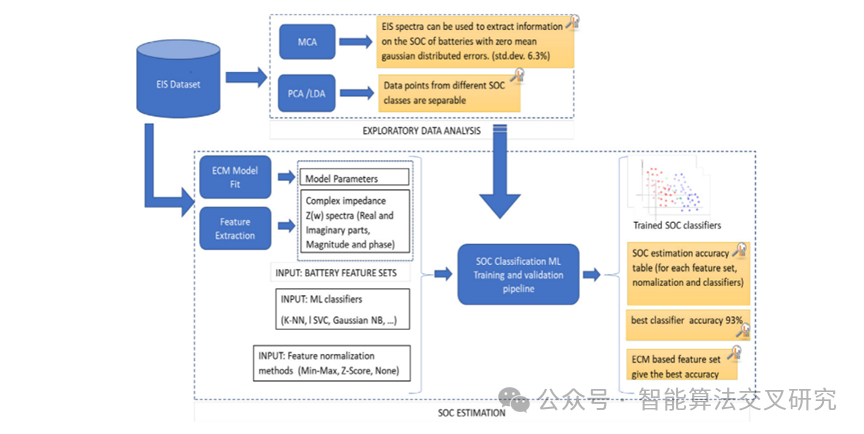
The following diagram illustrates the workflow of this research:
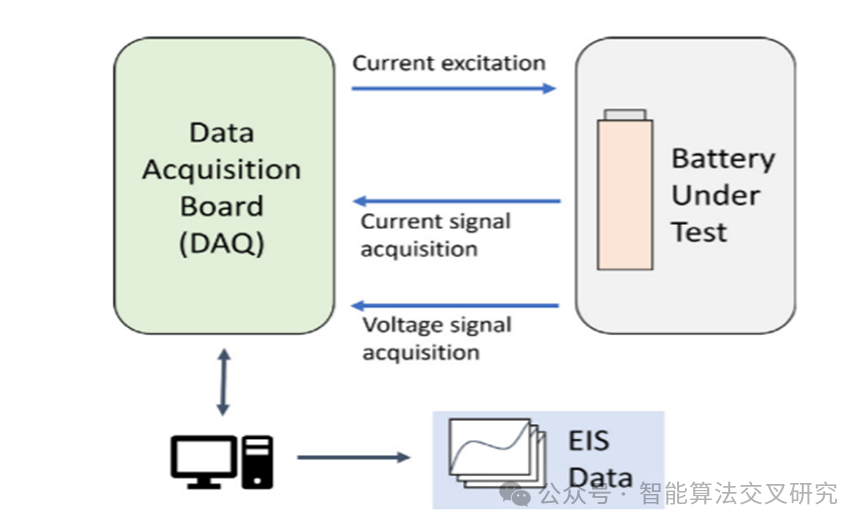
The EIS measurement system architecture used in this study:
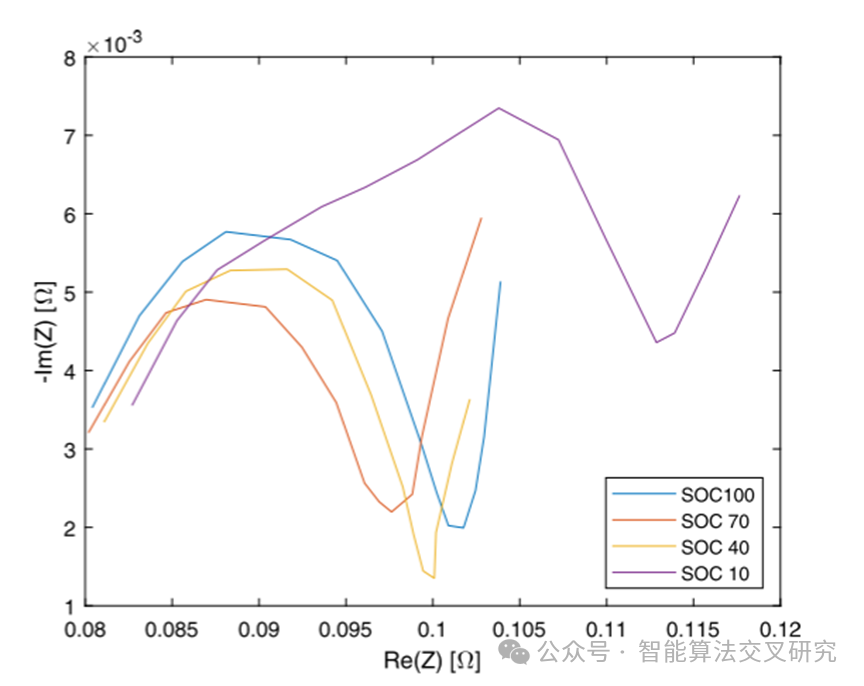
EIS prediction results under different SOC conditions:
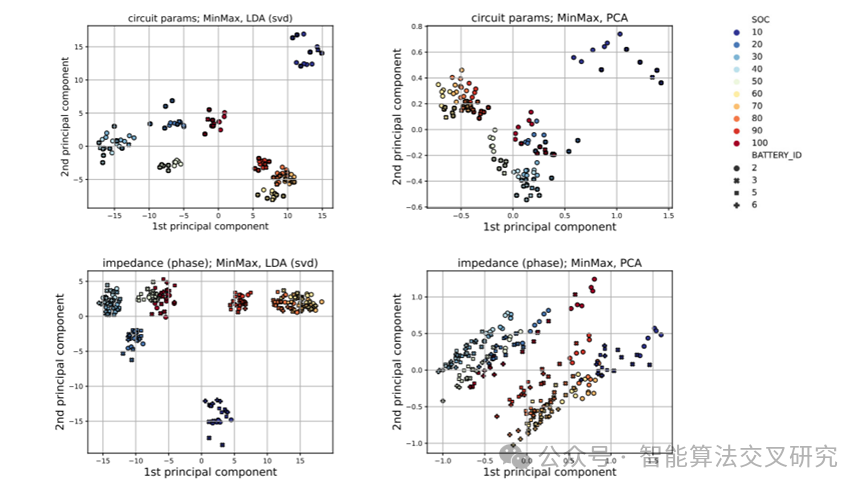
Visualization results of exploratory data analysis:
03
Research Methodology
The research methodology can be summarized as “multi-dimensional data collection → physical + data-driven feature engineering → exploratory data analysis → machine learning model optimization,” as follows:
1. Data Collection
Select multiple lithium-ion batteries and conduct six repeated electrochemical impedance spectroscopy (EIS) measurements for each battery within the SOC range of 10% to 100%, obtaining raw data that includes the real part, imaginary part, magnitude, phase, and other dimensions to ensure data repeatability and diversity.
2. Feature Engineering
Raw EIS features: Directly extract multi-dimensional features such as the real part, imaginary part, magnitude, and phase of the impedance.
Equivalent Circuit Model (ECM) features: Fit the EIS data to a 7-parameter equivalent circuit model to obtain physically meaningful dimensionality-reduced features.
3. Exploratory Data Analysis (EDA)
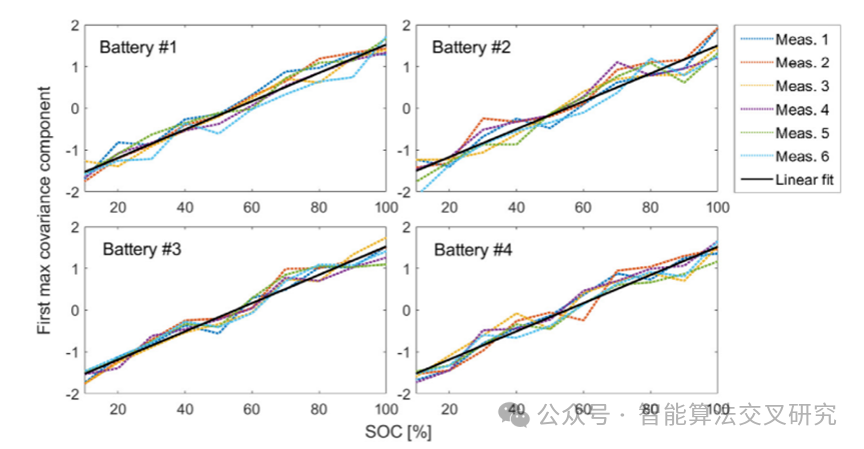
Maximum Covariance Analysis (MCA): Analyze the linear correlation strength between EIS features and SOC, verify the Gaussian characteristics of the error distribution (mean 0, standard deviation 6.3%), and quantify the linear fitting parameters (Pearson coefficient, slope, intercept) of the features with SOC.
Principal Component Analysis (PCA) and Linear Discriminant Analysis (LDA): Compare the distinguishing ability of different feature sets (ECM parameters, impedance phase) after dimensionality reduction to visually validate the superiority of ECM parameters.
4. Machine Learning Model Training and Validation
Models and configurations: Select classifiers such as KNN, SVC, Gaussian Naive Bayes, etc., paired with normalization methods like Min-Max scaling and Z-score standardization to construct a multi-combination experiment of “feature set + normalization + classifier.”
Evaluation and optimization: Using SOC classification accuracy as the core metric, compare the performance of different combinations to ultimately determine the optimal scheme (ECM parameters + Min-Max + KNN, accuracy 93.9%).
This method achieves high-precision SOC estimation based on EIS through a strategy of combining physical models with data-driven approaches, multi-dimensional analysis, and machine learning validation, while theoretically and experimentally verifying the reliability and universality of the method.
04
Results Overview
Verification diagram of the correlation between SOC and core features based on MCA
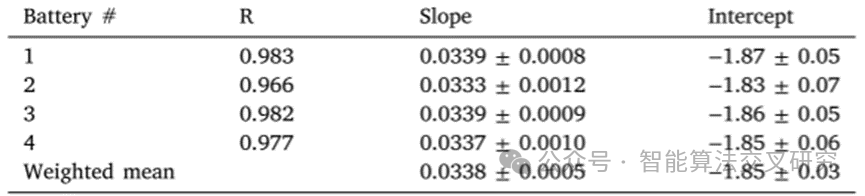
Pearson coefficient R, slope, and intercept of the linear fitting in the above diagram
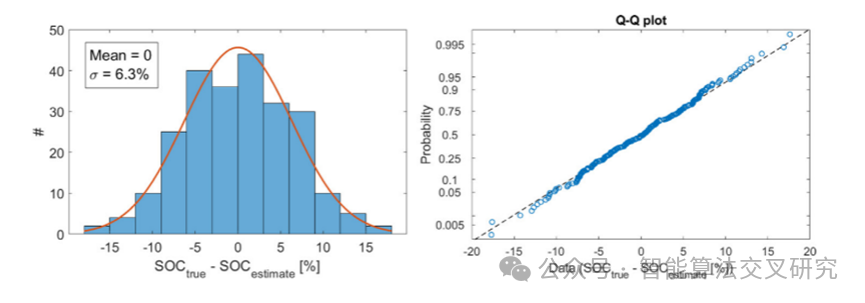
SOC estimation error analysis diagram
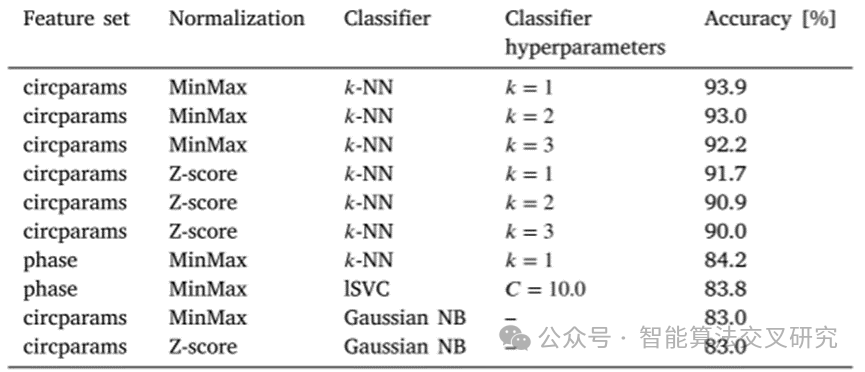
Top 10 combinations of feature sets, normalization methods, and classifiers for SOC estimation accuracy
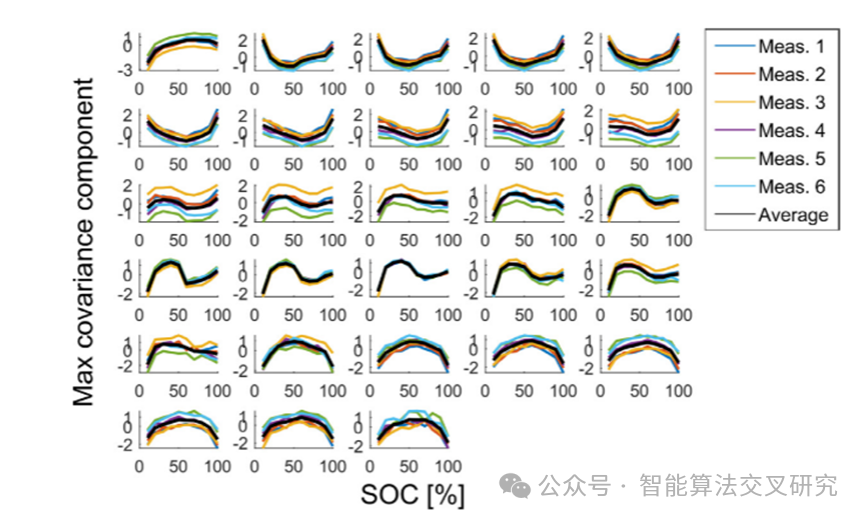
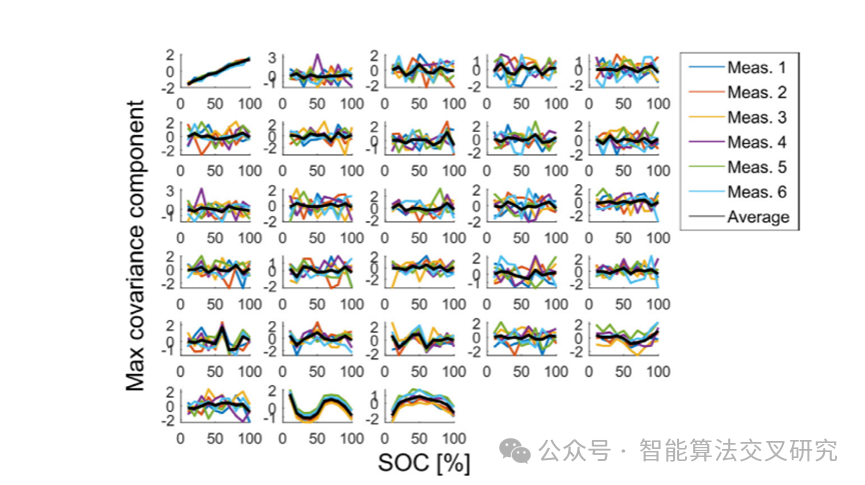
Linear diagram of the correlation between battery SOC and EIS features based on MCA
04
Conclusion
This paper conducts research on the estimation of the state of charge (SOC) of lithium-ion batteries, proposing a high-precision estimation method that combines equivalent circuit models (ECM) with machine learning, systematically verifying the reliability and universality of the method, providing effective technical support for battery state monitoring.
The research first selects multiple lithium-ion batteries as experimental subjects, conducting six repeated electrochemical impedance spectroscopy (EIS) measurements for each battery within the SOC range of 10% to 100%, obtaining raw data that includes the real part, imaginary part, magnitude, phase, and other dimensions to ensure data repeatability and diversity.
The feature engineering phase adopts a “dual-path extraction” strategy: on one hand, basic features such as the real part and imaginary part are directly extracted from the raw EIS data; on the other hand, the EIS data is fitted to a 7-parameter ECM model to obtain physically meaningful dimensionality-reduced features.
Exploratory data analysis verifies the effectiveness of the features: using principal component analysis (PCA) and linear discriminant analysis (LDA) to compare, it is found that ECM parameters significantly outperform the original impedance phase features in distinguishing different SOCs; maximum covariance analysis (MCA) further proves that the first covariance component derived from ECM parameters has a strong linear correlation with SOC (Pearson coefficient close to 1) and exhibits good consistency across batteries; error analysis shows that the estimation error follows a Gaussian distribution with zero mean and a standard deviation of 6.3%, with no systematic bias.
In the machine learning experimental phase, a multi-combination scheme of “feature set + normalization method + classifier” is constructed, using models such as KNN, SVC, Gaussian Naive Bayes, paired with Min-Max scaling and Z-score standardization preprocessing. The experimental results indicate that the combination of ECM parameters + Min-Max normalization + KNN yields the best performance, achieving an SOC estimation accuracy of 93.9%, significantly outperforming the model performance corresponding to the original impedance features.
Lab Discussion Section
Q
What specific materials are used in the batteries from the EIS public dataset mentioned in this paper?
The battery model mentioned in this paper is the Samsung ICR18650-26J, with the positive electrode material being: LiNiCoMnO₂
A
Q
Why is SOC treated as a classification task in this paper?
1. Adaptation to the “discrete condition characteristics” of EIS data
In the experiment, SOC data is collected in discrete intervals, with each SOC level corresponding to a set of independent EIS measurement data, inherently possessing the attribute of “category labels.” Treating SOC as a classification task allows for direct matching with the data collection mode, avoiding the need for additional interpolation or fitting of continuous SOC values, thus preventing data distortion.
2. Reducing model learning difficulty and enhancing estimation stability
Although there is a linear trend between SOC and EIS features, the complex internal electrochemical processes of the battery (such as diffusion, charge transfer, side reactions, etc.) lead to an imperfect continuous mapping relationship between the two. Adopting a classification task can avoid the cumulative errors associated with “predicting precise continuous values,” reduce model learning difficulty, and enhance estimation stability across batteries and multiple repeated measurement scenarios (as seen in the table results, the optimal classification accuracy reaches 93.9%, with no systematic bias in errors).
3. Aligning with practical engineering application needs
In most battery application scenarios (such as electric vehicles, energy storage systems), there is no need to obtain the “absolute precise value” of SOC (e.g., 10.23%); it is sufficient to accurately identify the “approximate range” (e.g., 10%, 20%) to meet core needs such as charge/discharge control and remaining mileage estimation. The output form of a classification task can directly interface with engineering control logic without additional conversion, making it more practical.
4. Facilitating feature effectiveness verification and model comparison
By setting SOC as a classification task, the “classification accuracy” serves as an intuitive metric to quickly compare the performance differences among different feature sets, normalization methods, and classifiers. This quantitative comparison method is straightforward and efficient, providing clear direction for feature selection and model optimization, and is easier to interpret and implement than the “mean squared error” of continuous regression tasks.
A
Q
Since this paper treats SOC as a classification task, can Figure 9 be drawn based on the classification task?
The core experiment of this paper classifies SOC into 10 discrete levels (10%, 20%, …, 100%), using a machine learning classifier to determine which level a sample belongs to, ultimately using “classification accuracy” as the core metric (e.g., 93.9% accuracy in the table). This is the main task of the research, designed to fit the logic of “discrete SOC condition collection and engineering scenario level requirements.” The error distribution analysis in Figure 9 is a “reverse deduction” of the classification results. It treats the output “SOC level” from classification as the “regression prediction value” and calculates the error with the true SOC (continuous value) to analyze the absolute error characteristics of the method.
Even if the core task is classification, as long as the output “level” from classification is treated as a “predicted value” and subtracted from the true continuous SOC value, the “error” can be obtained, allowing for the creation of a histogram like Figure 9. For example: Classification task output:
“This battery belongs to the 50% level”
True SOC: 52%
Error: 52% – 50% = 2%
By aggregating the results of all samples’ “true value classification levels,” a histogram of the error distribution and a Q-Q plot can be generated. This analysis serves as a “precision safety net verification” of the classification results, demonstrating that the model can “correctly classify levels” (high classification accuracy) and that the “gap between levels and true values is controllable” (reasonable error distribution), enhancing the reliability of the method.
A
Original Information
E. Buchicchio, et al. “Battery SOC estimation from EIS data based on machine learning and equivalent circuit model” Energy (2023), 283, 128461
Important Note
This post is organized by the members of this public account (Xiao Shu Laboratory, Xiao Shu Jun ID 4.21) based on the original content, and includes related discussions. There may be technical or translation errors, and it is for reference only. Copyright belongs to the publisher and authors of the paper. If there is any infringement, please contact us for deletion!
In Conclusion
We firmly believe that
the essence of scientific research lies in openness,
and sincerity is the only path to great wisdom.
At Xiao Shu Laboratory (Intelligent Algorithm Cross-Research),
we are willing to practice this belief with sincerity:
What we know, we share generously;
What you excel at, we will cherish,
and give back with double the effort.
We look forward to your attention, sharing, and recommendations,
so that we can grow together through the collision of ideas.
Welcome to follow Xiao Shu Laboratory