Steps for debugging using virtual serial ports:1 First, you need a virtual serial port software, Configure Virtual Serial Port Driver.2 Next, you need virtual serial port debugging software, you can use a free serial port debugging assistant + TCP/UDP software.3 Install the virtual serial port software first, and the interface after installation looks like this: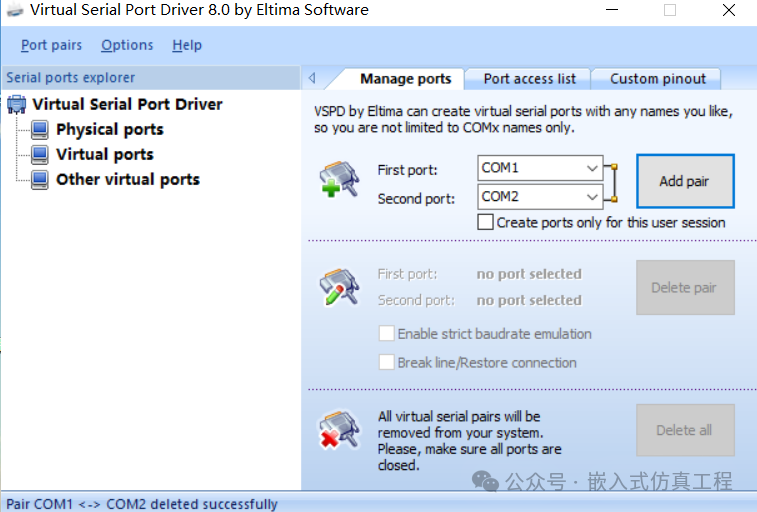 4 You need to add a virtual port, do you see the ADD PAIR button on the right? Use it, but wait, you need to select from the two
 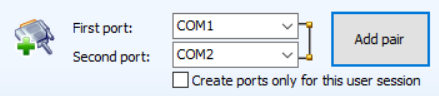 drop-down boxes first. In the First drop-down box, select COM1, and in the Second drop-down box, select COM2. After completing these two steps, the interface looks like this:
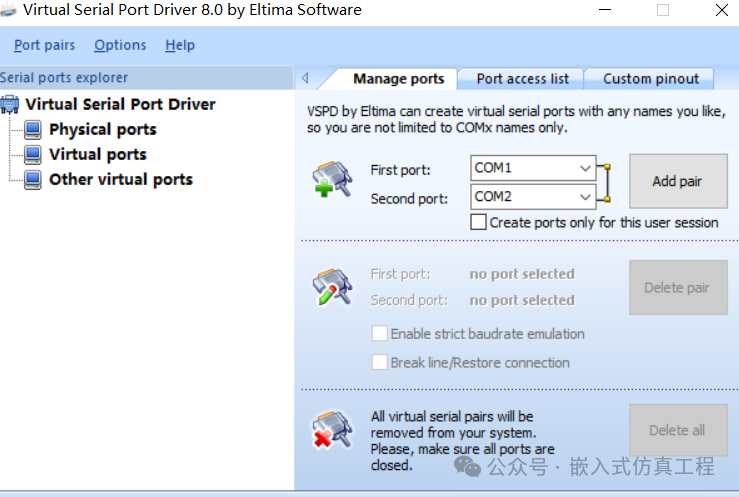 5 Now click the ADD pair button, and when you click it, you will see the left window appear like this:The entire window looks like this
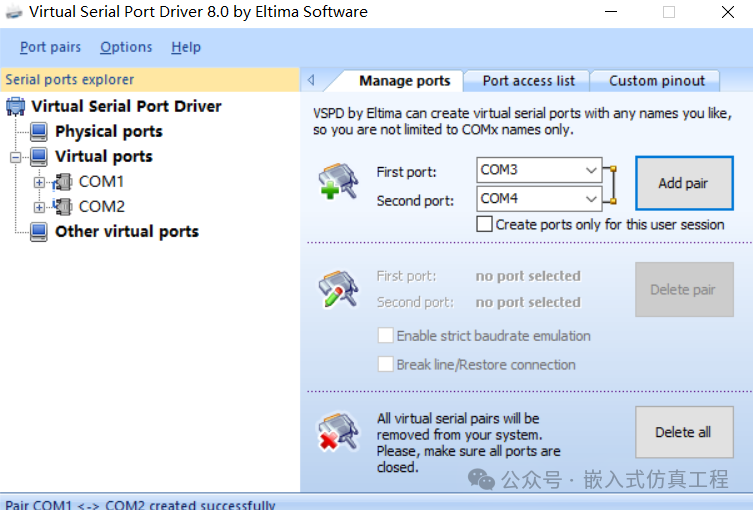 Don’t worry about the First and Second drop-down boxes returning to their original state; this is caused by the software automatically resetting. At this point, your virtual serial port has been created.6 Next, we will start the serial port debugging assistant and you will see the interface as follows:
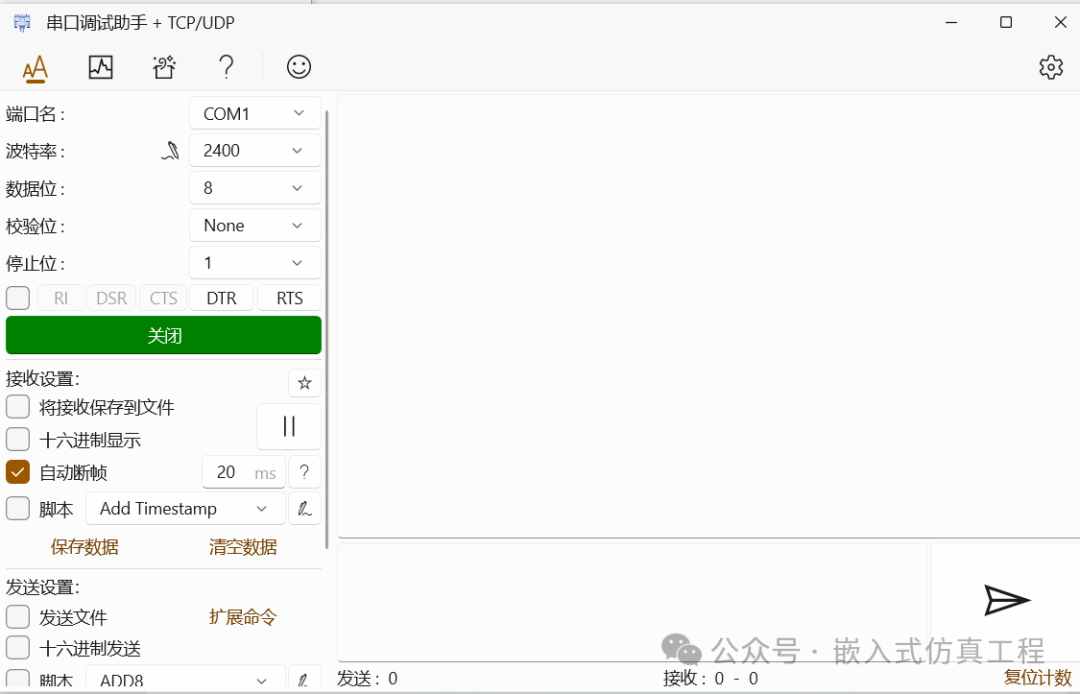 Here, you only need to pay attention to the selection drop-down boxes for the serial port number and baud rate. The first time you start, as shown in the figure, the serial port number is: COM1; the baud rate is: 2400(depending on the situation, my interface looks like this, it doesn’t matter if it’s different).7 Now we should use the serial port debugging example, open the example project file TERMECHO.pdsprj in the COMPIM Demo folder that comes with Proteus, and double-click to open the interface as shown below:
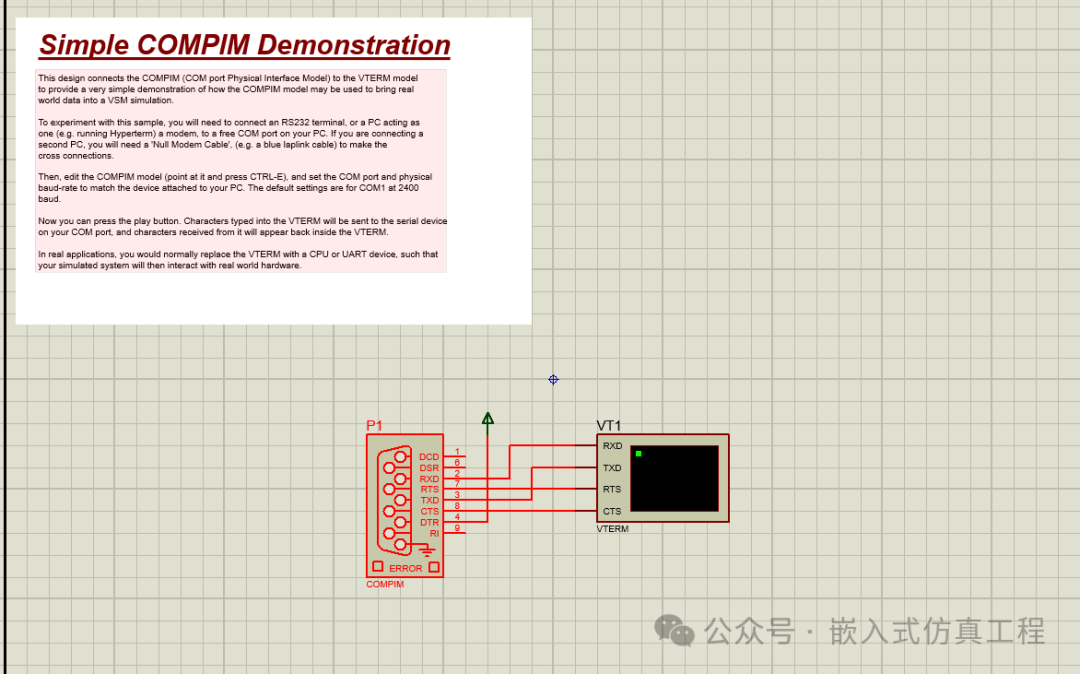 To make a lasting impression, the compim component on the right is highlighted in red. Right-click on the red compim, the COMPIM model is a simulation model that comes with Proteus, and examples can be found in its samples directory. After right-clicking, the interface looks like this:
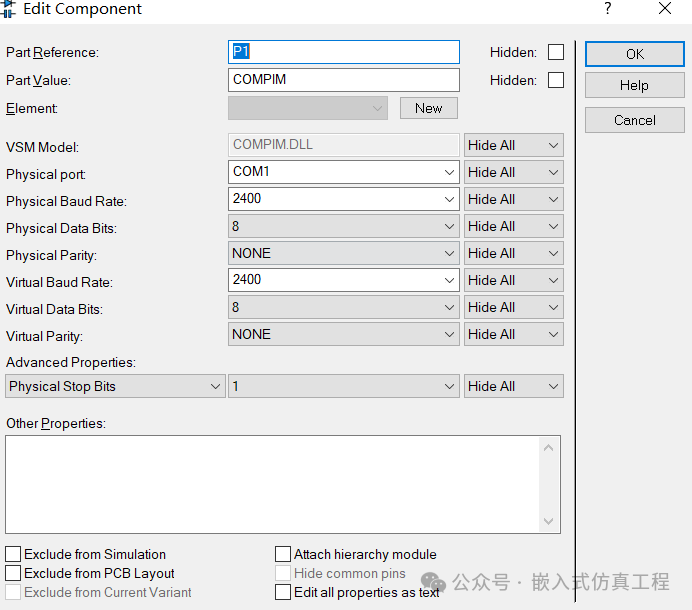 We need to pay attention to the Physical port, Physical Baud Rate, and Virtual Baud Rate settings. Please remember their values, especially the baud rate must match the value specified in the source file. For example, here it is 2400, which is set in the source file. Here, we must select according to the virtual serial port created earlier, where we created a pair of COM1 and COM2, select COM1. After setting, the interface looks like this:
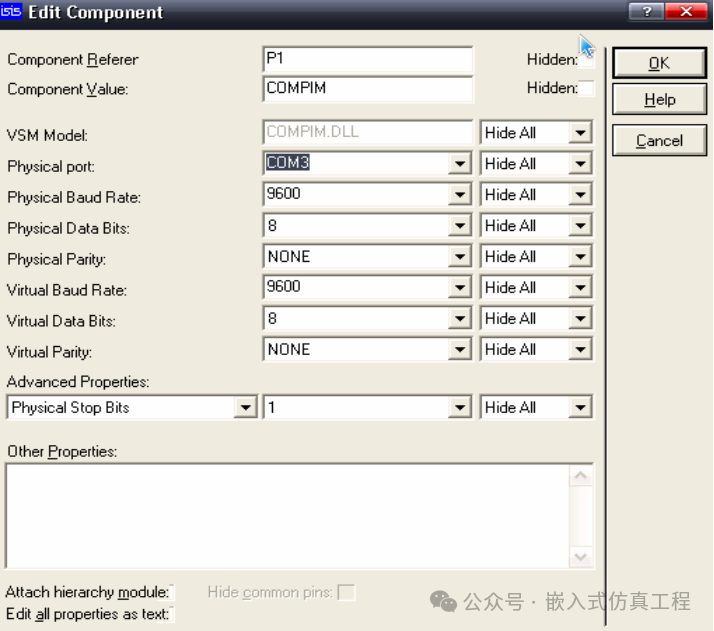 8 Now, we need to return to the serial port debugging assistant, remember the initial interface looks like this:We need to set the serial port number and baud rate. The serial port number must be set to COM2 here, as we set it to COM1 in the compim. The baud rate must match the baud rate set in compim. Alright, it should look like this.
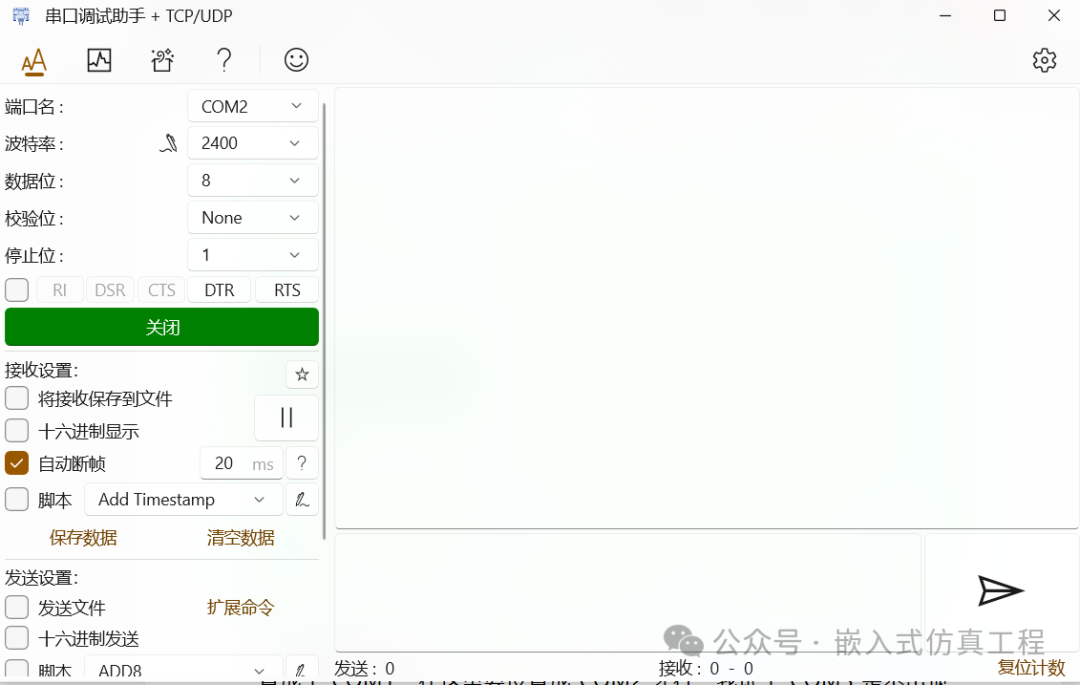 Carefully compare to avoid errors.10 All the preparation tools are complete, and now you can start running the simulation. You can input characters in the serial port debugging assistant + TCP/UDP input box and observe the output in the VIRTUAL TERMINAL.Welcome to follow (operation reference article: send messages by following the public account), click the blue text at the top “Embedded Simulation Project” or long press to recognize the QR code to follow